What's new in Dynatrace Managed version 1.332
- Release notes
- 5-min read
- Rollout start on Feb 16, 2026
This page showcases new features, changes, and bug fixes in Dynatrace Managed version 1.332. It contains:
Feature updates
Application Observability | Distributed Tracing
Improved configuration experience for AWS Lambda monitoring
This release introduces several usability and reliability improvements to the Lambda deployment workflow, ensuring consistent behavior across deployment types and preventing common misconfigurations.
Automatic DT_CONNECTION_BASE_URL selection using ActiveGate
To improve reliability and eliminate misconfigurations, the deployment process now detects a public ActiveGate URL as the DT_CONNECTION_BASE_URL whenever possible.
- The system automatically selects an available ActiveGate endpoint.
- Cluster URLs are no longer used as a fallback.
This prevents connection issues and ensures proper OneAgent communication.
If no ActiveGate is available:
- You now receive a clear, actionable error message explaining the issue.
- You must manually provide a Dynatrace endpoint.
- The Endpoint address field includes an inline tooltip with updated guidance:
This ensures users always configure a valid endpoint.
Classic Lambda monitoring behavior for Managed‑offline
- Classic Lambda monitoring is now always enabled.
- The Enable Classic Lambda monitoring checkbox has been removed from the UI to prevent accidental disabling.
- This ensures monitoring continuity without requiring intervention from Dynatrace ONE.
Application Observability | Distributed Tracing
Improved service correlation for AWS Lambda function messaging triggers
We’ve improved the service correlation for messaging triggers in AWS Lambda functions that are monitored by the OneAgent AWS Lambda Layer.
Application Observability | Services
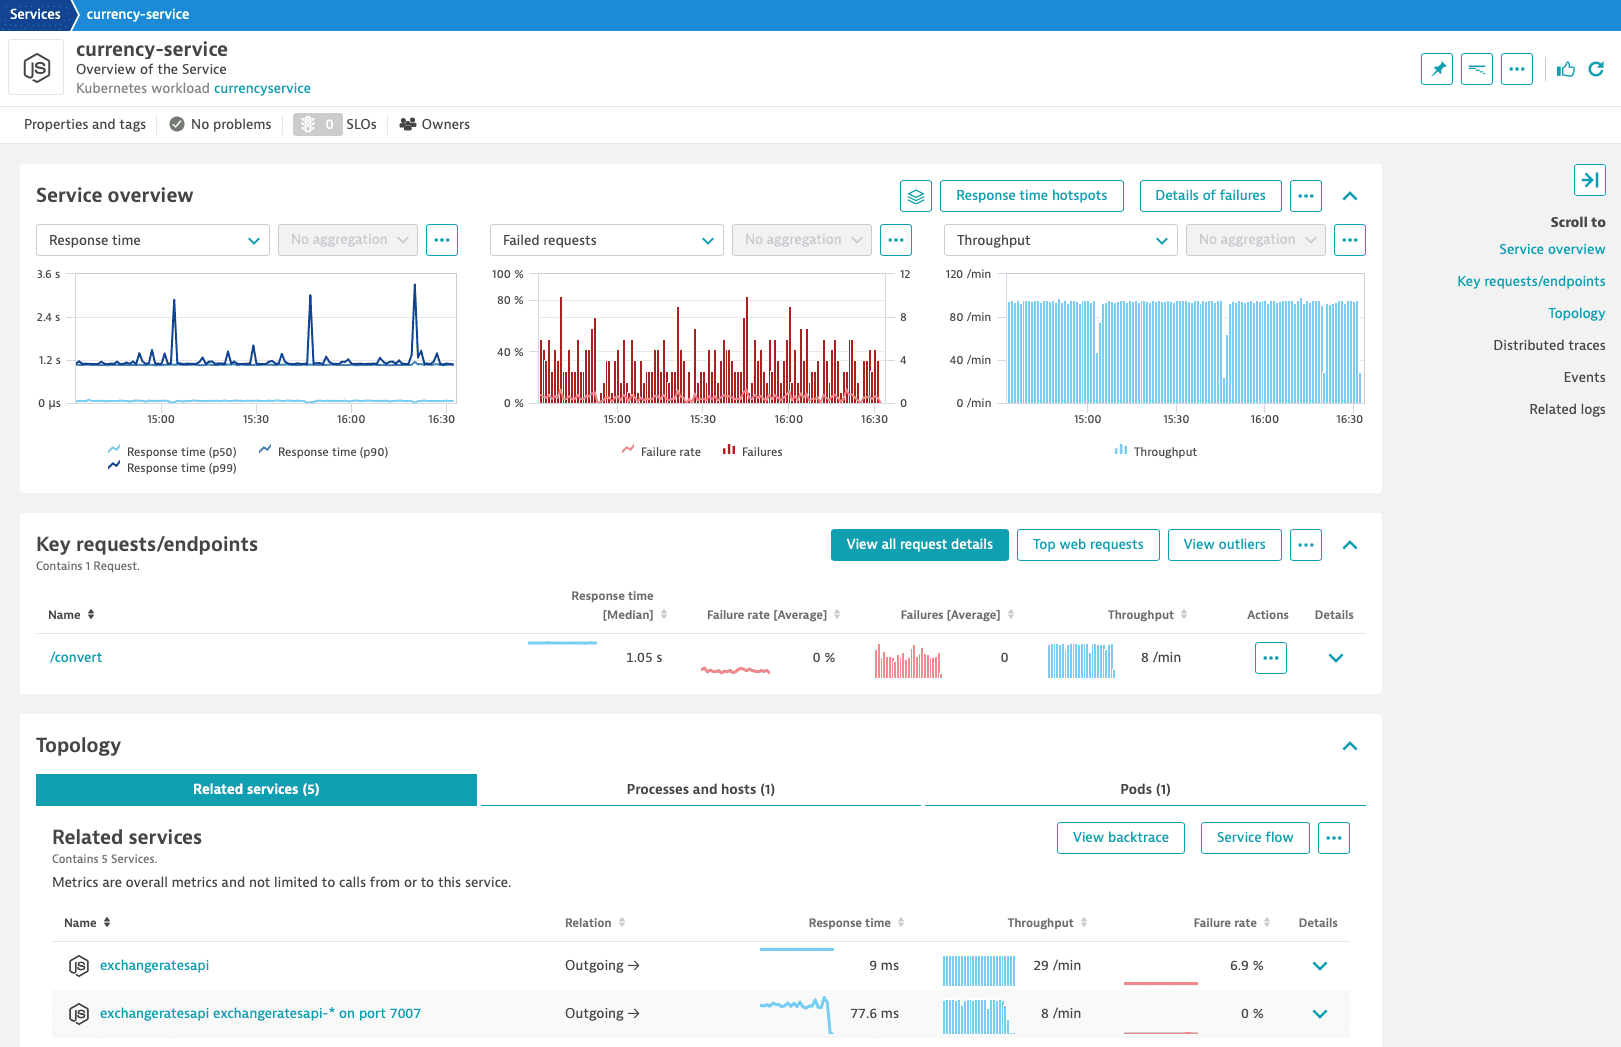
New Services page enabled per default
The new Service page is now enabled by default in all environments, so that you can benefit from the new design and analysis functions.
Application Security | Vulnerabilities
Application Security now uses the Dynatrace vulnerability feed
With Dynatrace Managed version 1.334, the Third-party vulnerability detection will be upgraded to use the Dynatrace vulnerability feed. This upgrade provides more accurate, transparent, and threat‑aware vulnerability data while maintaining strong coverage of critical risks.
As part of this change, a small percentage of previously detected vulnerabilities will no longer be covered and will be marked as deprecated. After the switch, you can review these items in Third-party vulnerability detection using the Status > Deprecated filter. For details, see Introducing the Dynatrace Vulnerability feed: Accurate, transparent, and threat-aware.
FinOps
Cost Allocation export now includes all Dynatrace SaaS capabilities
The Cost Allocation export now includes all Dynatrace SaaS capabilities. Previously, the export included just those capabilities that are configured or already supported by Cost Allocation.
This provides a complete cost and usage view that enables FinOps practices to work with total platform costs, regardless of your current Cost Allocation configuration or maturity.
Historical data is available starting from January 26, 2026.
Infrastructure Observability | Clouds
Classic Cloud Platform Monitoring: New Metrics for Amazon CloudWatch And Azure Monitor
The following new metrics are now available for Amazon CloudWatch and Azure Monitor.
Azure DB for PostgreSQL — Flexible Server
| Metric | Display Name | Resolution | Aggregations |
|---|---|---|---|
| Active client connections | PT1M | Max, Min, Avg |
| Waiting client connections | PT1M | Max, Min, Avg |
| Number of connection pools | PT1M | Max, Min, Avg |
| Active server connections | PT1M | Max, Min, Avg |
| Idle server connections | PT1M | Max, Min, Avg |
| Max connections | PT30M | Max |
| Total pooled connections | PT1M | Max, Min, Avg |
The connection pool metrics (client_connections_*, num_pools, server_connections_*, total_pooled_connections) are dimensioned by DatabaseName and ServerName; max_connections is dimensioned by ServerName only.
Azure SQL Database — Hyperscale
| Metric | Display Name | Resolution | Unit | Aggregations |
|---|---|---|---|---|
| Data space used | PT1M | Byte | Max, Min, Avg |
Amazon Aurora
| Metric | Display Name | Dimensions | Unit | Statistics |
|---|---|---|---|---|
| DB Cluster Max Connections (Requires: Database Insights Advanced and Performance Insights) | DBClusterIdentifier | Count | Multi |
Amazon RDS
| Metric | Display Name | Dimensions | Unit | Statistics |
|---|---|---|---|---|
| DB Instance Max Connections (Requires: Database Insights Advanced and Performance Insights) | DBInstanceIdentifier | Count | Multi |
Platform
Metric queries can include values from deleted entities
When querying a metric retrospectively, certain monitored entities may no longer be available and are therefore excluded from the result. This can lead to an incomplete result, especially for billing metrics. You can now use the entity selector to specify that deleted entities should be included. For details, see Entity selector - Inclusion of deleted entities.
Platform
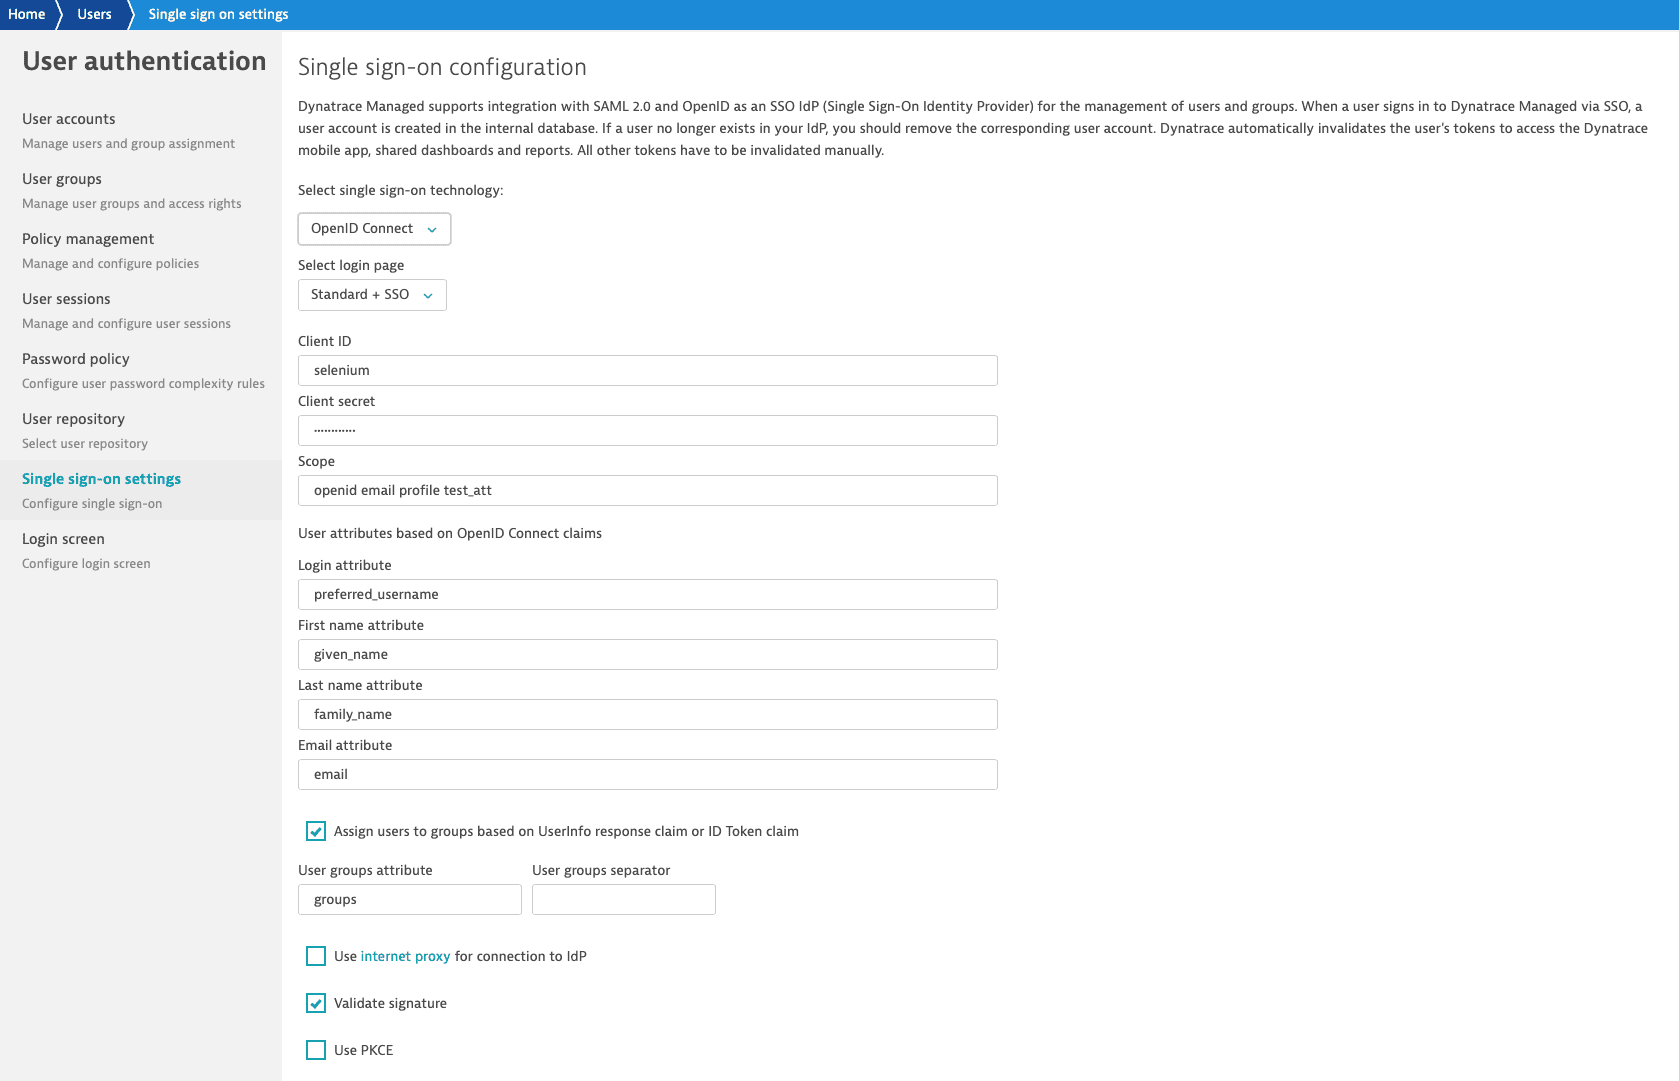
Added PKCE support for OpenID Connect
Dynatrace Managed now supports PKCE (Proof Key for Code Exchange) for OpenID Connect. PKCE is an extension to the OAuth 2.0 authorization code flow, designed to prevent authorization code interception attacks.
To enable it
- Go to CMC > User authentication > Single sign-on settings.
- Select OpenID Connect as the SSO technology.
- Turn on Use PKCE.
Platform
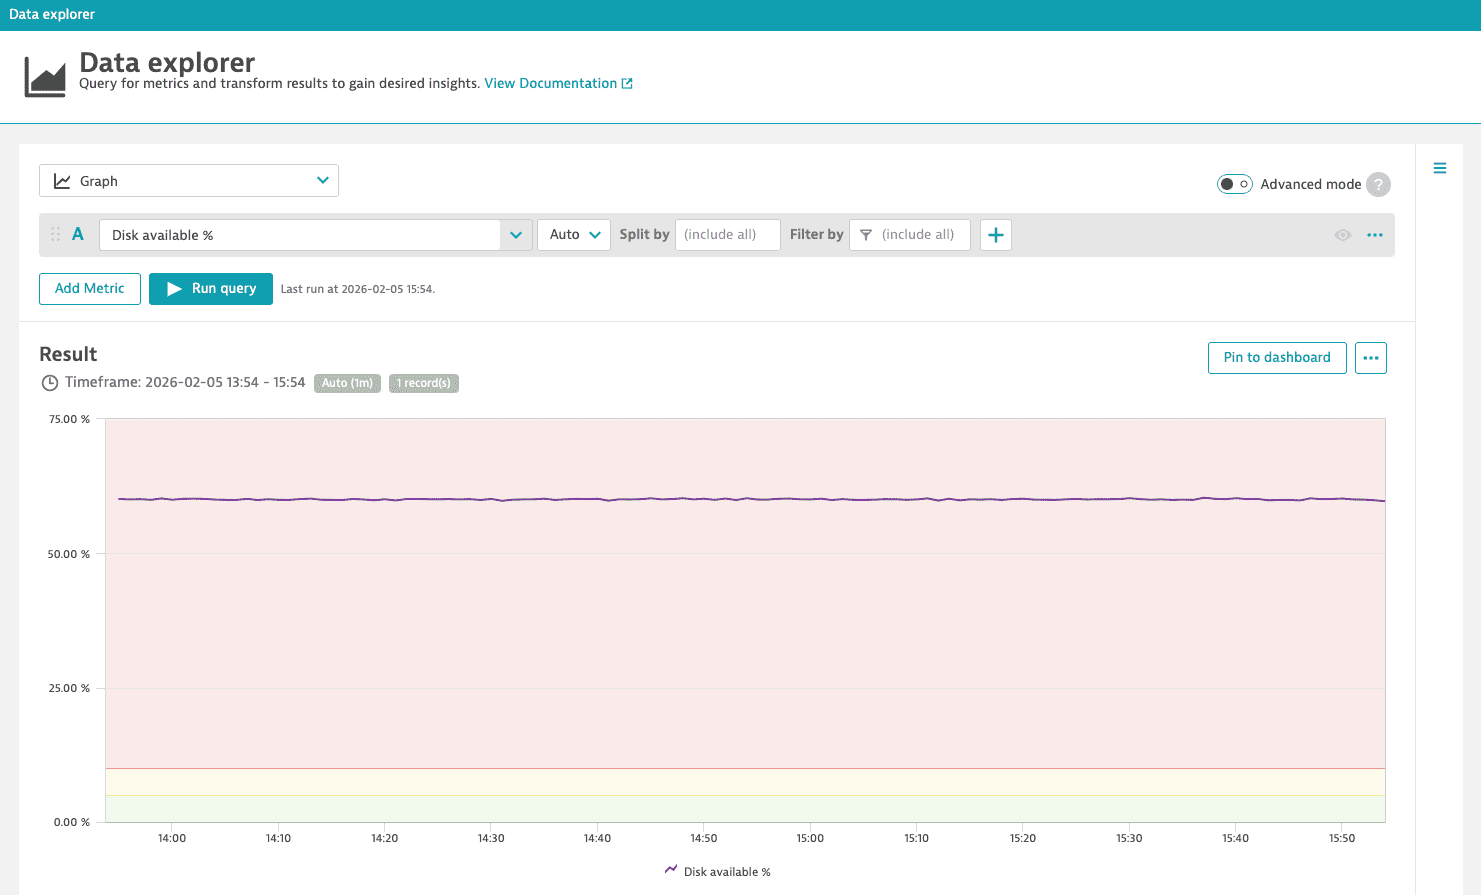
Minimize Data Explorer settings panel
You can now minimize the Data Explorer settings panel to free up more space for the charts. This can be especially helpful on small screens.
Platform
New configuration option to differentiate between similar event reports
You can now define a correlation tag for all event sources, dt.event.correlation_tag. Use this optional tag to explicitly create separate events even if the event reports are based on similar event data, such as title and entity.
For more details, see Event analysis and correlation.
Platform | OneAgent
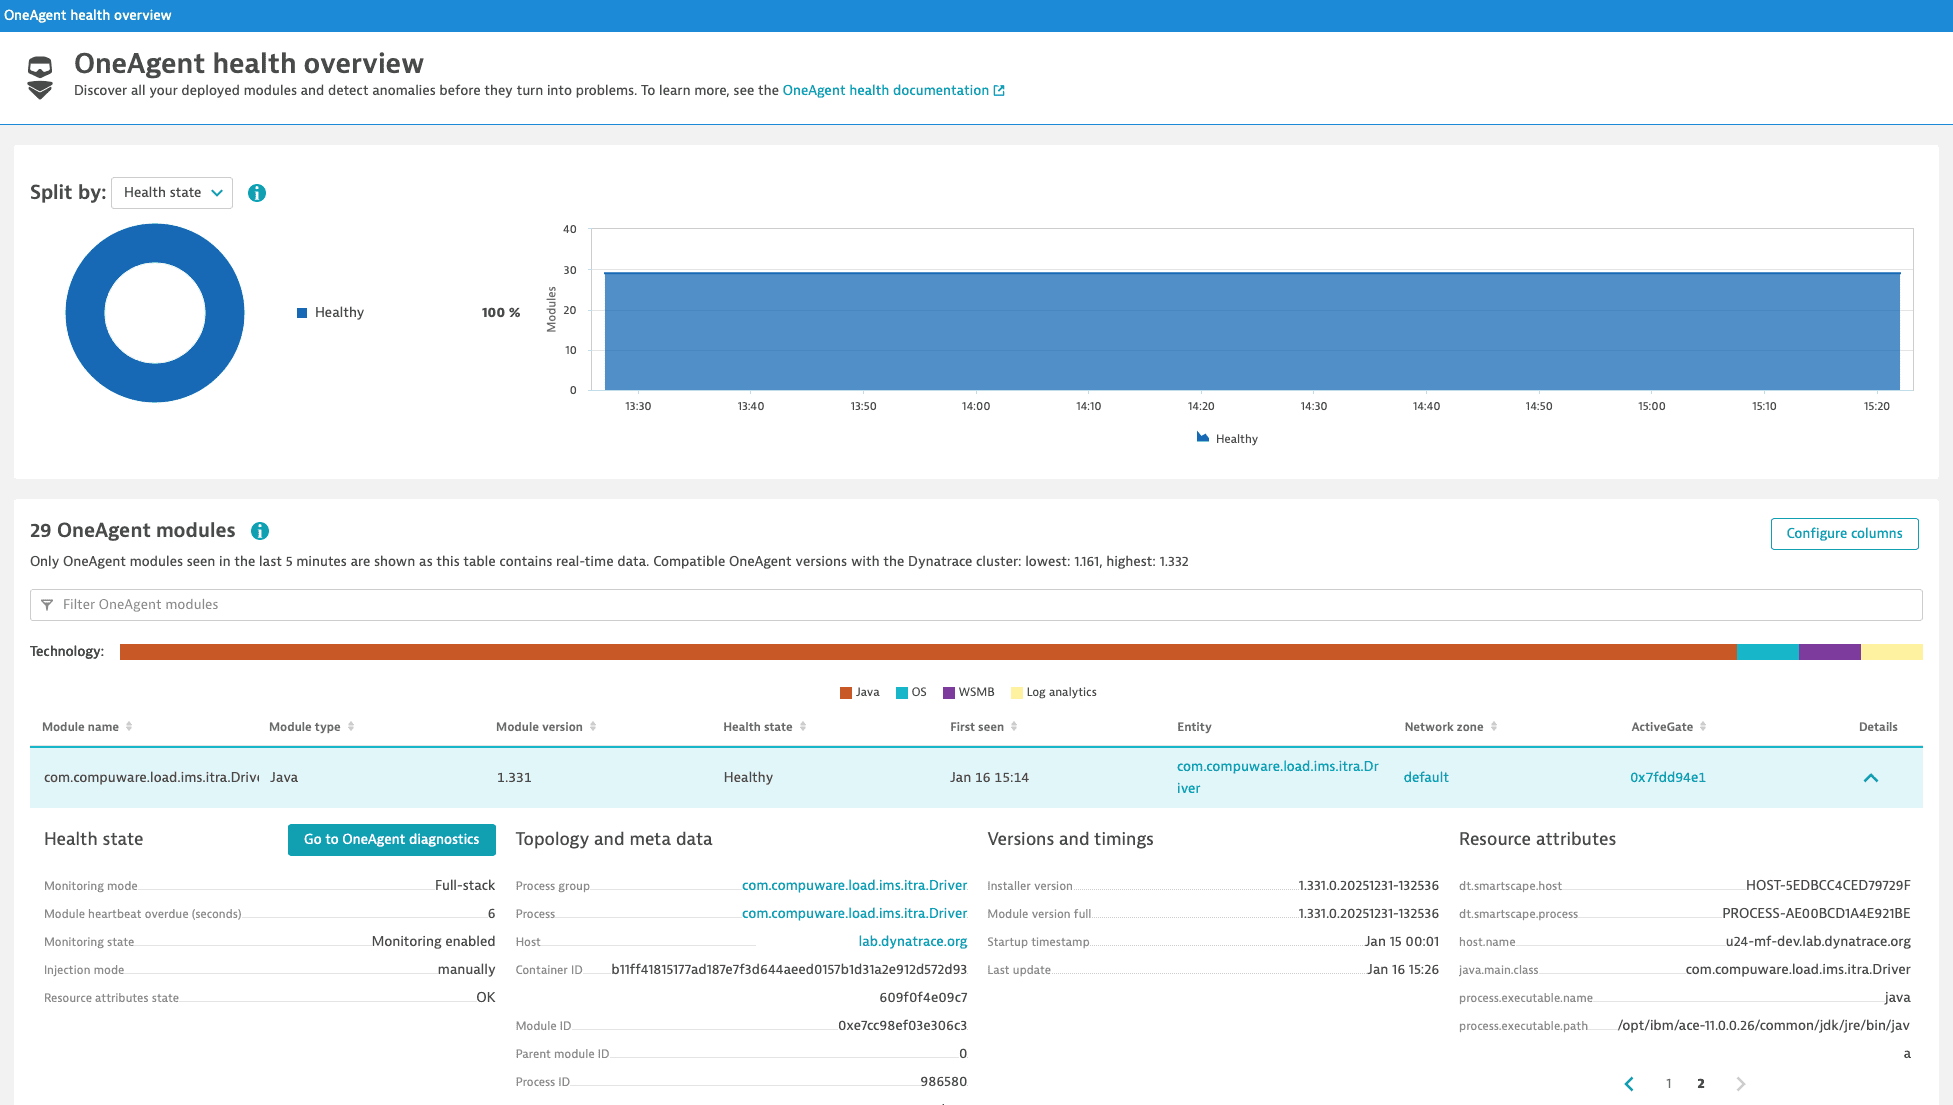
OneAgent Health now includes resource attributes
You can now access the resource attributes captured by the code modules in OneAgent Health. To view them, select a code module in the data table and expand the details section.
Resource attributes can be used as input for Service detection v2 rules.
Platform | OneAgent
tmpfs monitoring via OneAgent available as opt-in behavior
We’ve updated OneAgent so it can now monitor tmpfs data on Linux systems. You can activate this monitoring on an opt-in basis, at Settings > Collect and capture > Infrastructure > OS > Enable tmpfs disk monitoring.
Breaking changes
Platform
Removed backward compatibility for ActiveGates older than version 1.172
Since ActiveGate version 1.172, all ActiveGates support prioritized endpoint lists. To reduce product complexity, non-prioritized endpoint lists are no longer supported.
If you are still using ActiveGates versions older than 1.172, you need to update them to a supported version.
Platform
Local self-monitoring environment name can no longer be changed
To improve Dynatrace support for Managed clusters, the name of the local self-monitoring environment has been set to "Local Self-Monitoring" and can no longer be changed via the Cluster Management Console.
If the name of the local self-monitoring environment has already been changed, it will be reset to "Local-Self-Monitoring".
Platform
Sunset of native mobile apps (iOS & Android) for Dynatrace
As part of our ongoing commitment to delivering a streamlined and consistent user experience, Dynatrace is retiring its native mobile applications for iOS and Android. This change aligns with our strategy to provide a unified, responsive web interface and leverage modern, flexible notification channels.
Key dates
- Last app update: End of 2025
- Sunset date: June 30, 2026
- Support ends: June 30, 2026
What’s changing?
The Dynatrace native mobile apps will no longer be available for download or supported after the sunset date.
We encourage you to access Dynatrace via the responsive web interface, which offers full functionality across all device types and screen sizes.
Push notifications will now be delivered through third-party integrations such as Slack, Teams, PagerDuty, email, and ntfy.
Why this change?
- Unified experience: A single responsive web platform ensures consistent functionality across all devices.
- Flexibility: You can choose your preferred communication tools for alerts and updates.
Recommended actions
- Begin using the responsive web interface.
- Set up your preferred notification integrations via:
- Dynatrace SaaS: Workflows
- Dynatrace Managed: Problem Notifications
- Remove the native app from your devices after the sunset date.
Need help?
For assistance with transitioning or setting up integrations, see the documentation links above or contact our support.
Fixes and maintenance
Resolved issues in this release
- Fixed an issue where reopening the global timeframe selector caused timezone row duplication. (MGD-9441)
- Updated the log4j library for CVE-2025-68161 to avoid false positives in security scanners. Dynatrace server is not affected by this CVE security notice. (MGD-9264)
- Fixed a problem with the NGINX health check module, which is responsible for redirecting traffic between cluster nodes. (MGD-9000)
- Previously, the
 Data Explorer search filter provided empty suggestions in certain scenarios. We’ve resolved this error so that the search filter always shows the relevant suggestions. (MGD-8961)
 - Previously, Data Explorer showed the local timeframe for unsupported visualization types or even when it was deactivated. This behavior has been fixed so the local timeframe is now visible only when activated, and only for supported visualization types. (MGD-8770)
- The timeframe visualization for the tiles in the Data Explorer and Dashboards has been corrected. Time periods extending into the future are now limited to the present time. (MGD-7906)
- Previously, email notifications about Synthetic monitoring entities, such as impacted network availability monitors, displayed the affected entities in green text when they should have been displayed in red. This behavior is now fixed, and affected entities are always shown in red. (DI-24639)
- Vulnerability: We introduced additional access controls for an internal Hub API endpoint that is routed through Mission Control’s reverse proxy. This endpoint is intended for managed nodes and was not designed for public use. The backport adds authentication to prevent unintended access and reduce residual security risk. (ASDY-3035)
Dynatrace API
To learn about changes to the Dynatrace API in this release, see:
Operating systems support
Future Dynatrace Managed operating systems support changes
The following operating systems will no longer be supported starting 01 November 2026
- Linux: Red Hat Enterprise Linux 9.4, 9.7
- x86-64
- Vendor announcement
- Linux: Ubuntu 16.04
- x86-64
- Vendor announcement
The following operating systems will no longer be supported starting 01 January 2027
- Linux: Amazon Linux 2
- x86-64
- Vendor announcement
Past Dynatrace Managed operating systems support changes
The following operating systems are no longer supported since 01 December 2025
- Linux: Red Hat Enterprise Linux 8.8, 9.2, 9.5
- x86-64
- Vendor announcement
- Linux: Oracle Linux 9.5
- x86-64
- Vendor announcement
- Linux: Rocky Linux 9.5
- x86-64
- Vendor announcement
The following operating systems are no longer supported since 01 January 2026
- Linux: Debian 10
- x86-64
- Vendor announcement
The following operating systems are no longer supported since 01 June 2026
- Linux: Oracle Linux 9.6
- x86-64
- Vendor announcement
- Linux: Rocky Linux 9.6
- x86-64
- Vendor announcement
The following operating systems are no longer supported since 01 July 2026
- Linux: SUSE Enterprise Linux 15.3
- x86-64
- Vendor announcement