Local self-monitoring environment
- Extension
- Published Nov 16, 2021
A Dynatrace Managed cluster includes a dedicated local self-monitoring environment that collects internal deployment self-monitoring metrics. This environment is a fully working and accessible Dynatrace environment. It includes all the self-monitoring metrics collected and aggregated from the other environments on your Dynatrace Managed cluster. Data is exclusively stored on premises on your cluster. For details, see Self-monitoring metrics.
Details
The extension is intended for users who are responsible for monitoring health and size of the Dynatrace Managed Cluster
The extension enables you to:
- Get an overview of current Dynatrace cluster utilization.
- Check if Dynatrace cluster is properly sized to handle current load.
- Review current and past ingest of data into the Dynatrace cluster, e.g. service calls or user sessions / actions.
- View number of connected OneAgents to the Dynatrace cluster over time
Self-monitoring environment
You can navigate to the self-monitoring environment from the user menu, just as you would to any other environment. The local self-monitoring environment is named Local-Self-Monitoring. It is also displayed in the Cluster Management Console so you can assign user permissions to it.
Explore self-monitoring metrics
For an overview of the currently implemented self-monitoring metrics, filter for metrics prefixed with dsfm: in the metrics browser. The metrics description provides details. You can use the self-monitoring environment to set up proper alerting or further dashboarding. The environment is protected from deletion.
Licensing
The self-monitoring environment is excluded from license consumption. Certain functionality is restricted in this self-monitoring. For example, it is not possible to connect OneAgents to the self-monitoring environment.
Requires DDU licensing
For technical reasons, the self-monitoring environment is enabled only for Dynatrace Managed customers using DDU licensing, although the self-monitoring environment is excluded from all license consumption.
Cluster deployment health and utilization dashboard
The dashboard shows aggregated data for the environments in your managed cluster. It gives you an impression of the current utilization of your cluster and whether your cluster is still properly sized to cope with the current load.
This dashboard provides
- Insights into the current utilization of your managed cluster and Dynatrace server.
- An overview of the different data ingest channels and the current capture rate.
- An overview of the Dynatrace OneAgents connected.
The self-monitoring dashboard is available for Dynatrace Managed clusters to be used in the self-monitoring environment of the cluster. Although it can be used in other environments (Managed and SaaS), some of the data shown may be inaccurate for these.
Get started
- Go to the Dynatrace Managed self-monitoring environment in which you want to install the dashboard.
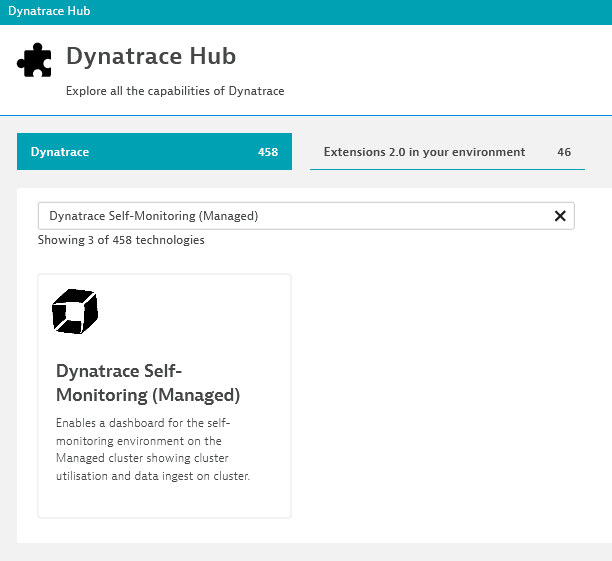
- In Dynatrace Hub, select Dynatrace Self-Monitoring (Managed).
- Select Add to environment in the lower-right corner to install the self-monitoring extension in your environment.

This extension enables a dashboard for the self-monitoring environment on the Managed cluster showing cluster utilization and data ingest on cluster.