Calculate your consumption of Full-Stack Monitoring (DPS)
- Explanation
- 5-min read
This page describes how the Full-Stack Monitoring DPS capability is consumed and billed. For an overview of the capability, including its main features, see Full-Stack Monitoring.
How consumption is calculated: GiB-hour
Dynatrace uses GiB-hours (referred to as "memory-gibibyte-hours" in your rate card) as the unit of measure for calculating your organization's consumption of host monitoring in Full-Stack Monitoring mode.
The advantage of the GiB-hour approach to monitoring consumption is its simplicity and transparency. Technology-specific factors (for example, the number of JVMs or the number of microservices hosted on a server) don't affect consumption. It doesn't matter if a host runs .NET-based applications, Java-based applications, or something else. You can have 10 or 1,000 JVMs; such factors don't affect an environment's monitoring consumption.
Dynatrace is built for dynamic cloud-native environments where hosts and services are rapidly spun up and destroyed. Therefore, billing granularity for GiB-hour consumption is calculated in four 15-minute intervals per hour. When a host or container is monitored for fewer than 15 minutes in an interval, GiB-hour consumption is rounded up to 15 minutes before consumption is calculated.
How consumption is calculated for hosts
The more memory that a host has, and the longer that the host is monitored, the higher the number of GiB-hours that the host consumes.
Each installed instance of Dynatrace OneAgent running on an operating system instance (deployed on either K8s, a container platform, or a physical or virtual machine) in Full-Stack Monitoring mode consumes GiB-hours based on the monitored host's physical or virtual RAM, calculated in 15-minute intervals (see the diagram example below).
The RAM of each VM or host is rounded up to the next multiple of 0.25 GiB (which equates to 256 MiB) before monitoring consumption is calculated. A 4 GiB minimum is applied to GiB-hour consumption for physical and virtual hosts. For example, a host with 8.3 GiB memory is counted as an 8.5 GiB host, being the next multiple of 0.25 GiB, while a host with 2 GiB memory is counted as a 4 GiB host (no rounding needed, but application of the 4 GiB minimum).
How consumption is calculated for containers (application-only monitoring)
Memory-size calculations for containers monitored in an application-only approach are based on either:
-
The container's used memory.
- OneAgent version 1.275+ (for Kubernetes containers)
- OneAgent version 1.297+ (for serverless containers)
-
Container-defined memory limits. If no memory limit is set, the memory of the underlying virtual machine is used instead.
- OneAgent version <1.275 (for Kubernetes containers)
- OneAgent version <1.297 (for serverless containers)
Automatic container detection needs to be enabled for existing tenants.
Certain monitoring scenarios have their own calculations for GiB-hour consumption, as described in the table below.
| Scenario | Description |
|---|---|
| Azure App Services (running on the App Service (dedicated) plan for Windows) | Consumption is based on the number and memory of the plan's instances. It does not matter how many applications run on the instances. The minimum billed memory is 256 MiB (instead of 4 GiB). |
| Azure App Service (running on Linux OS or Linux containers) OneAgent version 1.297+ | If automatic container detection is enabled: consumption is based on the used memory of the container. If automatic container detection is not enabled: consumption is based on the memory of the plan's instance, multiplied by the number of running containers. |
| Azure App Service (running on Linux OS or Linux containers) OneAgent version <1.297 | Consumption is based on the memory of the plan's instance, multiplied by the number of running containers, regardless if automatic container detection is enabled or not. |
| Oracle Solaris Zones | Solaris Zones are counted as hosts. |
| Monitored containers that are not detected as containers | These containers are counted as hosts. |
In cloud-native environments, services and hosts are often short-lived. Therefore, calculating monitoring consumption in 15-minute time intervals, rather than full hours, better reflects actual usage. Containers, which are an essential mechanism in cloud-native environments, typically use less memory than hosts. Therefore, the minimum memory threshold for containers is 256 MiB, rather than 4 GiB, the minimum memory threshold for hosts.
The same rounding as for hosts, to the next multiple of 0.25 GiB, also applies to containers. For example, a container with 780 MiB memory is counted as a 1 GiB container (780 MiB, which equals 0.78 GiB, being rounded up to the next multiple of 0.25 GiB).
The diagram below illustrates how memory is counted for GiB-hour consumption calculations at 15-minute intervals.

GiB-hour consumption for hosts and containers is based on memory size, calculated in 15-minute intervals each hour. Each interval is divided by 4 in order to reach the GiB-hour consumption unit of measure.
Metrics included with Full-Stack Monitoring
This section assumes that you have followed the Dynatrace-recommended deployment options. If you implement a custom deployment, the charging of included Metrics may still work as described–but this is not guaranteed by Dynatrace.
Full-Stack Monitoring includes:
- Infrastructure Monitoring metrics.
- Application performance monitoring metrics.
- Other built-in metrics.
These never produce any charge.
Metric data points that exceed your included volume of metric data points are charged as Custom Metrics Classic.
Considering the example shown in Figure 1, here are the calculations for the included metric data point volumes for each of the four 15-minute intervals, assuming a volume of 900 included metric data points for each 15-minute interval.
- First 15-minute interval:
900 (included metric data points) × 13.5 (GiB memory) = 12,150 included metric data points - Second 15-minute interval:
900 (included metric data points) × 9.5 (GiB memory) = 8,550 included metric data points - Third 15-minute interval:
900 (included metric data points) × 8.75 (GiB memory) = 7,875 included metric data points - Fourth 15-minute interval:
900 (included metric data points) × 0.25 (GiB memory) = 225 included metric-data-points
If Metrics powered by Grail does not exist on your rate card, metric data points are charged as Custom Metrics Classic.
Track your consumption
This section describes the different Dynatrace tools that you can use to track consumption and costs.
Track your consumption with Metrics
Dynatrace provides built-in usage metrics that help you understand and analyze your organization's consumption of Full-Stack Monitoring.
To use these metrics, in Data Explorer, enter DPS in the Search field.
Here are the metrics you can use to monitor the consumption of Dynatrace Full-Stack Monitoring.
- (DPS) Full-Stack Monitoring billing usage
Key:
builtin:billing.full_stack_monitoring.usageDimension: count
Resolution: 15 min
Description: Total GiB memory of all hosts monitored in Full-Stack Monitoring mode counted in 15-min intervals.
- (DPS) Full-Stack Monitoring billing usage per host
Key:
builtin:billing.full_stack_monitoring.usage_per_hostDimension: Host (
dt.entity.host)Resolution: 15 min
Description: GiB memory per host monitored in Full-Stack Monitoring mode counted in 15-min intervals.
- (DPS) Full-stack usage by container type
Key:
builtin:billing.full_stack_monitoring.usage_per_containerDimension: application_only_type; k8s.cluster.uid; k8s.namespace.name
Resolution: 15 min
Description: GiB memory per container monitored in Full-Stack application-only Monitoring mode counted in 15-min intervals.
- (DPS) Total metric data points reported by Full-Stack monitored hosts
Key:
builtin:billing.full_stack_monitoring.metric_data_points.ingestedDimension: Count
Resolution: 15 min
Description: Number of reported metric data points aggregated over all Full-Stack monitored hosts.
- (DPS) Metric data points reported and split by Full-Stack monitored hosts
Key:
builtin:billing.full_stack_monitoring.metric_data_points.ingested_by_hostDimension: Host (
dt.entity.host)Resolution: 15 min
Description: Number of reported metric data points split by Full-Stack monitored hosts.
- (DPS) Available included metric data points for Full-Stack monitored hosts
Key:
builtin:billing.full_stack_monitoring.metric_data_points.includedDimension: Count
Resolution: 15 min
Description: Total number of included metric data points that can be deducted from the consumed metric data points reported by Full-Stack monitored hosts.
- (DPS) Used included metric data points for Full-Stack monitored hosts
Key:
builtin:billing.full_stack_monitoring.metric_data_points.included_usedDimension: Count
Resolution: 15 min
Description: Number of consumed included metric data points for Full-Stack monitored hosts.
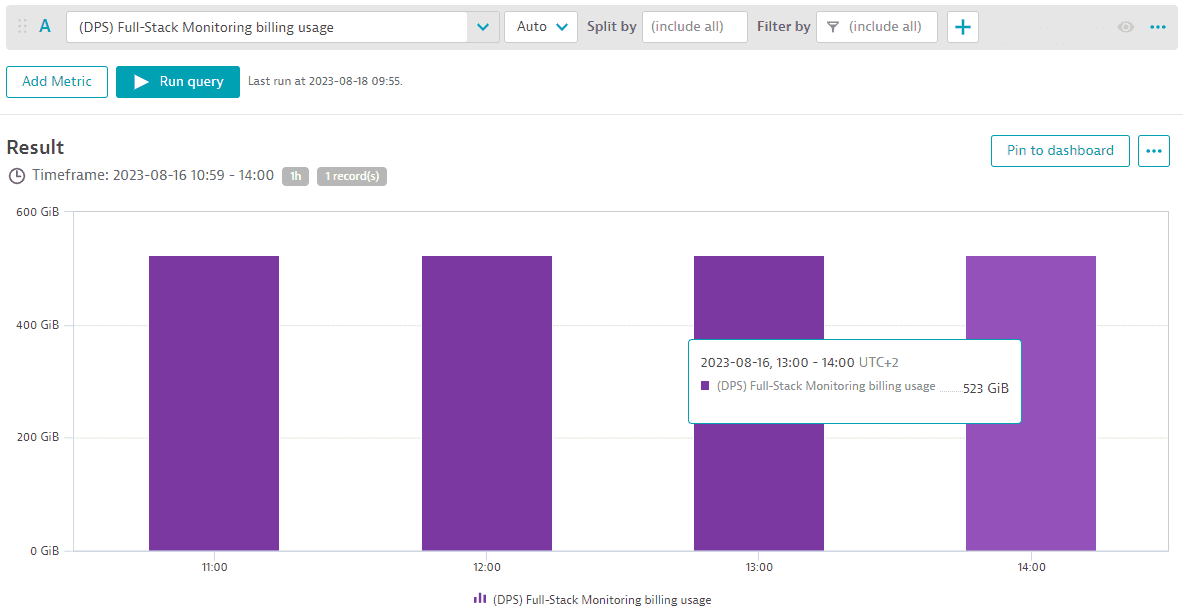
You can monitor the total memory-GiB-hour consumption aggregated across all Full-Stack monitored hosts for different intervals (15 min, hour, day, or week) for any selected timeframe using the "(DPS) Full-Stack Monitoring billing usage" metric. The example below shows memory GiB monitored in 1-hour intervals. Between 11:00 and 14:00, 523 memory-GiB were monitored each 1 hour. This results in 523 memory-GiB-hours consumed.
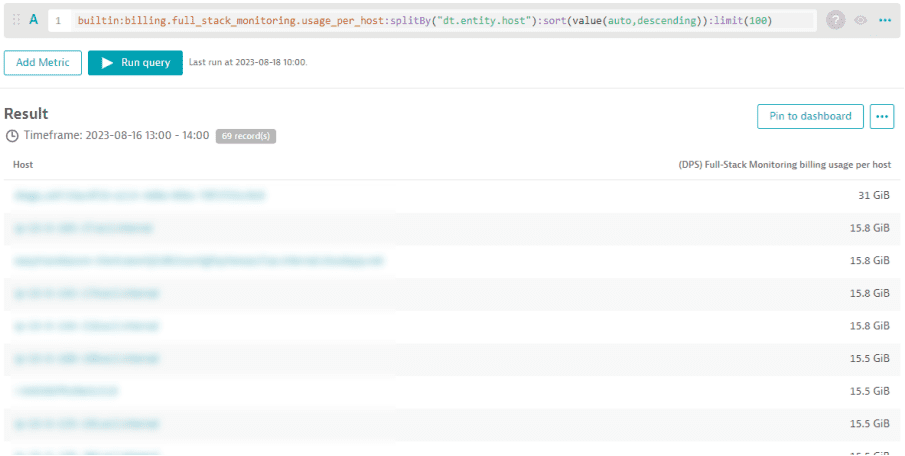
You can break down the total memory-GiB-hour consumption using the "(DPS) Full-Stack Monitoring billing usage per host" metric. The example below shows the list of all hosts that contributed to the 523 memory-GiB-hour consumption between 13:00 and 14:00. The respective number of memory-GiB-hours per host is displayed as well.
Platform and cluster owners can monitor their Kubernetes clusters using Kubernetes Platform Monitoring. Application owners can leverage container-based Full-Stack Monitoring to monitor applications running within Kubernetes clusters.
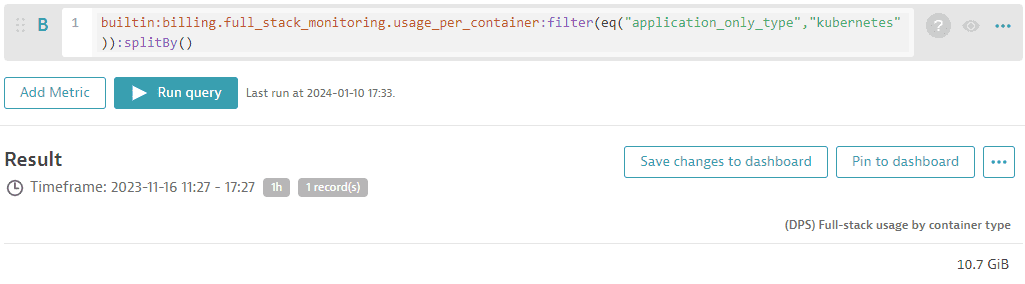
To get consumption insights for monitored Kubernetes clusters or namespaces, you can query memory-GiB-hour consumption by leveraging the "(DPS) Full-Stack Monitoring billing usage per container" metric, as shown in the following query:
builtin:billing.full_stack_monitoring.usage_per_container:filter(eq("application_only_type","kubernetes")):splitBy()
In the example below, 1.58 TiB of memory was consumed by the Kubernetes cluster within the past 30 days.
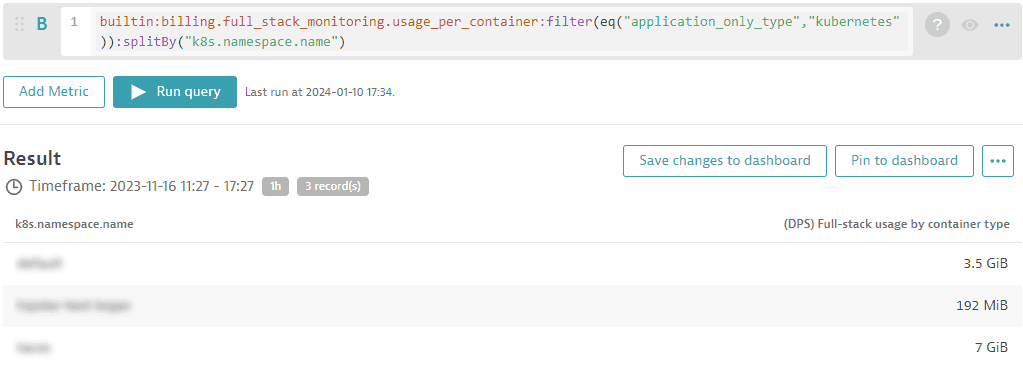
Of course, you can filter your analysis for deeper insights (for example, add a split for Kubernetes namespaces).
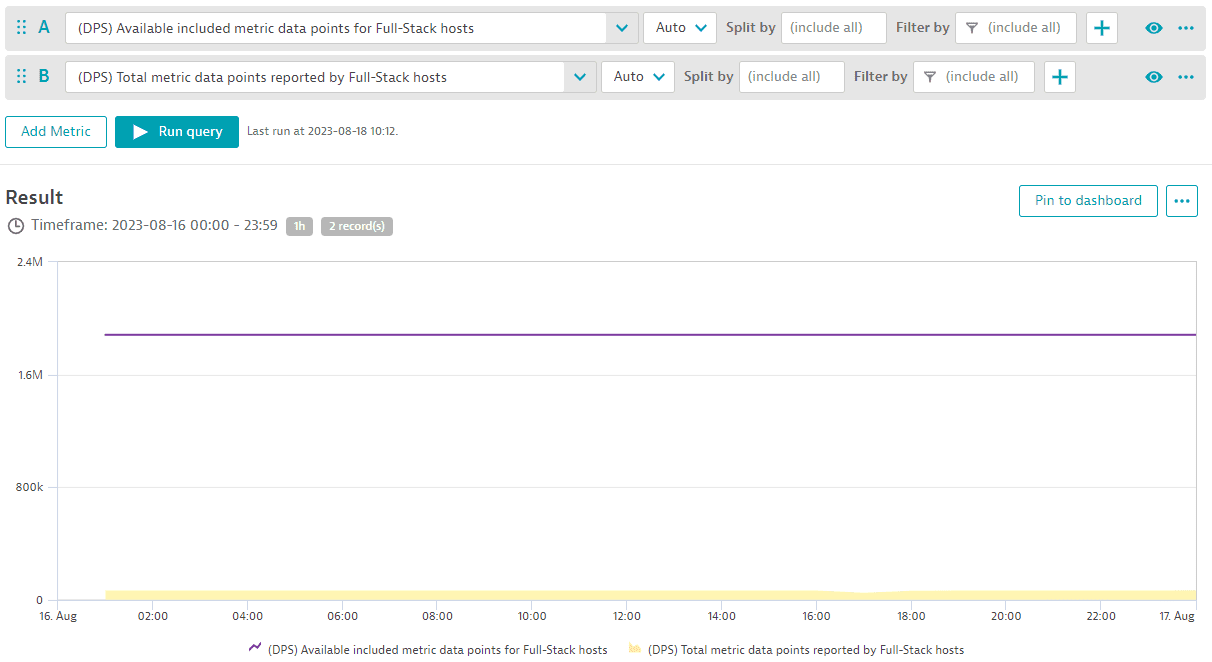
To monitor your metrics budget for the whole pool of metric data points in your environment, you can track available included metric data points against total reported metrics data points using these two metrics: "(DPS) Available included metric data points for Full-Stack monitored hosts" and "(DPS) Total metric data points reported by Full-Stack monitored hosts". The example below shows data for a full day. At no time was the number of included metrics for this environment's metric pool (purple line) overspent.
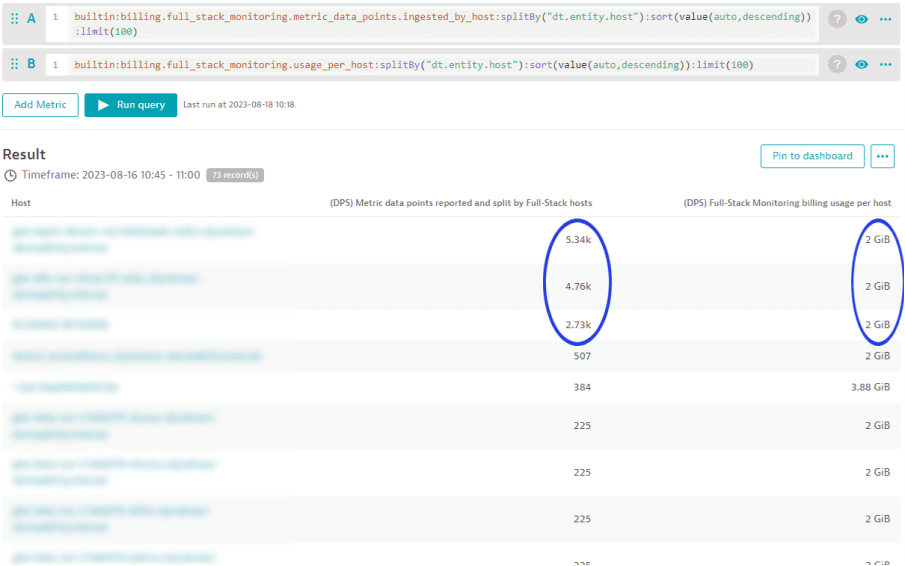
In cases where the number of included metrics for an environment's metric pool are overspent, the following analysis can help you to identify the hosts that are contributing to the overspending. Use the metric "(DPS) Metric data points reported and split by Full-Stack monitored hosts" for this analysis.
The example below shows that between 10:45 and 11:00, each of the first 3 hosts in the list reported far more than 2,000 metric data points. In the same period, each of these 3 hosts shows a memory-GiB-hour consumption of 2 GiB. Dynatrace offers 900 included custom metric data points for each GiB of host memory, calculated at 15-minute intervals. This means that the first 3 hosts contribute 1,800 (2*900) metric data points to the environment's pool of available data points. However these hosts consumed more data points than they contributed during the same time period.
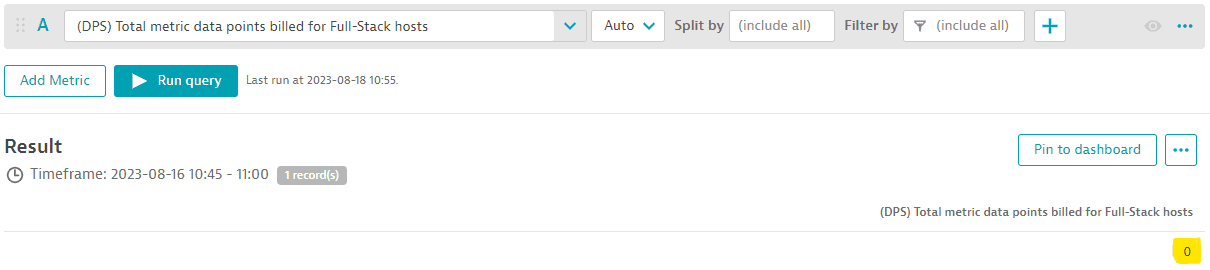
When using the metric "(DPS) Total metric data points billed for Full-Stack monitored hosts" from Custom Metrics Classic you can see that no overspending occurred for this environment's Full-Stack Monitoring metric pool between 10:45 and 11:00 because no metric data points were billed.
Track your consumption and costs in Account Management
You can also track your usage in Account Management. Go to Account Management > Subscription > Overview > Cost and usage details > Usage summary and select the Full-Stack Monitoring capability.
Track your consumption and costs via API
You can query metrics via the Environment API - Metrics API v2.