Understand and manage your consumption of Mainframe Monitoring (DPS)
- Explanation
- 1-min read
Dynatrace Mainframe Monitoring provides automatic end-to-end application performance monitoring for transactions, regions, and apps deployed on IBM z/OS. It includes distributed tracing, metrics, topology, and code-level insight for 30+ supported technologies.
With the DPS capability for Mainframe Monitoring:
- You get flexibility in licensing for incremental monitoring rollouts (for example, you can start small and expand coverage over time).
- You only pay for the active monitoring period (for example, downtimes are not charged).
- You get cost transparency and budget management in Account Management.
- The usage of
 Distributed Tracing and Services is included with Dynatrace.
No query consumption is generated by these apps.
Distributed Tracing and Services is included with Dynatrace.
No query consumption is generated by these apps.
The technical prerequisites for DPS are:
- Dynatrace Cluster version 1.279+
- zRemote module version 1.265+
- zDC subsystem version 1.247+
A monitored Logical Partition (LPAR) is represented as a host in Dynatrace. The billing for monitoring an LPAR depends on the partition’s Million Service Unit (MSU) value and the duration of Dynatrace monitoring. An MSU is an IBM measurement of the amount of processing work an IBM Z mainframe can perform in one hour.
MSU hours
The unit of measure for Mainframe Monitoring is an MSU hour. Mainframe Monitoring consumption derives MSU hours based on the IBM Tailored Fit Pricing software consumption solution, retrieved per LPAR from SMF type 70 subtype 1 records (actual number of consumed MSUs).
The more MSUs an LPAR has, and the longer Dynatrace monitors it, the higher the MSU-hour consumption.
Billing granularity for MSU-hour consumption
The billing granularity for MSU-hour consumption is calculated in four 15-minute intervals per hour. If an LPAR is monitored for less than 15 minutes in an interval, MSU-hour consumption is rounded up to 15 minutes before consumption is calculated. The sum of MSU hours of all monitored LPARs represents the total consumption.
Distributed tracing
Mainframe Monitoring includes distributed tracing.
Metrics
Mainframe Monitoring includes application performance monitoring and related built-in metrics. For example, custom JMX metrics consume metric data points.
Consumption details: Mainframe
Dynatrace provides a usage metric that helps you understand and analyze your MSU-hour consumption.
To use this metric, in  Data Explorer, enter the following metric key or name in the Search field.
Alternatively, you can query this metric via the Environment API - Metrics API v2.
- (DPS) Mainframe Monitoring billing usage
Key:
builtin:billing.mainframe_monitoring.usageDimension: Host (
dt.entity.host)Resolution: 15 min
Description: Total number of MSU hours monitored, counted in 15 min intervals.
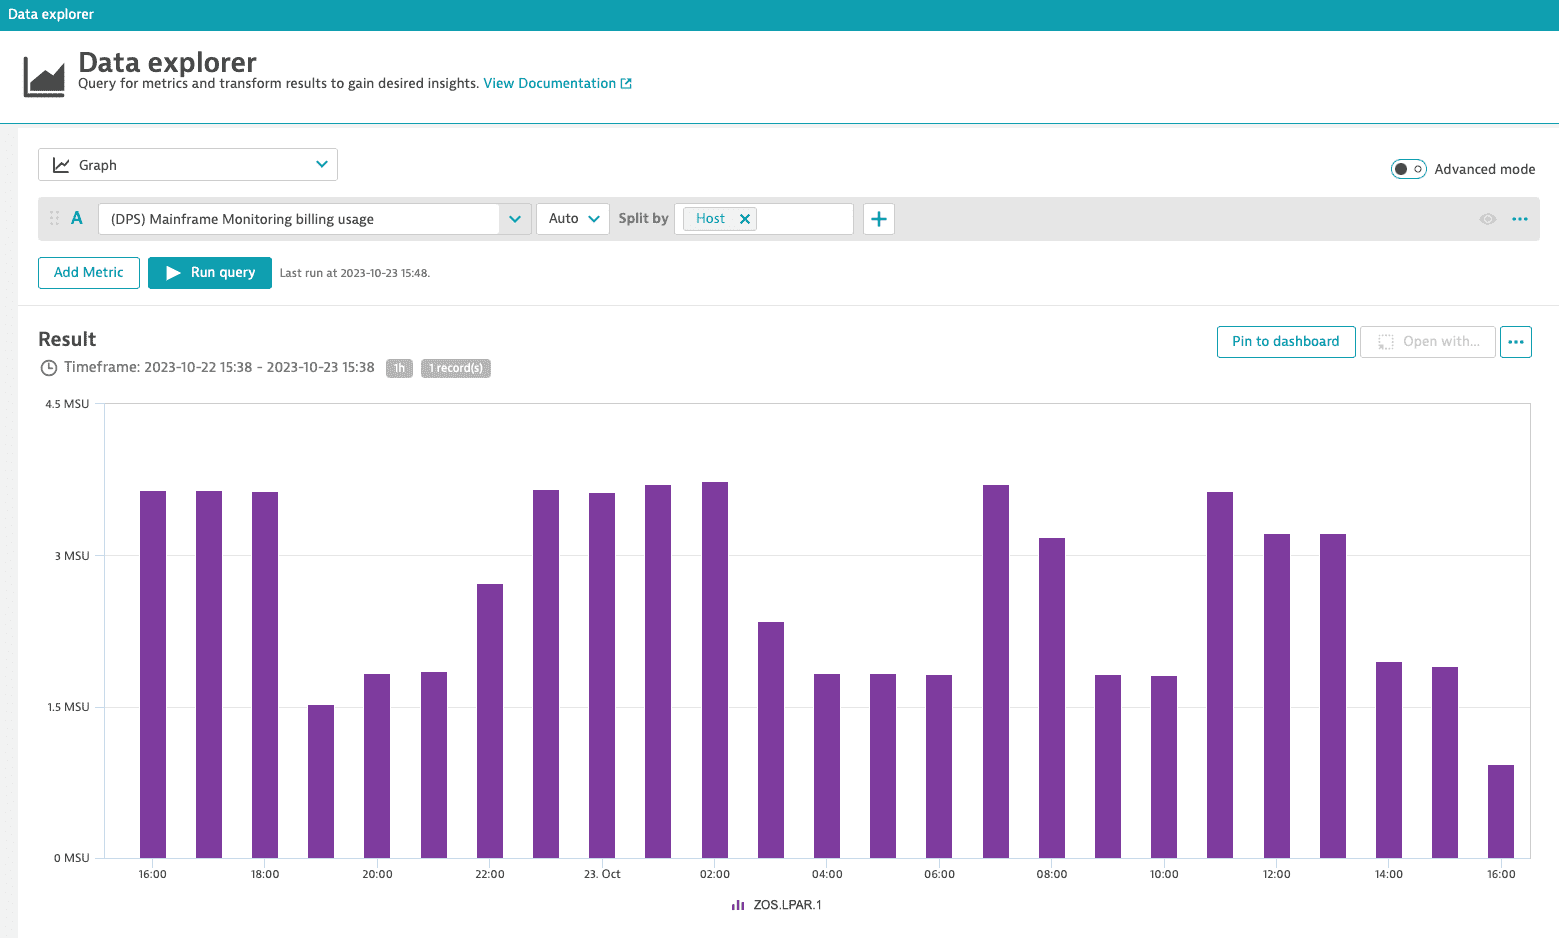
You can break down the MSU-hour consumption per LPAR. The example below shows all LPARs that contributed to the consumption in 1-hour intervals within the last 24 hours.
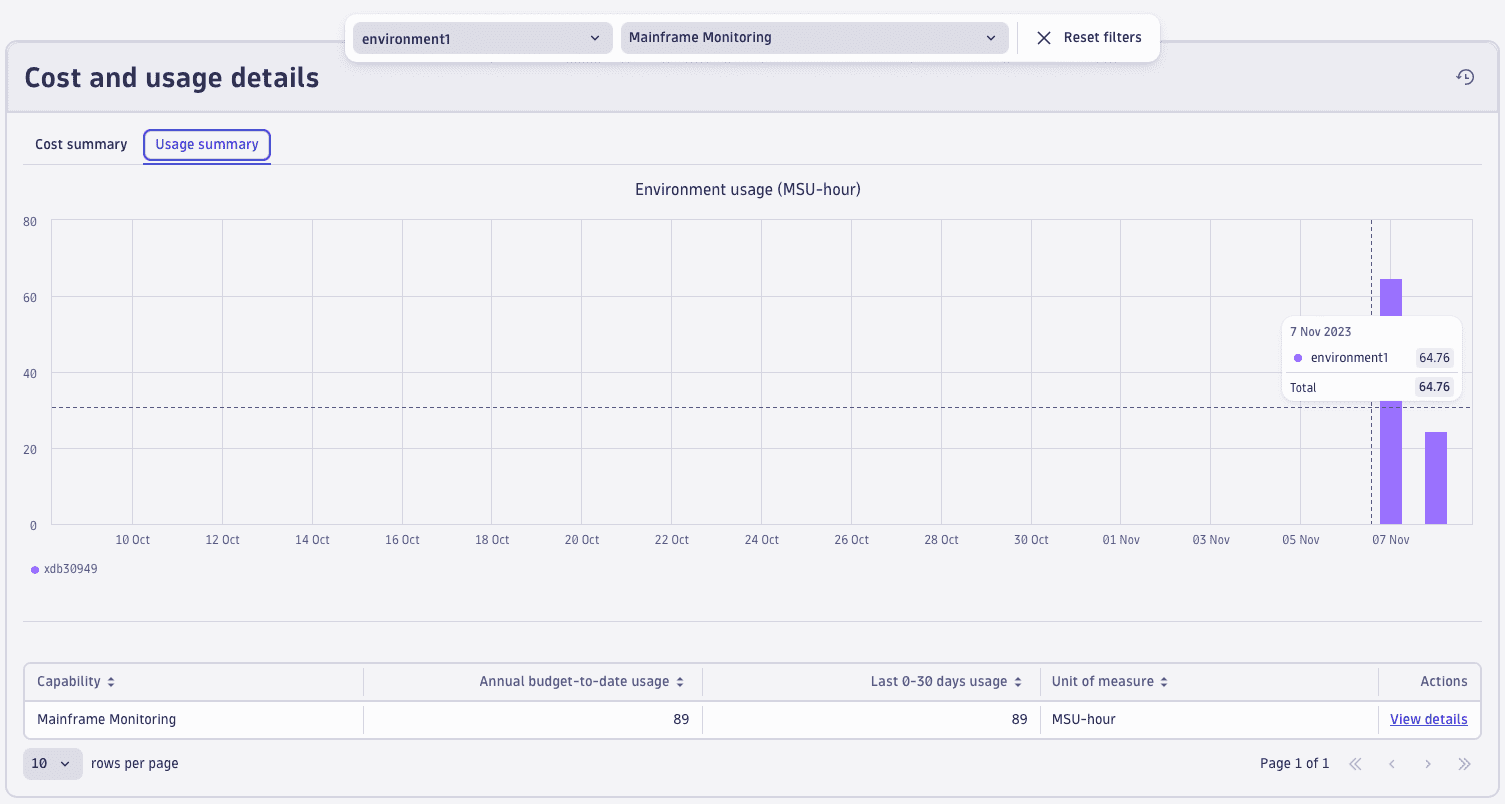
You can also view the usage metric in Account Management. Go to Account Management > Subscription > Overview > Cost and usage details > Usage summary and select the Mainframe Monitoring capability.
Consumption estimate: Mainframe
Use the IBM Sub-Capacity Reporting Tool (SCRT) report to estimate the required MSU-hour consumption per year.
- In Section C5, check the Reporting Period of the SCRT report. Typically, it contains one month of data.
- In Section N7, sum the Total MSU Consumed value for each LPAR to be monitored.
- If the reporting period is one month, multiply the Total MSU Consumed by 12 months to get annual consumption.
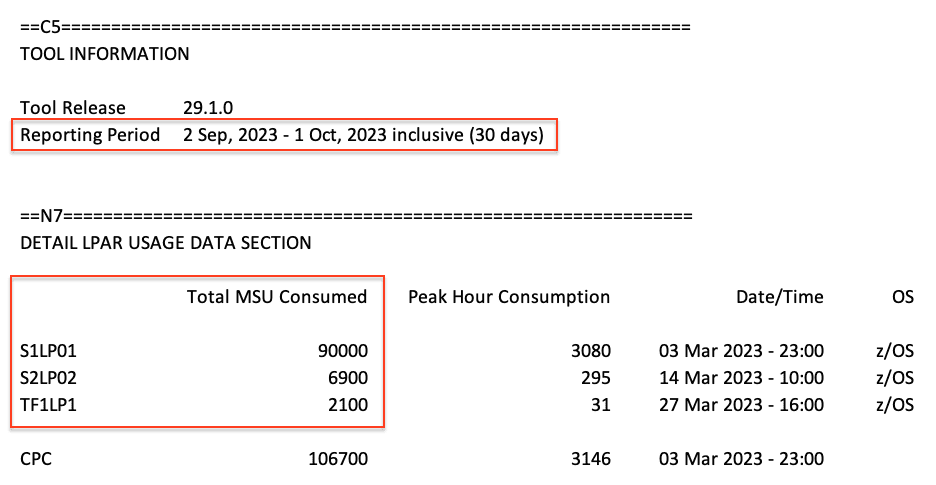
In this example, the three LPARs (S1LP01, S2LP02, and TF1LP1) consumed 99,000 MSU hours in September 2023.
Multiplied by 12 months, this equates to 1,188,000 MSU hours per year.
Notes:
- This approach might not consider seasonal workload fluctuations, which can lead to deviations in actual consumption.
- Section N7 has been available since IBM SCRT version 25.2. It was released by IBM in December 2017.
Network availability monitoring (NAM) monitors don't have a separate line on the Dynatrace rate card. Instead, you're billed based on the number of metric data points generated during each execution of a NAM test. For more information, please contact your Dynatrace account manager.
Metric data point calculations
The following details apply to metric data points:
- Metric data points related to monitor and step execution are non-billable.
- Only the consumption of metrics produced at the request level affects your billing.
- Each request execution within ping tests generates 6 metric data points.
- The number of packets used in a ping test does not impact the number of metrics produced or your billing.
- The number of packets does not affect the price.
- Each request execution within TCP/DNS tests generates 3 metric data points.
- The price stays the same regardless of whether you create several tests containing a single request, or you create one test with numerous requests for the same set of hosts or devices.