OTel Collector self-monitoring
- Explanation
- 8-min read
The OTel Collector provides extensive internal telemetry to help you monitor and troubleshoot its performance.
Key features include:
- Process uptime and CPU time since start: Monitor how long the process has been running and the CPU time consumed.
- Process memory and heap usage: Track memory consumption and heap usage to ensure optimal performance.
- Receivers: View items accepted and refused, categorized by data type.
- Processors: Monitor incoming and outgoing items to understand data flow.
- Exporters: Track items sent, failed to enqueue, and failed to send, categorized by data type. Additionally, monitor queue size and capacity.
- HTTP/gRPC requests and responses: Count, duration, and size of requests and responses to analyze communication efficiency.
Sending internal telemetry (self-monitoring data) to Dynatrace
Every Collector has self-monitoring capabilities, but they need to be activated.
Self-monitoring data can be exported from the Collector via the OTLP protocol.
-
The configuration below assumes the environment variables
DT_ENDPOINTandDT_API_TOKENare set. -
To send data to Dynatrace via OTLP, you will need to supply a Dynatrace endpoint and an ingest token with the
metrics.ingestscope set. See the OTLP Export documentation for more information. -
The
DT_ENDPOINTenvironment variable should contain the base URL and the base/api/v2/otlp.Example:
https://{your-environment-id}.live.dynatrace.com/api/v2/otlp
To send self-monitoring data to Dynatrace, use the following configuration:
service:# turn on self-monitoringtelemetry:metrics:# metrics verbosity level. Higher verbosity means more metrics.# The dashboard relies on metrics at level detailed.level: detailed# set up OTLP exporterreaders:- periodic:interval: 60000exporter:otlp:protocol: http/protobuftemporality_preference: deltaendpoint: "${env:DT_ENDPOINT}/v1/metrics"headers:- name: Authorizationvalue: "Api-Token ${env:DT_API_TOKEN}"
Note that the Collector can automatically merge configuration files for you. Assuming the above configuration is stored in a file called selfmon-config.yaml, you can start the Collector like this:
./dynatrace-otel-collector --config=your-already-existing-config.yaml --config=selfmon-config.yaml
Of course, you can also add the configuration directly to your existing Collector configuration.
Dynatrace accepts metrics data with delta temporality via OTLP/HTTP.
- Collector and Collector Contrib versions 0.107.0 and above, as well as the Dynatrace OTel Collector versions 0.12.0 and above, support exporting metrics data in that format.
- Earlier versions ignore the
temporality_preferenceflag and would, therefore, require additional processing (cumulative to delta conversion) before ingestion. It is possible to do this conversion with a Collector instance, but it would make the setup more complicated, so it is initially omitted in this document.
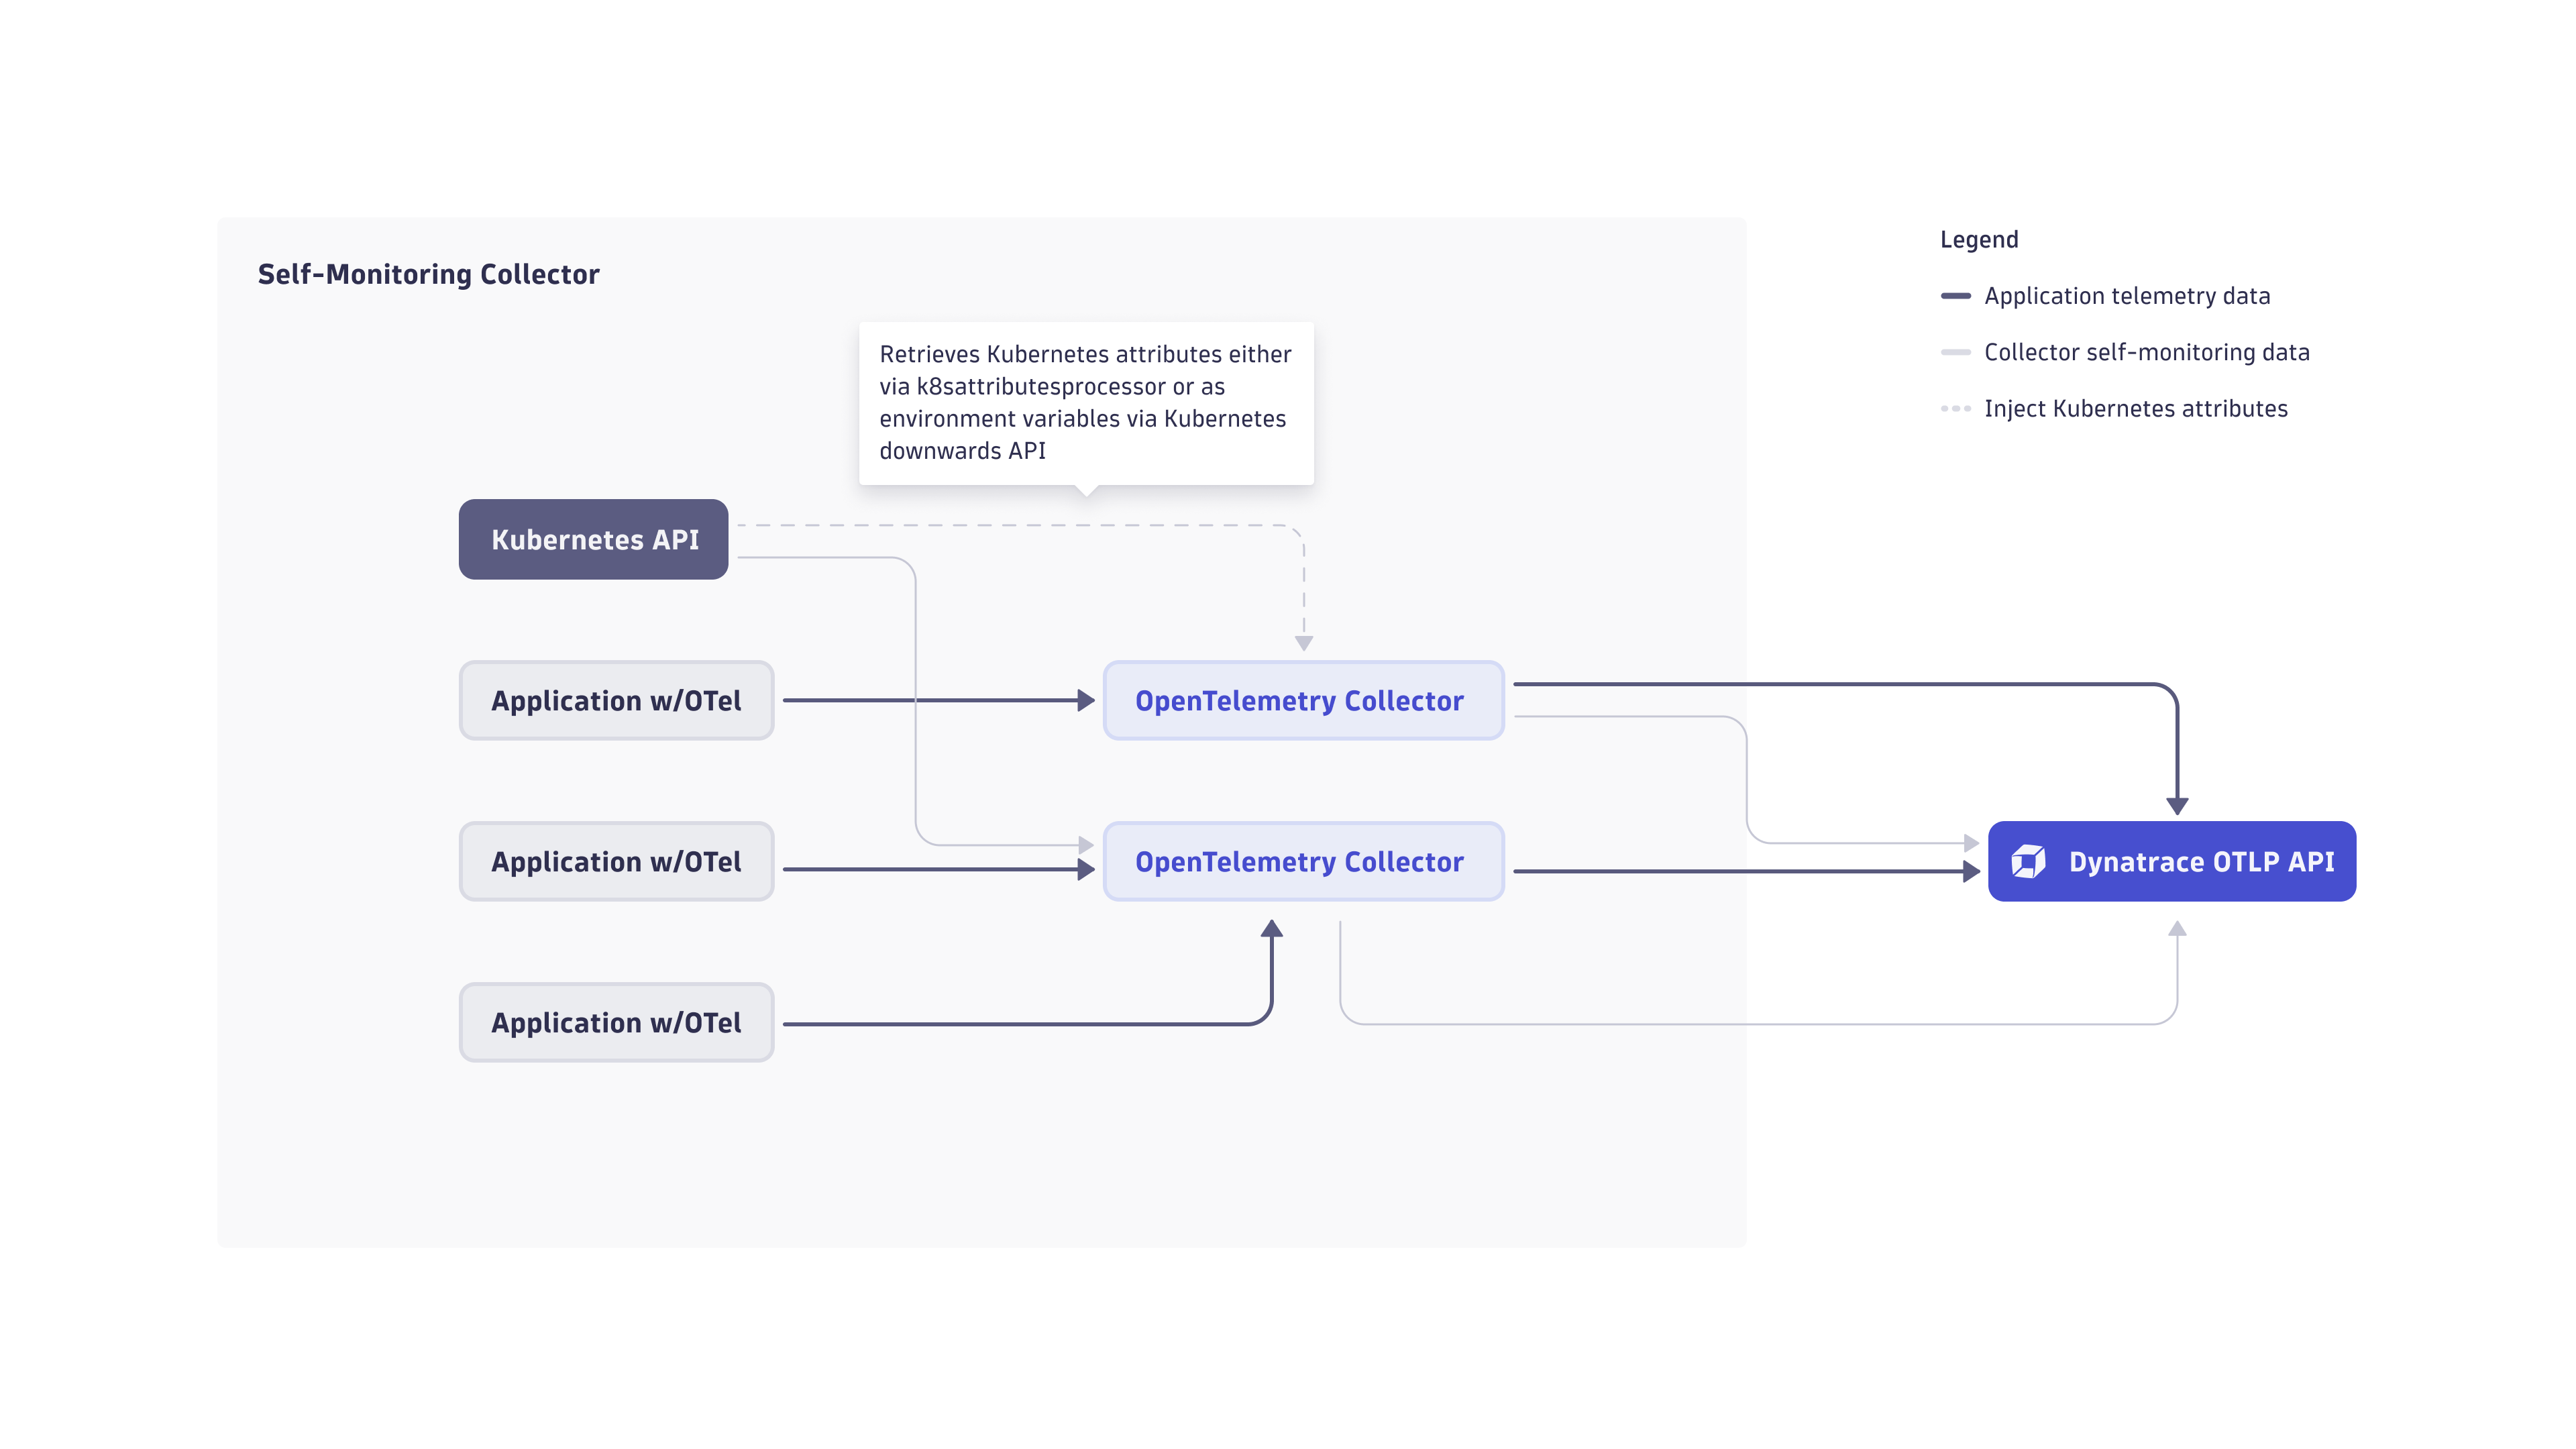
Enriching Collector self-monitoring data with Kubernetes attributes
Out of the box, the Collector adds service.instance.id to all exported metrics. This makes it possible to distinguish between Collector instances.
However, service.instance.id is an arbitrarily created UUID, and is therefore not very easy to interpret. It is possible to enrich the exported data with more attributes, for examples Kubernetes attributes, that are more easily interpreted by humans.
There are two main ways of adding Kubernetes attributes to Collector telemetry data:
- Injecting the relevant attributes into the container environment, reading them in the Collector, and adding them to the telemetry data generated on the Collector.
- Sending the Collector self-monitoring data to its own
otlpreceiver, and enriching it using thek8sattributesprocessorprocessor before sending it to Dynatrace via theotlp_httpexporter.
Read attributes from the container environment
The Kubernetes downwards API allows injecting information about the Kubernetes environment that a certain pod is running in.
Pod and container information can be exposed to the Collector via environment variables. The Kubernetes documentation explains how to specify data like the node name, namespace, or pod name as environment variables. These variables are then available to be read from inside the container.
In the following example pod spec, values in <> are placeholders for your actual pod specification data.
apiVersion: v1kind: Podmetadata:name: <your-pod-name>spec:containers:- name: <your-container>image: <your-image>env:- name: MY_NODE_NAMEvalueFrom:fieldRef:fieldPath: spec.nodeName- name: MY_POD_NAMEvalueFrom:fieldRef:fieldPath: metadata.name- name: MY_POD_NAMESPACEvalueFrom:fieldRef:fieldPath: metadata.namespace
The Collector configuration for self-monitoring data allows adding attributes based on environment variables.
The configuration below assumes that you injected the environment variables MY_NODE_NAME, MY_POD_NAME, and MY_POD_NAMESPACE into your Collector container, and adds the attributes on the exported telemetry data. No extra Collector instance is required to enrich in-flight telemetry.
service:telemetry:resource:# This section reads the previously injected environment variables# and attaches them to the telemetry the Collector generates about itself.k8s.namespace.name: "${env:MY_POD_NAMESPACE}"k8s.pod.name: "${env:MY_POD_NAME}"k8s.node.name: "${env:MY_NODE_NAME}"# the rest of the configuration did not change compared to above.metrics:level: detailedreaders:- periodic:exporter:otlp:endpoint: <...>
Enrich data using the k8sattributes processor
In this approach, Collector instances are configured to send their internal telemetry data to themselves via an otlp receiver, in order to enrich the incoming telemetry with Kubernetes attributes using the k8sattributesprocessor processor. It retrieves this data from the Kuberenetes API and attaches it to the telemetry data passing through it.
For this option, you need to set up a pipeline for enriching the self-monitoring data with the k8sattributesprocessor processor in the Collector configuration:
receivers:otlp:protocols:grpc:endpoint: ${env:MY_POD_IP}:4317http:cors:allowed_origins:- http://*- https://*endpoint: ${env:MY_POD_IP}:4318processors:k8sattributes:extract:metadata:- k8s.pod.name- k8s.pod.uid- k8s.pod.ip- k8s.deployment.name- k8s.replicaset.name- k8s.statefulset.name- k8s.daemonset.name- k8s.job.name- k8s.cronjob.name- k8s.namespace.name- k8s.node.name- k8s.cluster.uid- k8s.container.nameannotations:- from: podkey_regex: metadata.dynatrace.com/(.*)tag_name: $$1pod_association:- sources:- from: resource_attributename: k8s.pod.name- from: resource_attributename: k8s.namespace.name- sources:- from: resource_attributename: k8s.pod.ip- sources:- from: resource_attributename: k8s.pod.uid- sources:- from: connectionmemory_limiter:check_interval: 5slimit_percentage: 80spike_limit_percentage: 25transform:error_mode: ignoremetric_statements:- context: resourcestatements:- set(attributes["k8s.workload.kind"], "job") where IsString(attributes["k8s.job.name"])- set(attributes["k8s.workload.name"], attributes["k8s.job.name"]) where IsString(attributes["k8s.job.name"])- set(attributes["k8s.workload.kind"], "cronjob") where IsString(attributes["k8s.cronjob.name"])- set(attributes["k8s.workload.name"], attributes["k8s.cronjob.name"]) where IsString(attributes["k8s.cronjob.name"])- set(attributes["k8s.workload.kind"], "daemonset") where IsString(attributes["k8s.daemonset.name"])- set(attributes["k8s.workload.name"], attributes["k8s.daemonset.name"]) where IsString(attributes["k8s.daemonset.name"])- set(attributes["k8s.workload.kind"], "statefulset") where IsString(attributes["k8s.statefulset.name"])- set(attributes["k8s.workload.name"], attributes["k8s.statefulset.name"]) where IsString(attributes["k8s.statefulset.name"])- set(attributes["k8s.workload.kind"], "replicaset") where IsString(attributes["k8s.replicaset.name"])- set(attributes["k8s.workload.name"], attributes["k8s.replicaset.name"]) where IsString(attributes["k8s.replicaset.name"])- set(attributes["k8s.workload.kind"], "deployment") where IsString(attributes["k8s.deployment.name"])- set(attributes["k8s.workload.name"], attributes["k8s.deployment.name"]) where IsString(attributes["k8s.deployment.name"])# remove the delete statements if you want to preserve these attributes- delete_key(attributes, "k8s.deployment.name")- delete_key(attributes, "k8s.replicaset.name")- delete_key(attributes, "k8s.statefulset.name")- delete_key(attributes, "k8s.daemonset.name")- delete_key(attributes, "k8s.cronjob.name")- delete_key(attributes, "k8s.job.name")exporters:otlp_http/dynatrace:endpoint: ${env:DT_ENDPOINT}headers:Authorization: "Api-Token ${env:DT_API_TOKEN}"sending_queue:batch:# Recommended metrics defaultsmin_size: 3000max_size: 3000flush_timeout: 60sservice:pipelines:metrics:receivers:- otlpprocessors:- k8sattributes- transform- memory_limiter- batchexporters:- otlp_http/dynatrace# turn on self-monitoringtelemetry:metrics:# metrics verbosity level. Higher verbosity means more metrics.# The dashboard relies on metrics at level detailed.level: detailedreaders:- periodic:interval: 10000timeout: 5000exporter:otlp:protocol: http/protobuftemporality_preference: deltaendpoint: ${env:MY_POD_IP}:4318