Monitor Azure Virtual Machines (classic)
- How-to guide
- 2-min read
- Published Jun 25, 2020
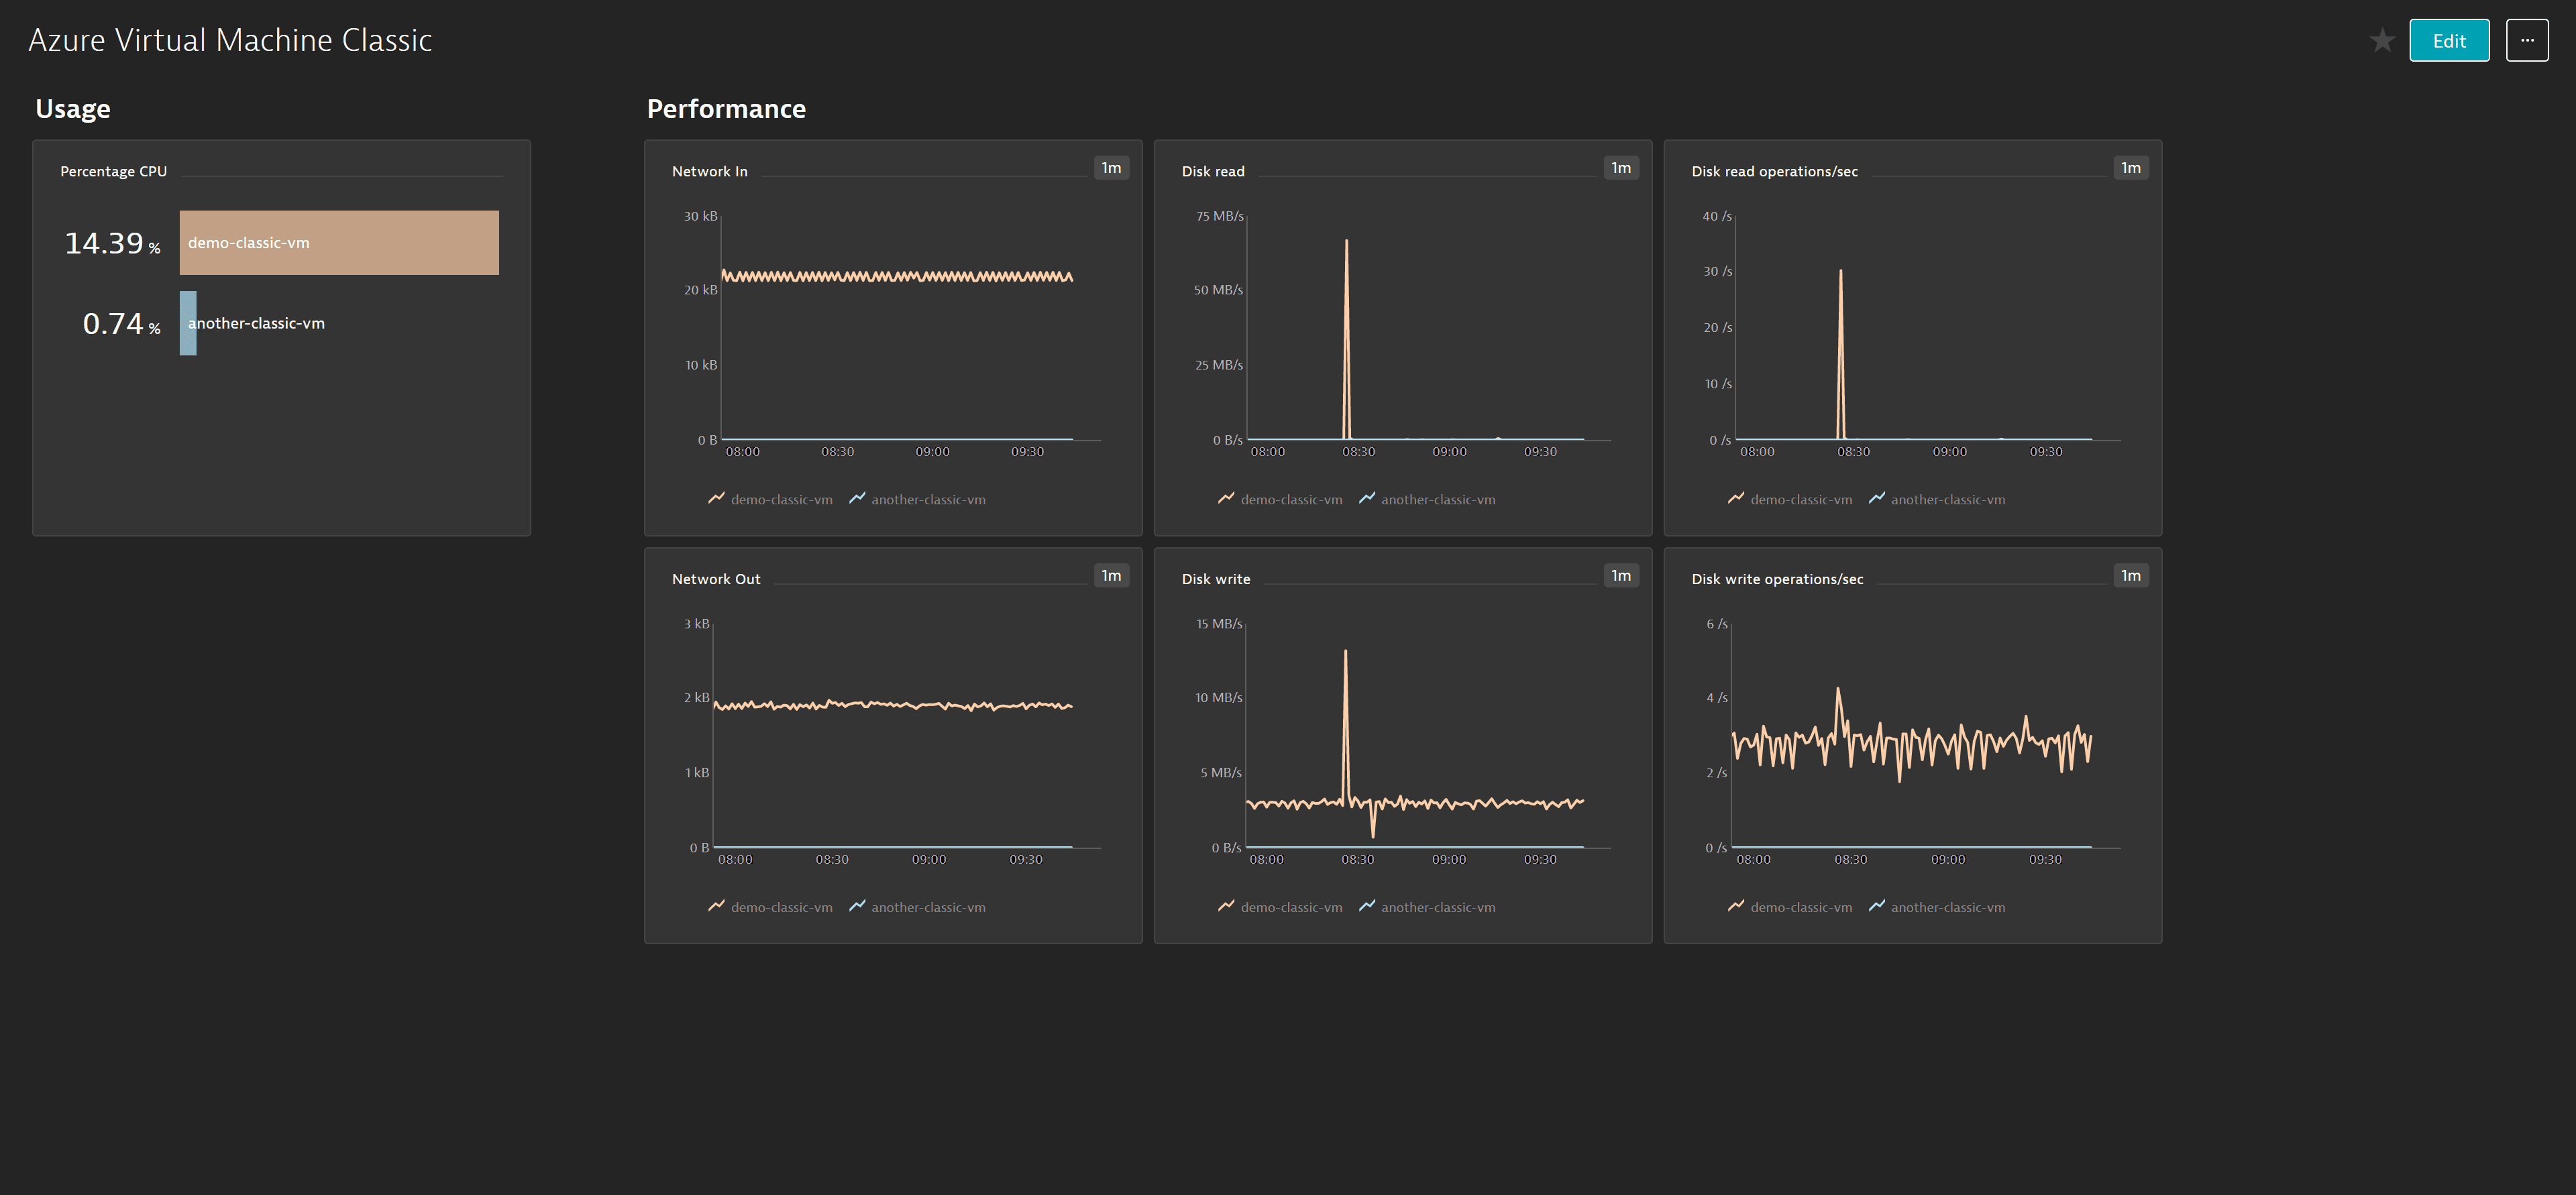
On the Azure Virtual Machine (classic) overview page you get insights into various aspects of performance, including CPU usage, disk throughput, IOPS, and more.
Prerequisites
- Dynatrace version 1.196+
- Environment ActiveGate version 1.195+
This service monitors Azure Virtual Machine (classic) (Microsoft.ClassicCompute/virtualMachines).
You can find the already monitored resources on the Azure overview page in the Cloud services section or use a dashboard preset.
To monitor resources of the Microsoft.Compute/virtualMachines and Microsoft.Compute/virtualMachineScaleSets types, check Azure Virtual machines and the VMs, and Scale sets sections on the Azure overview page.
Enable monitoring
To learn how to enable service monitoring, see Enable service monitoring.
View service metrics
You can view the service metrics in your Dynatrace environment either on the custom device overview page or on your Dashboards page.
View metrics on the custom device overview page
To access the custom device overview page
- Go to Technologies & Processes.
- Filter by service name and select the relevant custom device group.
- Once you select the custom device group, you're on the custom device group overview page.
- The custom device group overview page lists all instances (custom devices) belonging to the group. Select an instance to view the custom device overview page.
View metrics on your dashboard
If the service has a preset dashboard, you'll get a preset dashboard for the respective service containing all recommended metrics on your Dashboards page. You can look for specific dashboards by filtering by Preset and then by Name.
For existing monitored services, you might need to resave your credentials for the preset dashboard to appear on the Dashboards page. To resave your credentials, go to Settings > Cloud and virtualization > Azure, select the desired Azure instance, then select Save.
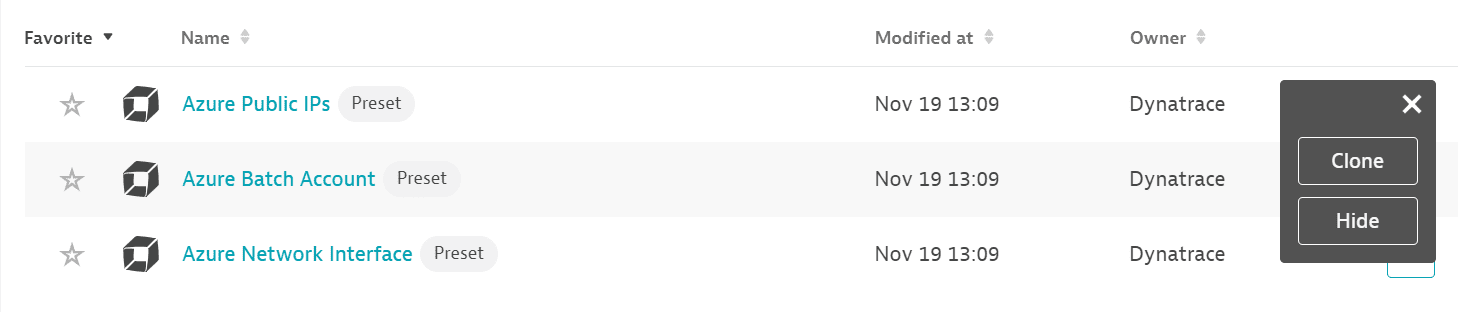
You can't make changes on a preset dashboard directly, but you can clone and edit it. To clone a dashboard, open the browse menu (…) and select Clone.
To remove a dashboard from the dashboards list, you can hide it. To hide a dashboard, open the browse menu (…) and select Hide.
Hiding a dashboard doesn't affect other users.
Available metrics
| Name | Description | Dimensions | Unit | Recommended |
|---|---|---|---|---|
Disk Read | Average bytes read from disk during monitoring period. | None | BytesPerSecond |
|
Disk Read Operations/Sec | Disk Read IOPS. | None | CountPerSecond |
|
Disk Write | Average bytes written to disk during monitoring period. | None | BytesPerSecond |
|
Disk Write Operations/Sec | Disk Write IOPS. | None | CountPerSecond |
|
Network In | The number of bytes received on all network interfaces by the Virtual Machine(s) (Incoming Traffic). | None | Bytes |
|
Network Out | The number of bytes out on all network interfaces by the Virtual Machine(s) (Outgoing Traffic). | None | Bytes |
|
Percentage CPU | The percentage of allocated compute units that are currently in use by the Virtual Machine(s). | None | Percent |
|