Azure Synapse Analytics (Synapse Workspace, Apache Spark pool, SQL pool) monitoring
- How-to guide
- 4-min read
- Published Sep 23, 2020
Dynatrace ingests metrics from Azure Metrics API for Azure Analytics (Synapse Workspace, Apache Spark pool, SQL pool). You can view metrics for each service instance, split metrics into multiple dimensions, and create custom charts that you can pin to your dashboards.
Prerequisites
- Dynatrace version 1.203+
- Environment ActiveGate version 1.195+
Enable monitoring
To learn how to enable service monitoring, see Enable service monitoring.
View service metrics
You can view the service metrics in your Dynatrace environment either on the custom device overview page or on your Dashboards page.
View metrics on the custom device overview page
To access the custom device overview page
- Go to Technologies & Processes.
- Filter by service name and select the relevant custom device group.
- Once you select the custom device group, you're on the custom device group overview page.
- The custom device group overview page lists all instances (custom devices) belonging to the group. Select an instance to view the custom device overview page.
View metrics on your dashboard
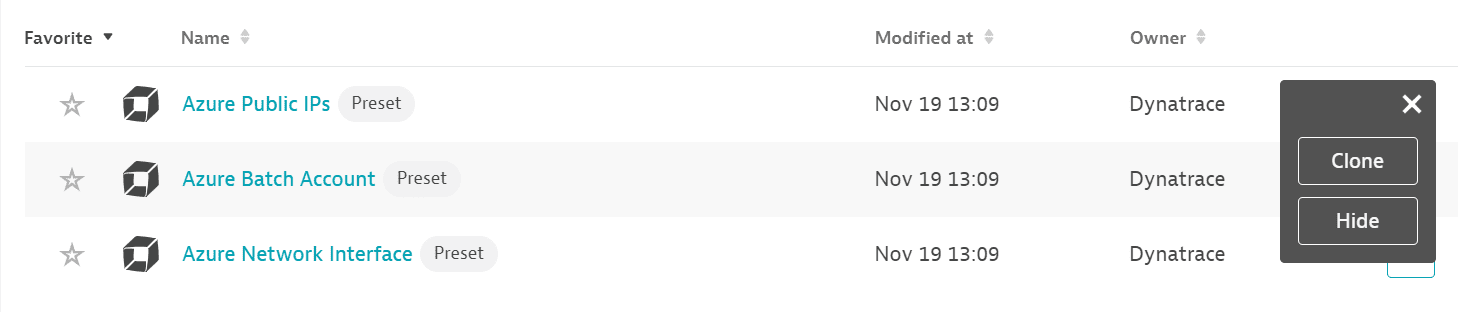
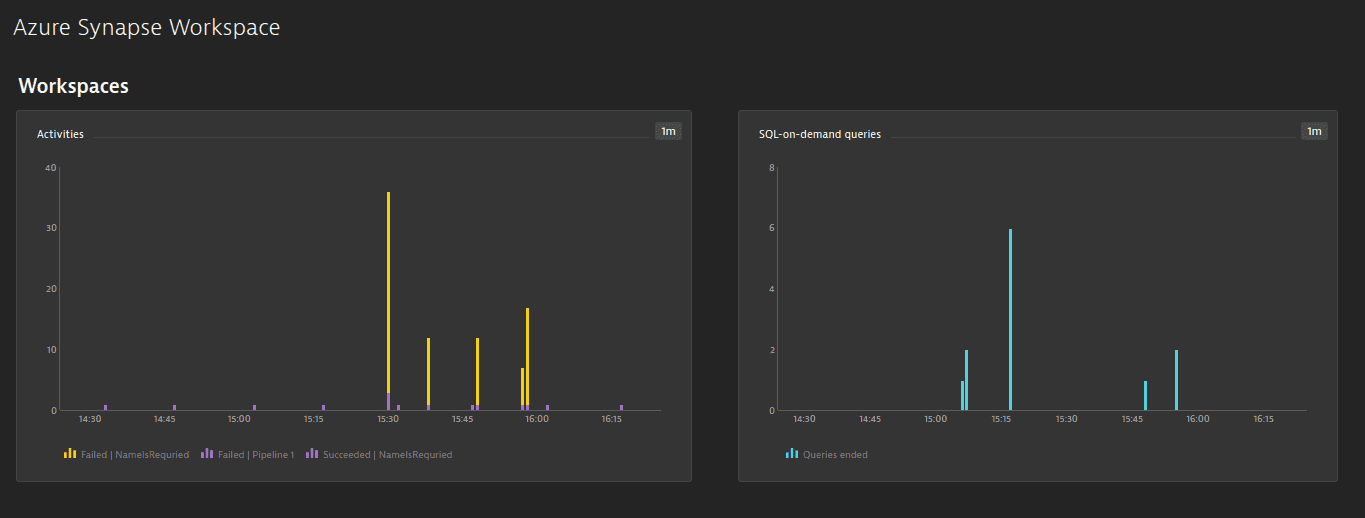
If the service has a preset dashboard, you'll get a preset dashboard for the respective service containing all recommended metrics on your Dashboards page. You can look for specific dashboards by filtering by Preset and then by Name.
For existing monitored services, you might need to resave your credentials for the preset dashboard to appear on the Dashboards page. To resave your credentials, go to Settings > Cloud and virtualization > Azure, select the desired Azure instance, then select Save.
You can't make changes on a preset dashboard directly, but you can clone and edit it. To clone a dashboard, open the browse menu (…) and select Clone.
To remove a dashboard from the dashboards list, you can hide it. To hide a dashboard, open the browse menu (…) and select Hide.
Hiding a dashboard doesn't affect other users.
Available metrics
Synapse Workspace
| Name | Description | Dimensions | Unit | Recommended |
|---|---|---|---|---|
IntegrationActivityRunsEnded | The number of orchestration activities that succeeded, failed, or were cancelled | Result, Failure type, Activity, Activity type, Pipeline | Count |
|
IntegrationPipelineRunsEnded | The number of orchestration pipeline runs that succeeded, failed, or were cancelled | Result, Failure type, Pipeline | Count |
|
IntegrationTriggerRunsEnded | The number of orchestration triggers that succeeded, failed, or were cancelled | Result, Failure type, Trigger | Count |
|
BuiltinSqlPoolLoginAttempts | The number of login attempts that succeeded or failed | Result, Failure type | Count | |
BuiltinSqlPoolRequestsEnded | The number of queries that succeeded, failed, or were cancelled | Result, Failure type | Count |
|
BuiltinSqlPoolDataProcessedBytes | The amount of data processed by queries | Byte |
|

Apache Spark pool
| Name | Description | Dimensions | Unit | Recommended |
|---|---|---|---|---|
BigDataPoolApplicationsActive | Active Apache Spark applications | Job state | Count |
|
BigDataPoolApplicationsEnded | Ended Apache Spark applications | Job result, Job type | Count |
|
BigDataPoolAllocatedMemory | Memory allocated (in GB) | Submitter ID | Count |
|
BigDataPoolAllocatedCores | V cores allocated | Submitter ID | Count |
|
SQL pool
| Name | Description | Unit | Dimensions | Recommended |
|---|---|---|---|---|
AdaptiveCacheHitPercent | Measures how well workloads are utilizing the adaptive cache. Use this metric with the cache hit percentage metric to determine whether to scale for additional capacity or rerun workloads to hydrate the cache. | Percent |
| |
AdaptiveCacheUsedPercent | Measures how well workloads are utilizing the adaptive cache. Use this metric with the cache used percentage metric to determine whether to scale for additional capacity or rerun workloads to hydrate the cache. | Percent |
| |
Connections | The number of total logins to the SQL pool | Count | Result |
|
ConnectionsBlockedByFirewall | The number of connections blocked by firewall rules | Count | ||
DWULimit | The service-level objective of the SQL pool | Count |
| |
DWUUsed | The usage across the SQL pool, measured by DWU limit * DWU percentage. | Count |
| |
DWUUsedPercent | The usage across the SQL pool, measured by taking the maximum between CPU percentage and Data IO percentage | Percent |
| |
LocalTempDBUsedPercent | The local tempdb utilization across all compute nodes. Values are emitted every five minutes. | Percent |
| |
MemoryUsedPercent | The memory utilization across all nodes in the SQL pool | Percent |
| |
WLGActiveQueries | The active queries within the workload group | Count | Is user defined, Workload group |
|
WLGActiveQueriesTimeouts | The queries for the workload group that have timed out | Count | Is user defined, Workload group |
|
WLGAllocationByMaxResourcePercent | The percentage allocation of resources relative to the effective cap resource percent per workload group | Percent | Is user defined, Workload group | |
WLGAllocationBySystemPercent | The percentage allocation of resources relative to the entire system | Percent | Is user defined, Workload group | |
WLGEffectiveCapResourcePercent | The effective cap resource percent for the workload group | Percent | Is user defined, Workload group | |
WLGQueuedQueries | The cumulative number of requests queued after the max concurrency limit was reached | Count | Is user defined, Workload group | |
wlg_effective_min_resource_percent | The effective minimum resource percentage setting allowed, considering the service level and the workload group settings | Percent | Is user defined, Workload group |