Azure SQL elastic pool (vCore) monitoring
- How-to guide
- 3-min read
For information about differences between classic services and other services, see Migrate from Azure classic (formerly 'built-in') services to cloud services.
Dynatrace ingests metrics from Azure Metrics API for Azure SQL elastic pool (vCore). You can view metrics for each service instance, split metrics into multiple dimensions, and create custom charts that you can pin to your dashboards.
Prerequisites
- Dynatrace version 1.199+
- Environment ActiveGate version 1.195+
Enable monitoring
To learn how to enable service monitoring, see Enable service monitoring.
View service metrics
You can view the service metrics in your Dynatrace environment either on the custom device overview page or on your Dashboards page.
View metrics on the custom device overview page
To access the custom device overview page
- Go to Technologies & Processes.
- Filter by service name and select the relevant custom device group.
- Once you select the custom device group, you're on the custom device group overview page.
- The custom device group overview page lists all instances (custom devices) belonging to the group. Select an instance to view the custom device overview page.
View metrics on your dashboard
If the service has a preset dashboard, you'll get a preset dashboard for the respective service containing all recommended metrics on your Dashboards page. You can look for specific dashboards by filtering by Preset and then by Name.
For existing monitored services, you might need to resave your credentials for the preset dashboard to appear on the Dashboards page. To resave your credentials, go to Settings > Cloud and virtualization > Azure, select the desired Azure instance, then select Save.
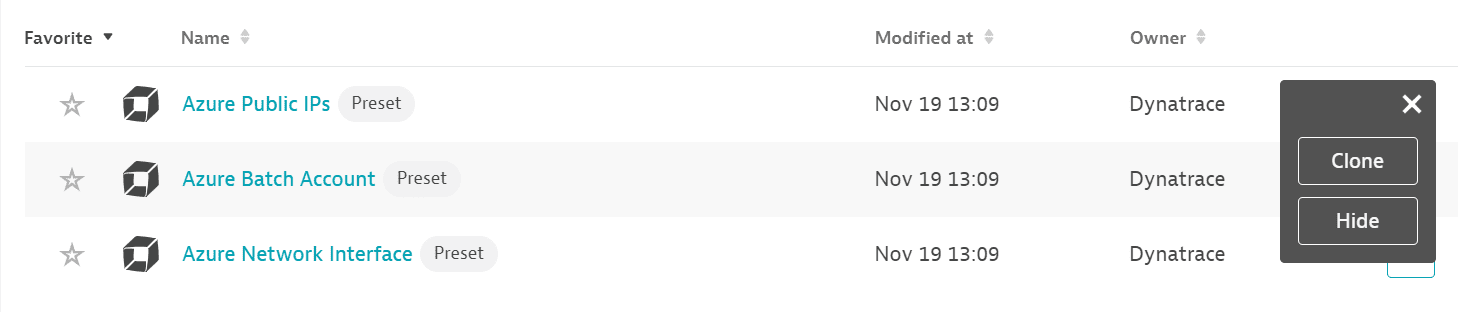
You can't make changes on a preset dashboard directly, but you can clone and edit it. To clone a dashboard, open the browse menu (…) and select Clone.
To remove a dashboard from the dashboards list, you can hide it. To hide a dashboard, open the browse menu (…) and select Hide.
Hiding a dashboard doesn't affect other users.
Available metrics
This service monitors a part of Azure SQL (Microsoft.Sql/servers/elasticpools). While you have this service configured, you can't have Azure Sql Servers (built-in) service turned on.
| Name | Description | Dimensions | Unit | Recommended |
|---|---|---|---|---|
CPU percentage | CPU percentage | Database arm resource ID | Percent |
|
Data IO percentage | Data IO percentage | Database arm resource ID | Percent |
|
Log IO percentage | Log IO percentage | Database arm resource ID | Percent |
|
Data space used percent | Data space used percent. Not applicable to hyperscale | Percent | ||
Workers percentage | Workers percentage | Database arm resource ID | Percent | |
Sessions percentage | Sessions percentage | Database arm resource ID | Percent |
|
Sessions count | Number of active sessions | Count |
| |
Data max size | Data max size. Not applicable to hyperscale | Byte | ||
Data space used | Data space used. Not applicable to hyperscale | Database arm resource ID | Byte | |
In - memory OLTP storage percent | In-Memory OLTP storage percent. Not applicable to hyperscale | Percent | ||
CPU limit | CPU limit. Applies to vCore-based elastic pools. | Database arm resource ID | Count |
|
CPU used | CPU used. Applies to vCore-based elastic pools. | Database arm resource ID | Count |
|
SQL server process core percent | CPU usage as a percentage of the SQL DB process. Applies to elastic pools. (This metric is equivalent to sql_instance_cpu_percent, and will be removed in the future.) | Percent | ||
SQL server process memory percent | Memory usage as a percentage of the SQL DB process. Applies to elastic pools. (This metric is equivalent to sql_instance_memory_percent, and will be removed in the future.) | Percent | ||
Tempdb data file size kB | Space used in tempdb data files in kilobytes. | Count | ||
Tempdb log file size kB | Space used in tempdb transaction log file in kilobytes. | Count | ||
Tempdb percent log used | Space used percentage in tempdb transaction log file | Percent | ||
Data space allocated | Data space allocated. Not applicable to hyperscale | Database arm resource ID | Byte | |
Data space allocated percent | Data space allocated percent. Not applicable to hyperscale | Percent |