Azure SQL Data Warehouse (legacy)
- How-to guide
- 4-min read
- Published Aug 12, 2021
The Azure SQL Data Warehouse overview page gives you a comprehensive view of how many jobs and tasks were completed over a period of time. You can also track nodes in different states, such as running, idle, or offline.
Prerequisites
- Dynatrace version 1.224+
- Environment ActiveGate version 1.205+
This service monitors the data warehouse type of SQL Databases. You can find the already monitored resources on the Azure overview page in the Cloud services section.
To monitor the SQL Databases user kind, check Azure SQL Servers and the Databases components sections on the Azure overview page.
Enable monitoring
To learn how to enable service monitoring, see Enable service monitoring.
View service metrics
You can view the service metrics in your Dynatrace environment either on the custom device overview page or on your Dashboards page.
View metrics on the custom device overview page
To access the custom device overview page
- Go to Technologies & Processes.
- Filter by service name and select the relevant custom device group.
- Once you select the custom device group, you're on the custom device group overview page.
- The custom device group overview page lists all instances (custom devices) belonging to the group. Select an instance to view the custom device overview page.
View metrics on your dashboard
If the service has a preset dashboard, you'll get a preset dashboard for the respective service containing all recommended metrics on your Dashboards page. You can look for specific dashboards by filtering by Preset and then by Name.
For existing monitored services, you might need to resave your credentials for the preset dashboard to appear on the Dashboards page. To resave your credentials, go to Settings > Cloud and virtualization > Azure, select the desired Azure instance, then select Save.
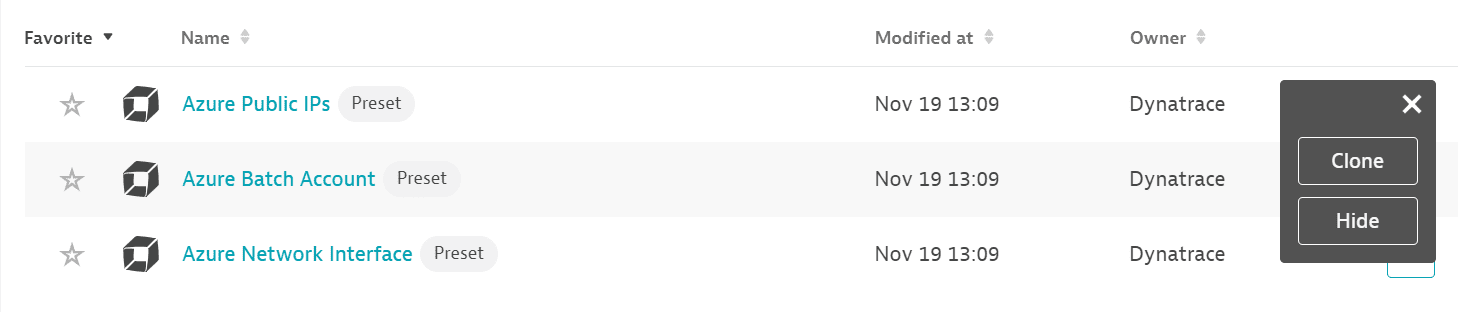
You can't make changes on a preset dashboard directly, but you can clone and edit it. To clone a dashboard, open the browse menu (…) and select Clone.
To remove a dashboard from the dashboards list, you can hide it. To hide a dashboard, open the browse menu (…) and select Hide.
Hiding a dashboard doesn't affect other users.
View service metrics
You can view the service metrics in your Dynatrace environment either on the custom device overview page or on your Dashboards page.
View metrics on the custom device overview page
To access the custom device overview page
- Go to Technologies & Processes.
- Filter by service name and select the relevant custom device group.
- Once you select the custom device group, you're on the custom device group overview page.
- The custom device group overview page lists all instances (custom devices) belonging to the group. Select an instance to view the custom device overview page.
Available metrics
| Name | Description | Dimensions | Unit | Recommended |
|---|---|---|---|---|
Active queries | Active queries. Using this metric unfiltered and unsplit displays all active queries running on the system. | Count |
| |
Blocked by firewall | The number of logins to the data warehouse from the database application that the firewall blocks. | Count |
| |
CPU percentage | The percentage of CPU that all nodes utilize for the data warehouse. | Percent |
| |
Cache hit percentage | The sum of all columnstore segments hits in the local SSD cache. | Percent | ||
Cache used percentage | The sum of all bytes in the local SSD cache across all nodes. | Percent | ||
DWU limit | The Data Warehouse Unit, which is the service-level objective of the data warehouse. | Count |
| |
DWU percentage | The maximum value when compared between CPU percentage and Data IO percentage. | Percent |
| |
DWU used | DWU limit * DWU percentage | Count |
| |
Data IO percentage | The percentage of IO that all nodes utilize for the data warehouse. | Percent |
| |
Effective cap resource percent | The effective cap resource percent for the workload group. If there are other workload groups with the effective min resource percent higher than | Is user defined, workload group | Percent | |
Effective min resource percent | The effective minimum resource percentage setting allowed, considering the service level and the workload group settings. | Is user defined, workload group | Percent | |
Failed connections | The number of failed connections to the data warehouse from the database application. | Count |
| |
Local tempdb percentage | The percentage of the local tempdb that all compute nodes utilize. | Percent | ||
Memory percentage | The percentage of memory of the SQL Server utilized across all nodes for the data warehouse. | Percent |
| |
Queued queries | Cumulative count of requests queued after the maximum concurrency limit was reached. | Count |
| |
Successful connections | The number of successful connections to the data from the database application. | Count |
| |
Workload group active queries | The active queries within the workload group. Using this metric unfiltered and unsplit displays all active queries running on the system. | Is user defined, workload group | Count | |
Workload group allocation by cap resource percent | ||||
The percentage allocation of resources relative to the effective cap resource percent per workload group. This metric provides the effective utilization of the workload group. | Is user defined, Workload group. | Percent | ||
Workload group allocation by system percent | The percentage allocation of resources relative to the entire system. | Is user defined, workload group | Percent | |
Workload group query timeouts | Queries for the workload group that have timed out. | Is user defined, workload group | Count | |
Workload group queued queries | Cumulative count of requests queued after the maximum concurrency limit was reached. | Is user defined, workload group | Count |