Azure Machine Learning monitoring
- How-to guide
- 5-min read
- Published Aug 19, 2020
Dynatrace ingests metrics for multiple preselected namespaces, including Azure Machine Learning. You can view metrics for each service instance, split metrics into multiple dimensions, and create custom charts that you can pin to your dashboards.
Prerequisites
- Dynatrace version 1.200+
- Environment ActiveGate version 1.195+
Enable monitoring
To learn how to enable service monitoring, see Enable service monitoring.
View service metrics
You can view the service metrics in your Dynatrace environment either on the custom device overview page or on your Dashboards page.
View metrics on the custom device overview page
To access the custom device overview page
- Go to Technologies & Processes.
- Filter by service name and select the relevant custom device group.
- Once you select the custom device group, you're on the custom device group overview page.
- The custom device group overview page lists all instances (custom devices) belonging to the group. Select an instance to view the custom device overview page.
View metrics on your dashboard
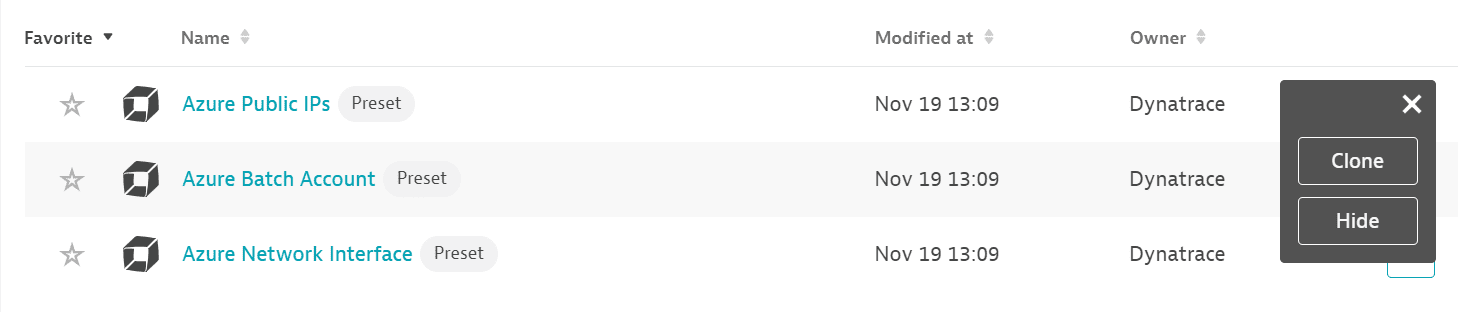
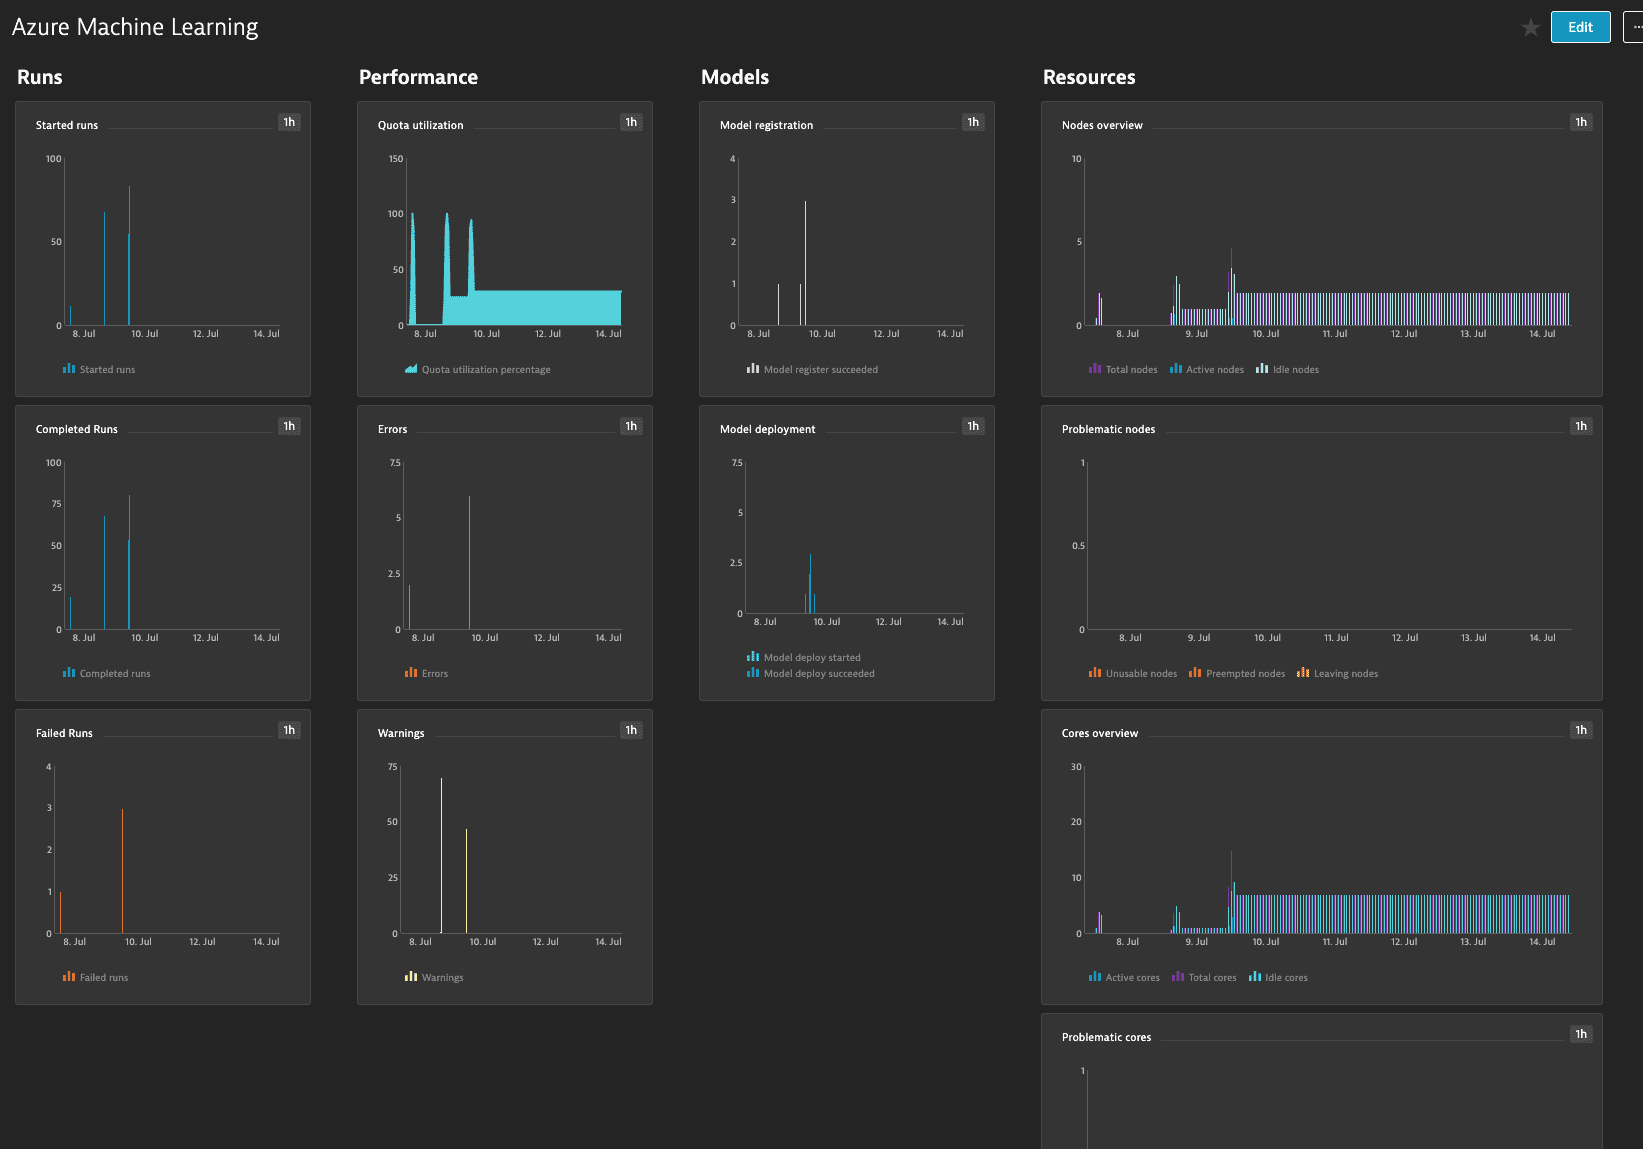
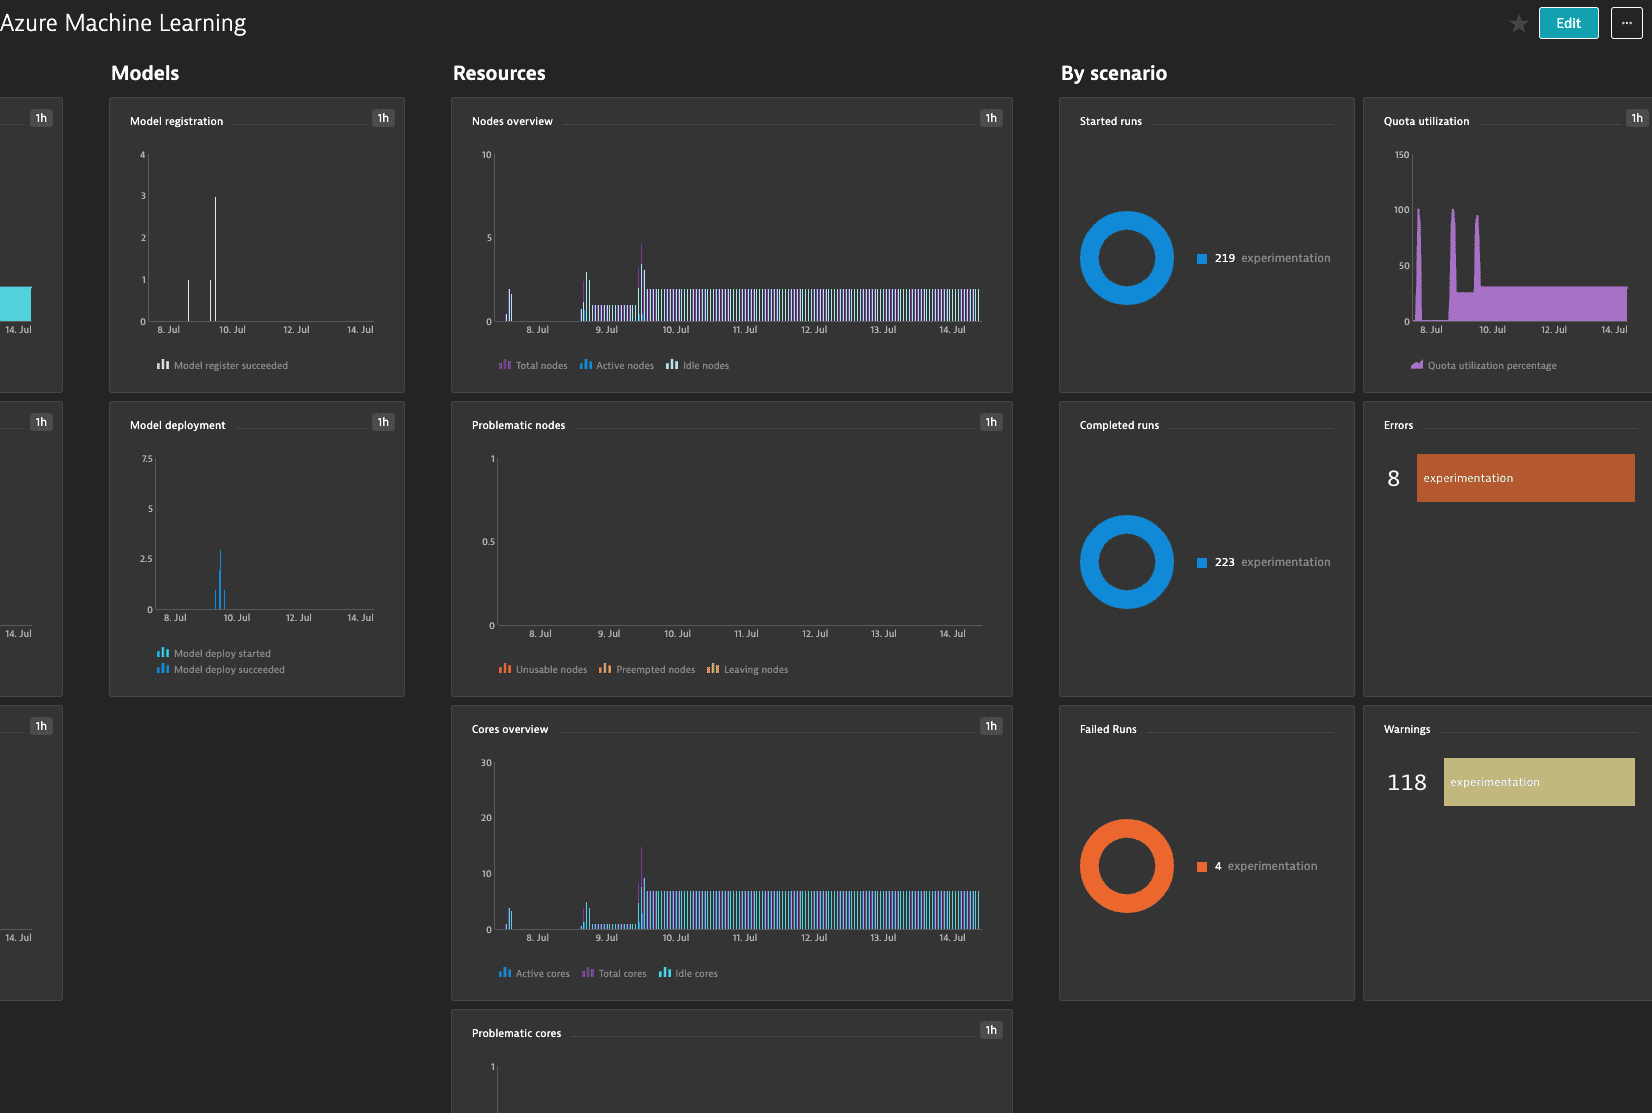
If the service has a preset dashboard, you'll get a preset dashboard for the respective service containing all recommended metrics on your Dashboards page. You can look for specific dashboards by filtering by Preset and then by Name.
For existing monitored services, you might need to resave your credentials for the preset dashboard to appear on the Dashboards page. To resave your credentials, go to Settings > Cloud and virtualization > Azure, select the desired Azure instance, then select Save.
You can't make changes on a preset dashboard directly, but you can clone and edit it. To clone a dashboard, open the browse menu (…) and select Clone.
To remove a dashboard from the dashboards list, you can hide it. To hide a dashboard, open the browse menu (…) and select Hide.
Hiding a dashboard doesn't affect other users.
Available metrics
| Name | Description | Dimensions | Unit | Recommended |
|---|---|---|---|---|
Active Cores | Number of active cores. | Scenario, ClusterName | Count |
|
Active Nodes | Number of active nodes. These are the nodes which are actively running a job. | Scenario, ClusterName | Count |
|
Cancel Requested Runs | Number of runs where cancel was requested for this workspace. Count is updated when cancellation request has been received for a run. | Scenario, RunType, PublishedPipelineId, ComputeType, PipelineStepType | Count | |
Cancelled Runs | Number of runs cancelled for this workspace. Count is updated when a run is successfully cancelled. | Scenario, RunType, PublishedPipelineI, ComputeType, PipelineStepType | Count | |
Completed Runs | Number of runs completed successfully for this workspace. Count is updated when a run has completed and output has been collected. | Scenario, RunType, PublishedPipelineId, ComputeType, PipelineStepType | Count |
|
CpuUtilization | Percentage of memory utilization on a CPU node. Utilization is reported at one minute intervals. | Scenario, runId, NodeId, ClusterName | Percent |
|
Errors | Number of run errors in this workspace. Count is updated whenever run encounters an error. | Scenario | Count |
|
Failed Runs | Number of runs failed for this workspace. Count is updated when a run fails. | Scenario, RunType, PublishedPipelineId, ComputeType, PipelineStepType | Count |
|
Finalizing Runs | Number of runs entered finalizing state for this workspace. Count is updated when a run has completed but output collection still in progress. | Scenario, RunType, PublishedPipelineId, ComputeType, PipelineStepType | Count |
|
GpuUtilization | Percentage of memory utilization on a GPU node. Utilization is reported at one-minute intervals. | Scenario, runId, NodeId, DeviceId, ClusterName | Percent |
|
Idle Cores | Number of idle cores. | Scenario, ClusterName | Count |
|
Idle Nodes | Number of idle nodes. Idle nodes are the nodes which are not running any jobs but can accept new job if available. | Scenario, ClusterName | Count |
|
Leaving Cores | Number of leaving cores | Scenario, ClusterName | Count |
|
Leaving Nodes | Number of leaving nodes. Leaving nodes are the nodes which just finished processing a job and will go to Idle state. | Scenario, ClusterName | Count |
|
Model Deploy Failed | Number of model deployments that failed in this workspace. | Scenario, StatusCode | Count |
|
Model Deploy Started | Number of model deployments started in this workspace. | Scenario | Count |
|
Model Deploy Succeeded | Number of model deployments that succeeded in this workspace. | Scenario | Count |
|
Model Register Failed | Number of model registrations that failed in this workspace. | Scenario, StatusCode | Count |
|
Model Register Succeeded | Number of model registrations that succeeded in this workspace. | Scenario | Count |
|
Not Responding Runs | Number of runs not responding for this workspace. Count is updated when a run enters Not Responding state. | Scenario, RunType, PublishedPipelineId, ComputeType, PipelineStepType | Count |
|
Not Started Runs | Number of runs in Not Started state for this workspace. Count is updated when a request is received to create a run but run information has not yet been populated. | Scenario, RunType, PublishedPipelineId, ComputeType, PipelineStepType | Count |
|
Preempted Cores | Number of preempted cores | Scenario, ClusterName | Count |
|
Preempted Nodes | Number of preempted nodes. These nodes are the low priority nodes which are taken away from the available node pool. | Scenario, ClusterName | Count |
|
Preparing Runs | Number of runs that are preparing for this workspace. Count is updated when a run enters Preparing state while the run environment is being prepared. | Scenario, RunType, PublishedPipelineId, ComputeType, PipelineStepType | Count | |
Provisioning Runs | Number of runs that are provisioning for this workspace. Count is updated when a run is waiting on compute target creation or provisioning. | Scenario, RunType, PublishedPipelineId, ComputeType, PipelineStepType | Count | |
Queued Runs | Number of runs that are queued for this workspace. Count is updated when a run is queued in compute target. Can occur when waiting for required compute nodes to be ready. | Scenario, RunType, PublishedPipelineId, ComputeType, PipelineStepType | Count |
|
Quota Utilization Percentage | Percent of quota utilized. | Scenario, ClusterName, VmFamilyName, VmPriority | Percent |
|
Started Runs | Number of runs running for this workspace. Count is updated when a run starts running on required resources. | Scenario, RunType, PublishedPipelineId, ComputeType, PipelineStepType | Count |
|
Starting Runs | Number of runs started for this workspace. Count is updated after request to create run and run info, such as the Run Id, has been populated. | Scenario, RunType, PublishedPipelineId, ComputeType, PipelineStepType | Count |
|
Total Cores | Number of total cores. | Scenario, ClusterName | Count |
|
Total Nodes | Number of total nodes. This total includes some of Active Nodes, Idle Nodes, Unusable Nodes, Preempted Nodes, Leaving Nodes. | Scenario, ClusterName | Count |
|
Unusable Cores | Number of unusable cores. | Scenario, ClusterName | Count |
|
Unusable Nodes | Number of unusable nodes. Unusable nodes are not functional due to some unresolvable issue. Azure will recycle these nodes. | Scenario, ClusterName | Count |
|
Warnings | Number of run warnings in this workspace. Count is updated whenever a run encounters a warning. | Scenario | Count |
|