Azure Data Explorer monitoring
- How-to guide
- 3-min read
- Published Sep 22, 2020
Dynatrace ingests metrics from Azure Metrics API for Azure Data Explorer. You can view metrics for each service instance, split metrics into multiple dimensions, and create custom charts that you can pin to your dashboards.
Prerequisites
- Dynatrace version 1.203+
- Environment ActiveGate version 1.195+
Enable monitoring
To learn how to enable service monitoring, see Enable service monitoring.
View service metrics
You can view the service metrics in your Dynatrace environment either on the custom device overview page or on your Dashboards page.
View metrics on the custom device overview page
To access the custom device overview page
- Go to Technologies & Processes.
- Filter by service name and select the relevant custom device group.
- Once you select the custom device group, you're on the custom device group overview page.
- The custom device group overview page lists all instances (custom devices) belonging to the group. Select an instance to view the custom device overview page.
View metrics on your dashboard
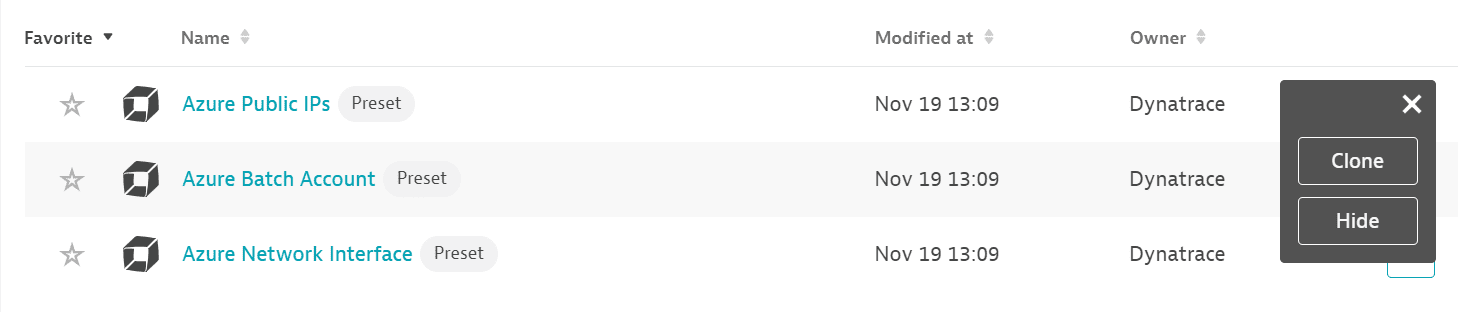
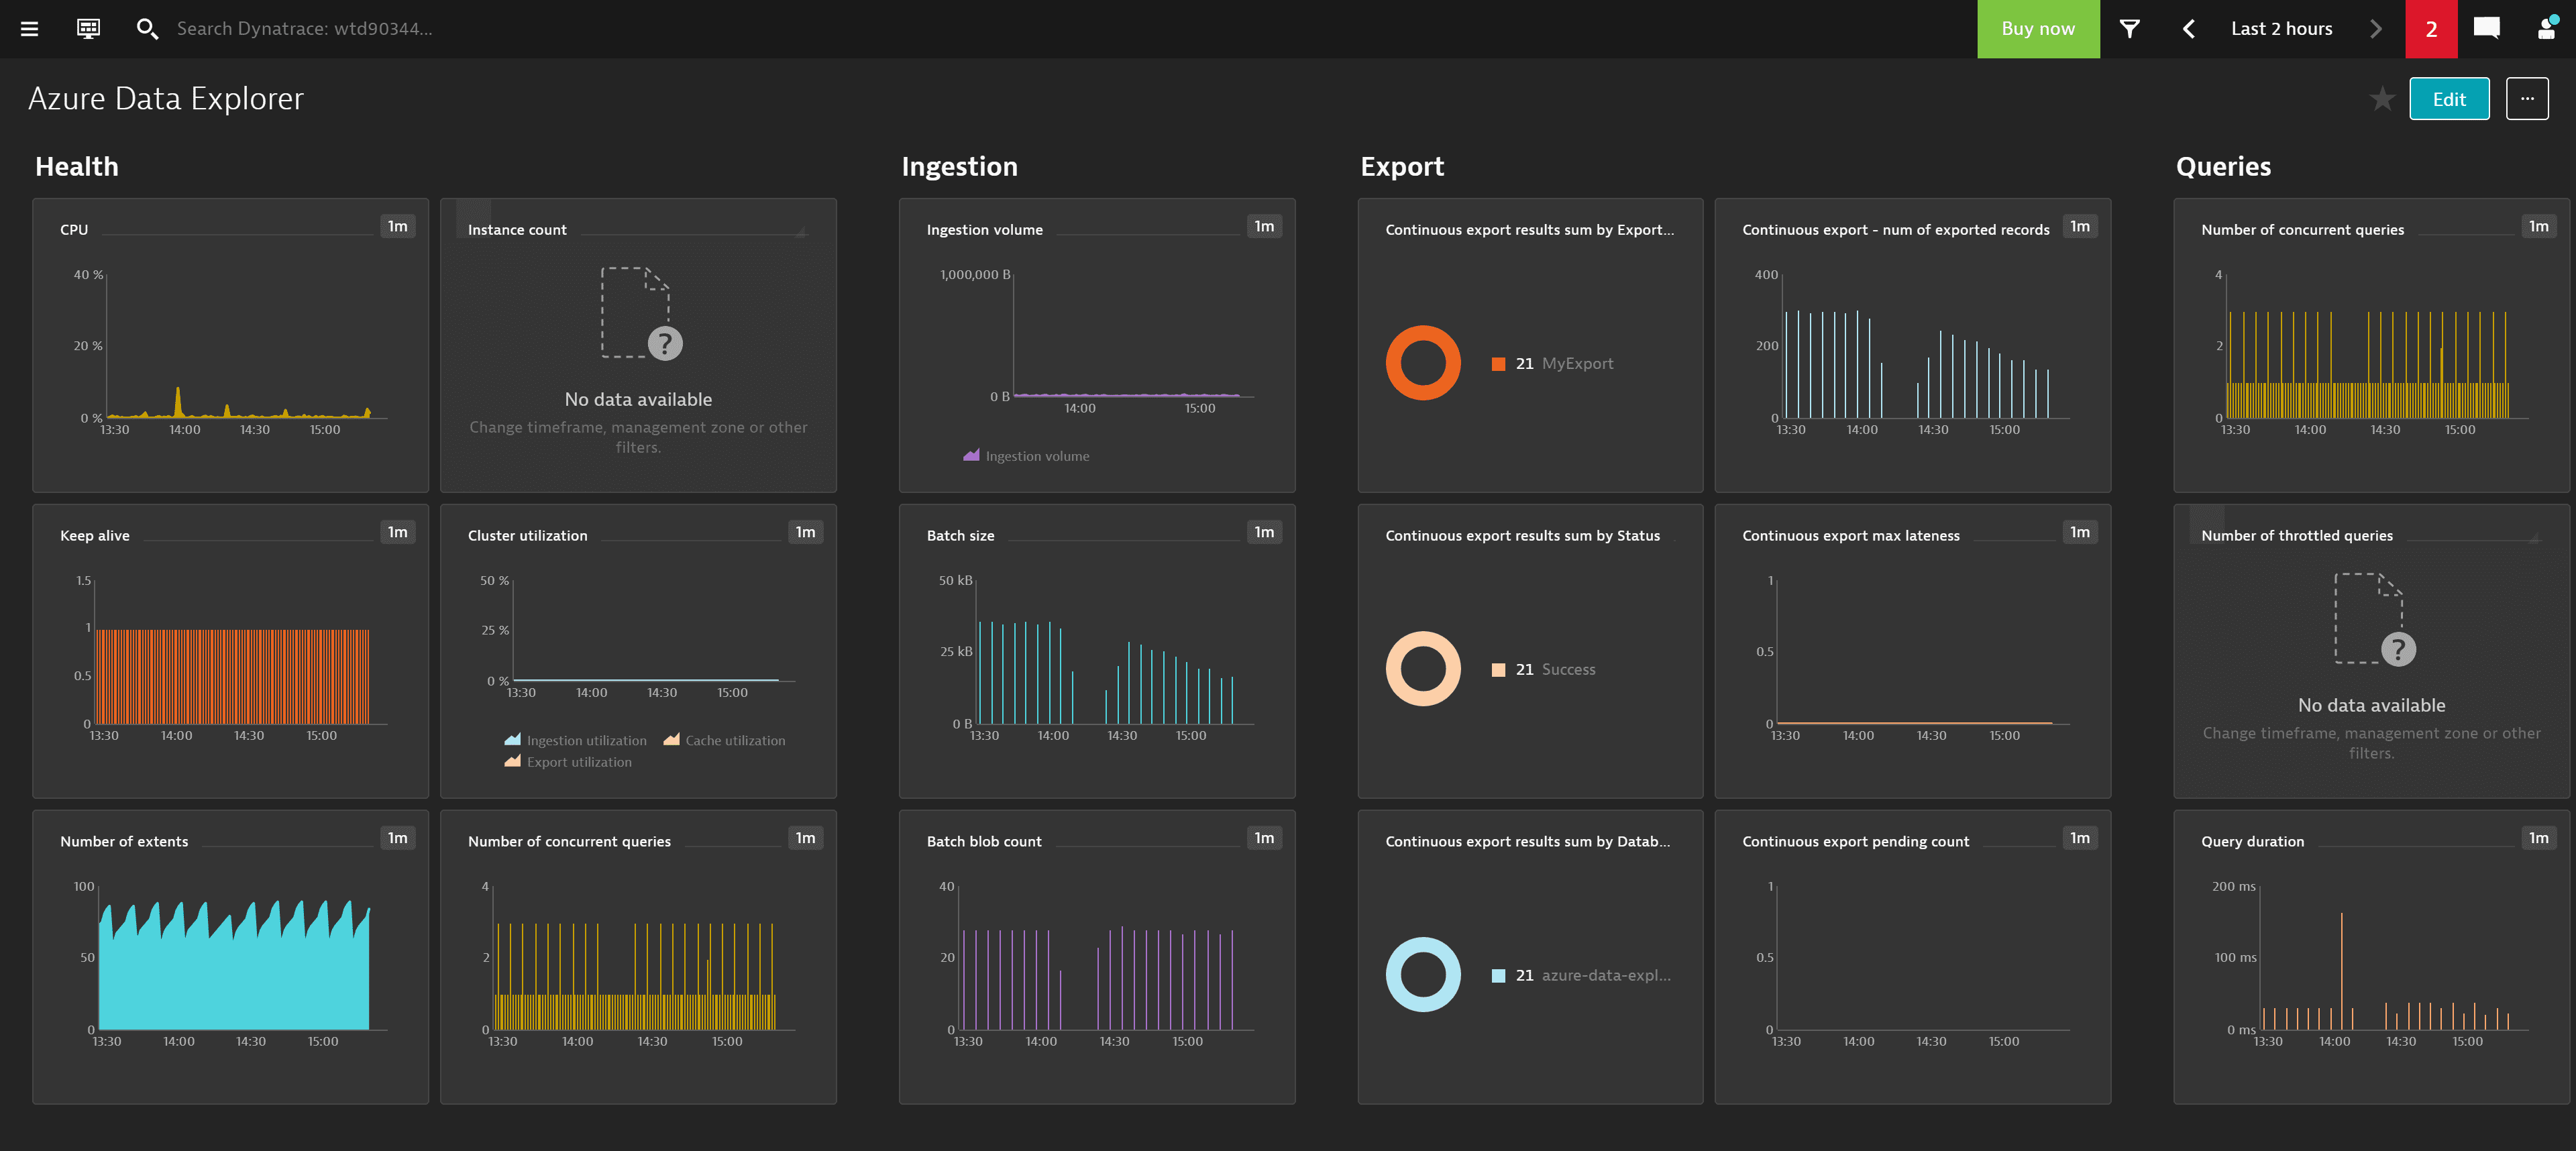
If the service has a preset dashboard, you'll get a preset dashboard for the respective service containing all recommended metrics on your Dashboards page. You can look for specific dashboards by filtering by Preset and then by Name.
For existing monitored services, you might need to resave your credentials for the preset dashboard to appear on the Dashboards page. To resave your credentials, go to Settings > Cloud and virtualization > Azure, select the desired Azure instance, then select Save.
You can't make changes on a preset dashboard directly, but you can clone and edit it. To clone a dashboard, open the browse menu (…) and select Clone.
To remove a dashboard from the dashboards list, you can hide it. To hide a dashboard, open the browse menu (…) and select Hide.
Hiding a dashboard doesn't affect other users.
Available metrics
| Name | Description | Unit | Dimensions | Recommended |
|---|---|---|---|---|
BatchBlobCount | The number of data sources in an aggregated batch for ingestion | Count | Database |
|
BatchDuration | The duration of the aggregation phase in the ingestion flow | Second | Database | |
BatchSize | The uncompressed, expected data size in an aggregated batch for ingestion | Byte | Database |
|
BatchesProcessed | The number of batches aggregated for ingestion | Count | Database, SealReason | |
CPU | The CPU utilization level | Percent |
| |
CacheUtilization | The utilization level in the cluster scope | Percent |
| |
ContinuousExportMaxLatenessMinutes | The lateness (in minutes) reported by the continuous export jobs in the cluster | Count |
| |
ContinuousExportNumOfRecordsExported | The number of records exported, fired for every storage artifact written during the export operation | Count |
| |
ContinuousExportPendingCount | The number of pending continuous export jobs ready for execution | Count |
| |
ContinuousExportResult | Indicates whether continuous export succeeded or failed | Count | ContinuousExportName, Result, Database |
|
EventsProcessedForEventHubs | The number of events processed by the cluster when ingesting from Event/IoT Hub | Count | EventStatus | |
ExportUtilization | The export utilization | Percent |
| |
IngestionLatencyInSeconds | The ingestion time from the source (for example, if message is in EventHub) to the cluster in seconds | Second |
| |
IngestionResult | The number of ingestion operations | Count | IngestionResultDetails | |
IngestionUtilization | The ratio of used ingestion slots in the cluster | Percent |
| |
IngestionVolumeInMB | The overall volume of ingested data to the cluster (in MB) | MegaByte |
| |
InstanceCount | The total instance count | Count | ||
KeepAlive | Sanity check, indicating how the cluster responds to queries | Count |
| |
QueryDuration | The queries duration in seconds | MilliSecond | QueryStatus |
|
SteamingIngestRequestRate | The streaming ingest request rate (requests per second) | Count | ||
StreamingIngestDataRate | The streaming ingest data rate (MB per second) | Count | ||
StreamingIngestDuration | The streaming ingest duration in milliseconds | MilliSecond | ||
StreamingIngestResults | The streaming ingest result | Count | Result | |
TotalNumberOfConcurrentQueries | The total number of concurrent queries | Count |
| |
TotalNumberOfExtents | The total number of data extents | Count |
| |
TotalNumberOfThrottledCommands | The total number of throttled commands | Count | CommandType | |
TotalNumberOfThrottledQueries | The total number of throttled queries | Count |
|