Azure Application Gateway monitoring
- How-to guide
- 4-min read
For information about differences between classic services and other services, see Migrate from Azure classic (formerly 'built-in') services to cloud services.
Dynatrace ingests metrics from Azure Metrics API for Azure Application Gateway. You can view metrics for each service instance, split metrics into multiple dimensions, and create custom charts that you can pin to your dashboards.
Prerequisites
- Dynatrace version 1.199+
- Environment ActiveGate version 1.195+
Enable monitoring
To learn how to enable service monitoring, see Enable service monitoring.
View service metrics
You can view the service metrics in your Dynatrace environment either on the custom device overview page or on your Dashboards page.
View metrics on the custom device overview page
To access the custom device overview page
- Go to Technologies & Processes.
- Filter by service name and select the relevant custom device group.
- Once you select the custom device group, you're on the custom device group overview page.
- The custom device group overview page lists all instances (custom devices) belonging to the group. Select an instance to view the custom device overview page.
View metrics on your dashboard
If the service has a preset dashboard, you'll get a preset dashboard for the respective service containing all recommended metrics on your Dashboards page. You can look for specific dashboards by filtering by Preset and then by Name.
For existing monitored services, you might need to resave your credentials for the preset dashboard to appear on the Dashboards page. To resave your credentials, go to Settings > Cloud and virtualization > Azure, select the desired Azure instance, then select Save.
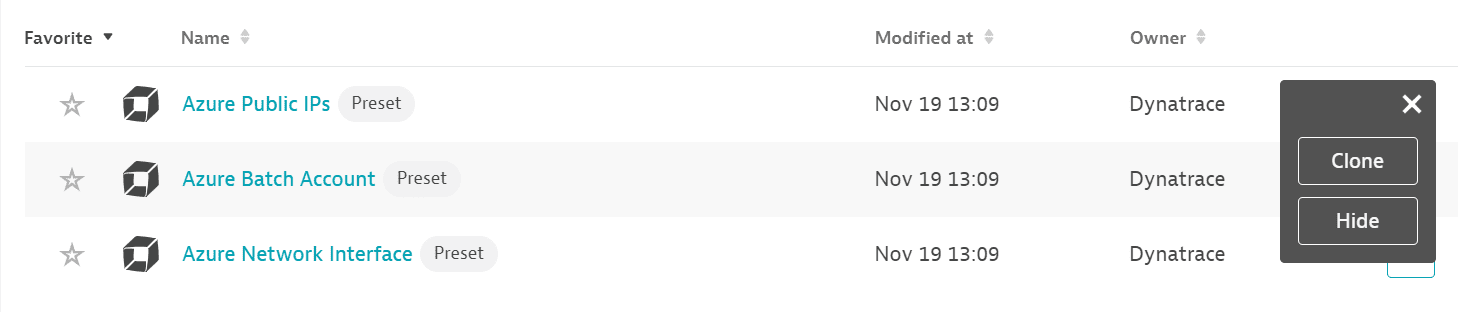
You can't make changes on a preset dashboard directly, but you can clone and edit it. To clone a dashboard, open the browse menu (…) and select Clone.
To remove a dashboard from the dashboards list, you can hide it. To hide a dashboard, open the browse menu (…) and select Hide.
Hiding a dashboard doesn't affect other users.
Available metrics
This service monitors a part of Azure Application Gateway (Microsoft.Network/applicationGateways). While you have this service configured, you can't have Azure Application Gateway service turned on.
| Name | Description | Dimensions | Unit | Recommended |
|---|---|---|---|---|
Throughput | Number of bytes per second the Application Gateway has served | BytePerSecond |
| |
Unhealthy host count | Number of unhealthy backend hosts | Backend pool HTTP settings | Count |
|
Healthy host count | Number of healthy backend hosts | Backend pool HTTP settings | Count |
|
Total requests | Count of successful requests that Application Gateway has served | Backend pool HTTP settings | Count | |
Requests per minute per healthy host | Average request count per minute per healthy backend host in a pool | Backend pool HTTP settings | Count | |
Failed requests | Count of failed requests that Application Gateway has served | Backend pool HTTP settings | Count |
|
Response status | Http response status returned by Application Gateway | HTTP status | Count |
|
Current connections | Count of current connections established with Application Gateway | Count |
| |
CPU utilization | Current CPU utilization of the Application Gateway | Percent | ||
New connections per second | New connections per second established with Application Gateway | PerSecond | ||
Current capacity units | Capacity Units consumed | Count | ||
Fixed billable capacity units | Minimum capacity units that will be charged | Count | ||
Estimated billed capacity units | Estimated capacity units that will be charged | Count | ||
Current compute units | Compute Units consumed | Count | ||
Backend response status | The number of HTTP response codes generated by the backend members. This does not include any response codes generated by the Application Gateway. | Backend server, Backend pool, Backend HTTP setting, HTTP status | Count | |
Client TLS protocol | The number of TLS and non-TLS requests initiated by the client that established connection with the Application Gateway. To view TLS protocol distribution, filter by the dimension TLS Protocol. | Listener, TLS protocol | Count | |
Bytes sent | The total number of bytes sent by the Application Gateway to the clients | Listener | Byte | |
Bytes received | The total number of bytes received by the Application Gateway from the clients | Listener | Byte | |
Client RTT | Round trip time between clients and Application Gateway. This metric indicates how long it takes to establish connections and return acknowledgements | Listener | MilliSecond | |
Application gateway total time | Time that it takes for a request to be processed and its response to be sent. This is the interval from the time when Application Gateway receives the first byte of an HTTP request to the time when the response send operation finishes. It's important to note that this usually includes the Application Gateway processing time, time that the request and response packets are traveling over the network and the time the backend server took to respond. | Listener | MilliSecond | |
Backend connect time | Time spent establishing a connection with a backend server | Listener, Backend server, Backend pool, Backend HTTP setting | MilliSecond | |
Backend first byte response time | Time interval between start of establishing a connection to backend server and receiving the first byte of the response header, approximating processing time of backend server | Listener, Backend server, Backend pool, Backend HTTP setting | MilliSecond | |
Backend last byte response time | Time interval between start of establishing a connection to backend server and receiving the last byte of the response body | Listener, Backend server, Backend pool, Backend HTTP setting | MilliSecond | |
Matched count | Web Application Firewall Total Rule Distribution for the incoming traffic | Rule group, Rule ID | Count | |
Blocked count | Web Application Firewall blocked requests rule distribution | Rule group, Rule ID | Count |