What's new in Dynatrace SaaS version 1.316
- Release notes
- 10-min read
- Rollout start on Jun 3, 2025
This page showcases new features, changes, and bug fixes in Dynatrace SaaS version 1.316. It contains:
OpenTelemetry
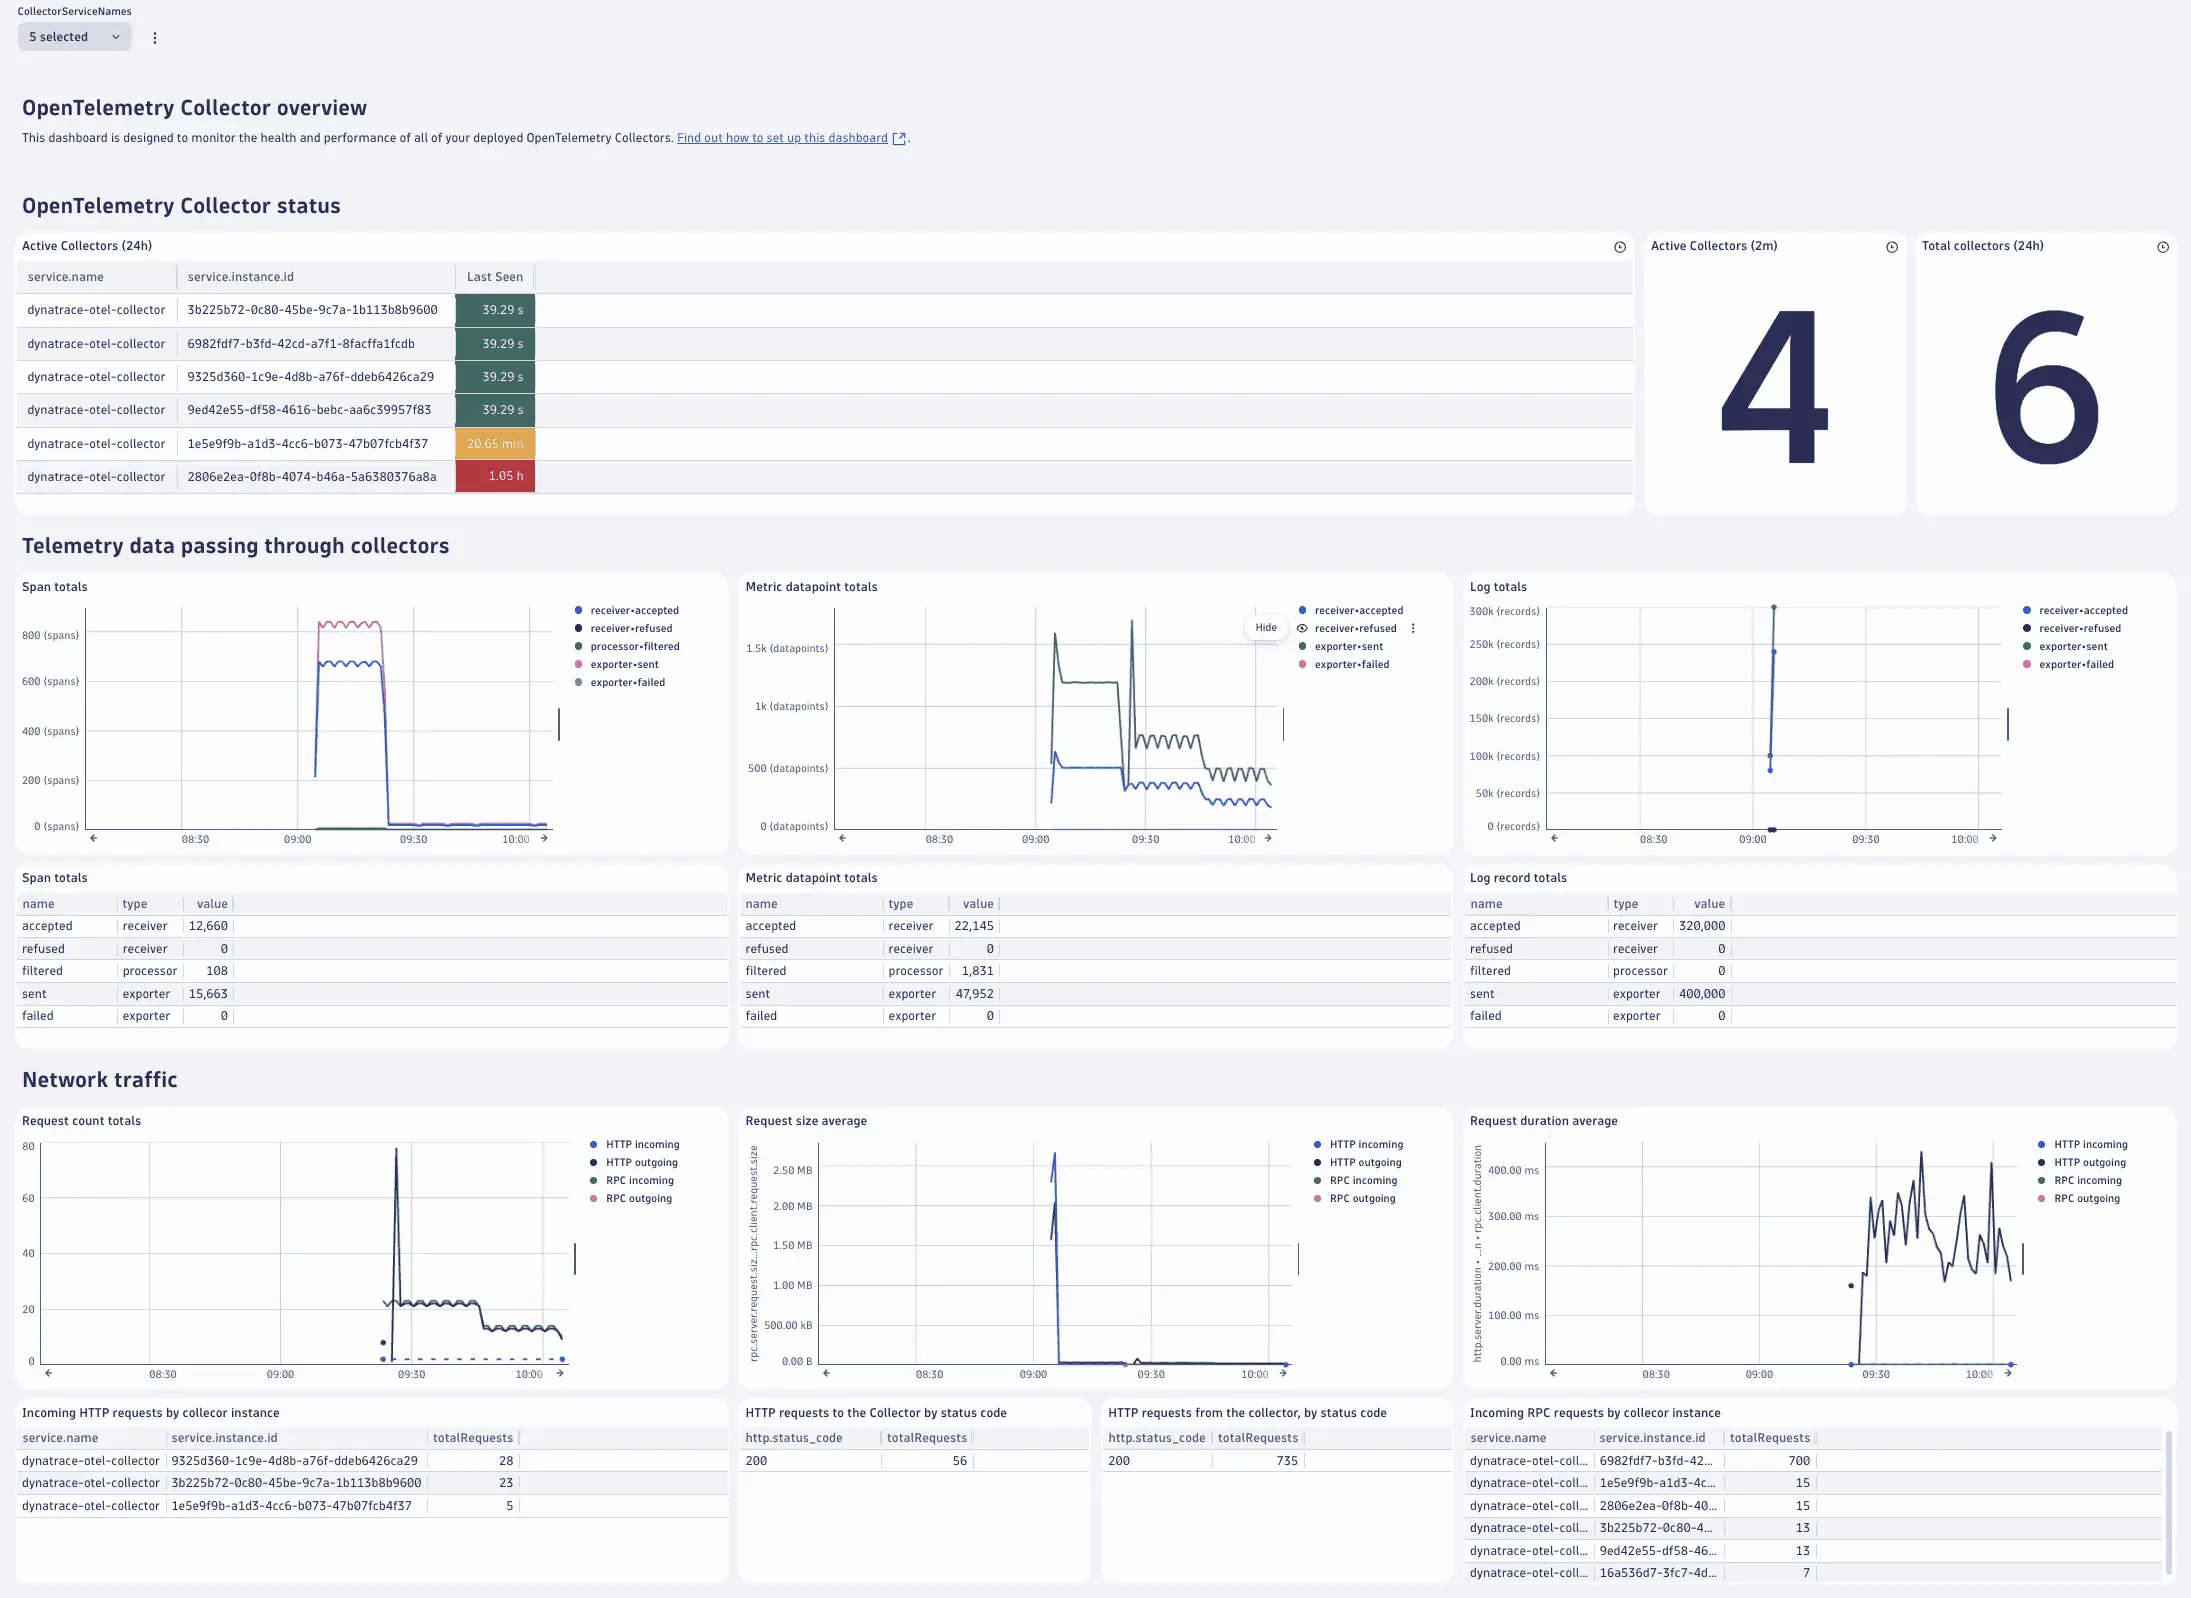
Track health and performance of OpenTelemetry Collectors with self-monitoring
OpenTelemetry Collector Self-Monitoring gives you the power to track the health and performance of your OTel Collectors directly in Dynatrace. By leveraging internal telemetry, you'll get immediate access to ready-made dashboards that visualize your entire Collector fleet or, alternatively, let you drill down into specific Collectors for detailed performance analysis.
Feature updates
Platform | Davis
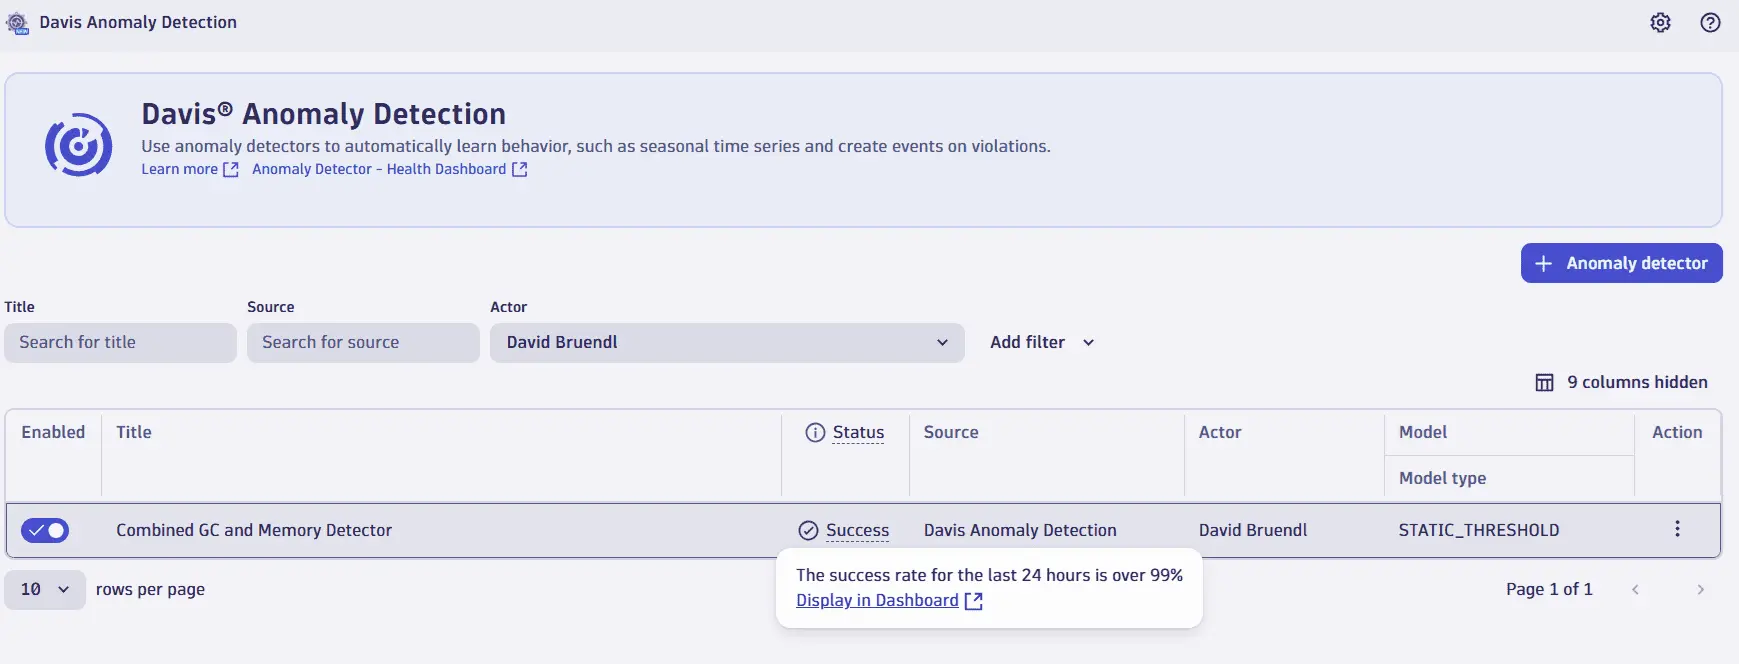
One-click access to Davis Health Dashboard from Anomaly Detector Status
Accessing the ready-made Health Dashboard of your Davis Anomaly Detector has just gotten easier. Click on the status to open the Health Dashboard, where you can get more information about the current health status of your Davis Anomaly Detectors - all from one convenient dashboard.
For more about status types, see Anomaly Detection status types.
Platform | Davis
Enhanced control over Grail record creation via OpenPipeline for Davis Problems and Davis Events
The enablement of OpenPipeline for ingesting Grail records generated by Davis Events—such as anomaly detectors, service or application slowdowns, and infrastructure alerts like CPU saturation—and Davis Problems empowers you with greater control over your data in Grail.
With this update, you can:
- Enrich events and problems with security context, enabling environment segregation based on permission boundaries.
- Mask or exclude specific problem fields entirely.
- Route Davis data to custom storage buckets and manage data retention policies directly within Dynatrace.
Platform | Dashboards and Notebooks
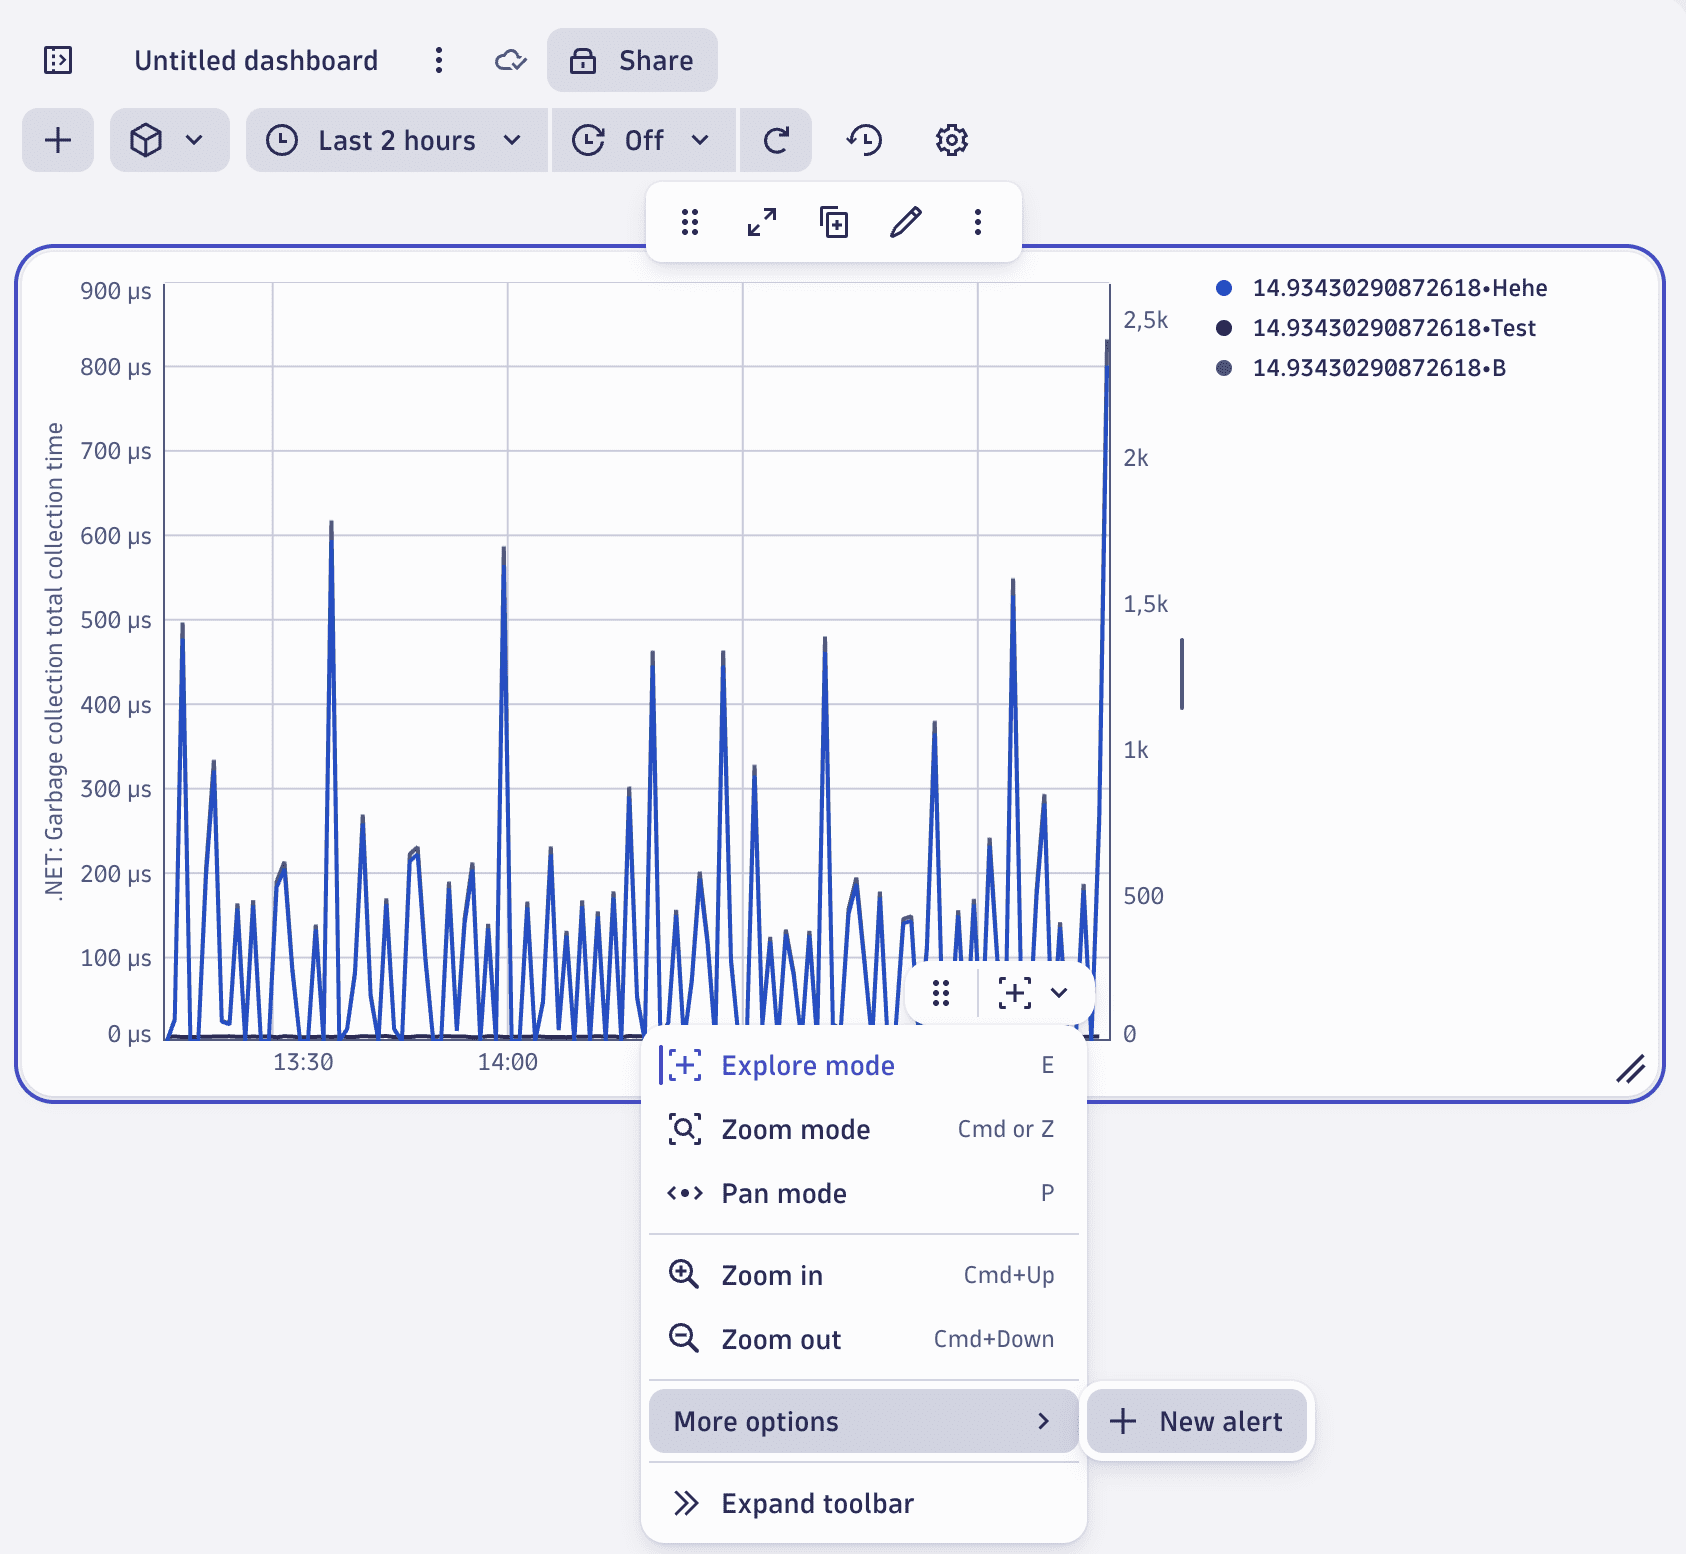
Create alerts faster directly from graph charts
In a  Dashboards or
  Notebooks graph chart, you can now leverage the More options > New alert option from the chart toolbar to more quickly create alerts. This opens a dialog above Dashboards or Notebooks to let you set the anomaly detector that creates alerts right from the chart.
Platform
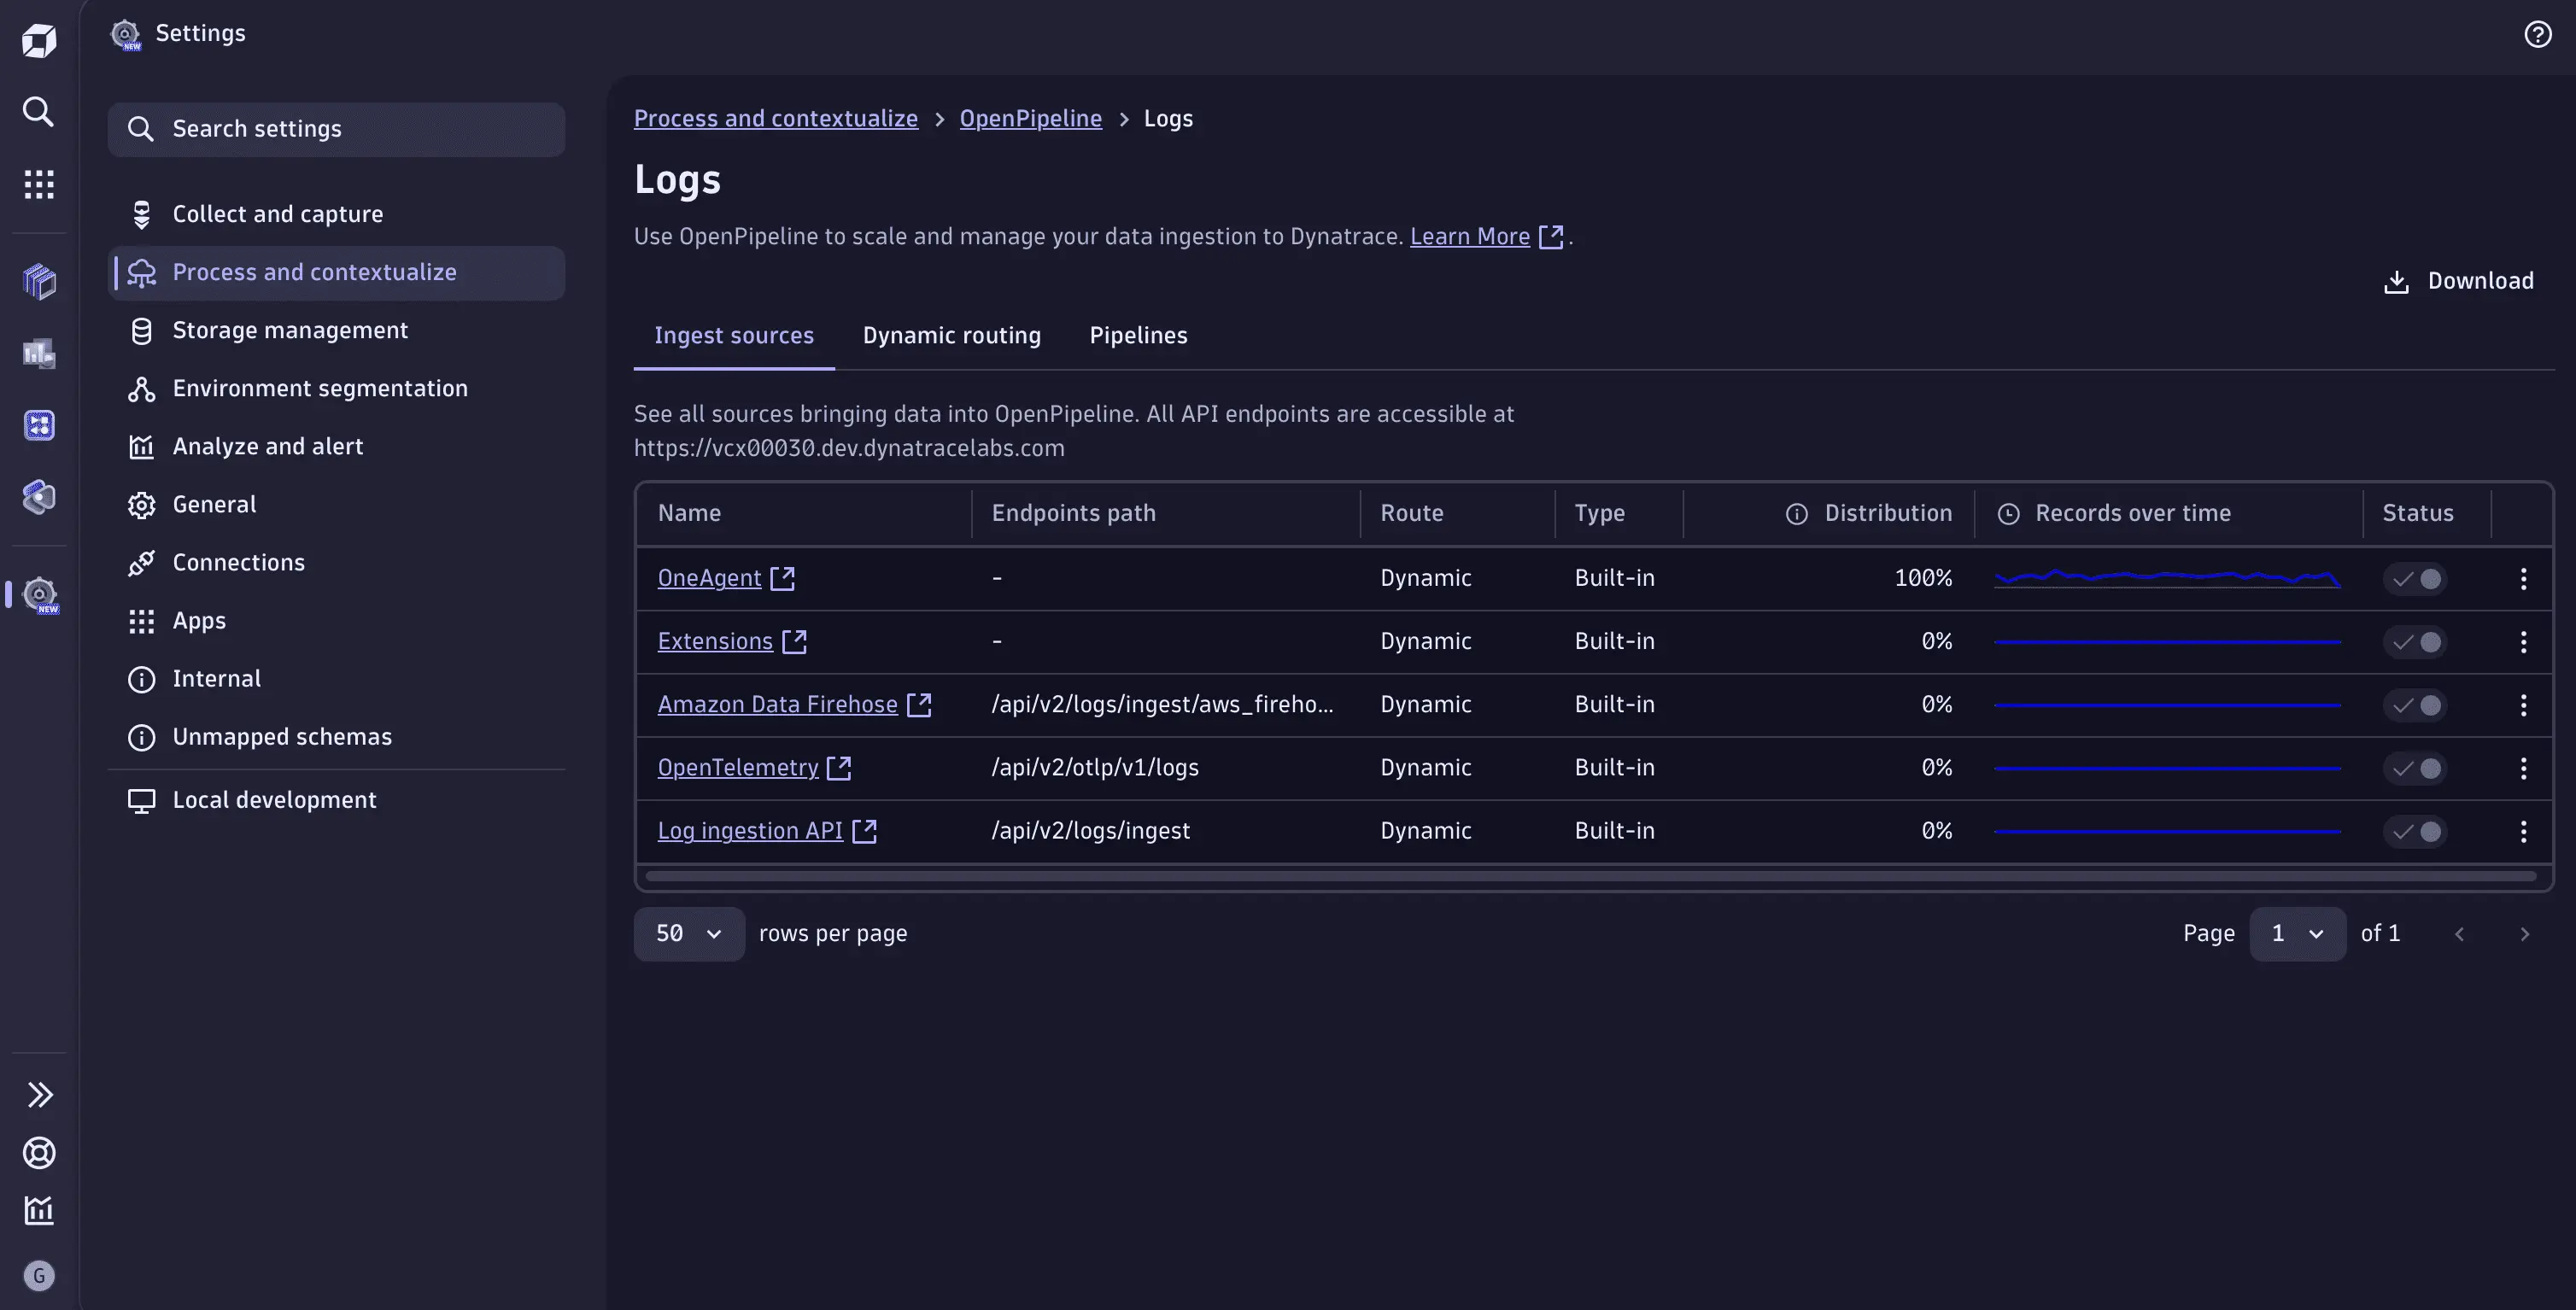
Streamlined access to OpenPipeline
You can now access OpenPipeline as part of ![]() Settings, giving you a streamlined user experience for your contextualizing and processing workload. To try it, go to
Settings, giving you a streamlined user experience for your contextualizing and processing workload. To try it, go to ![]() Settings > Process and contextualize > OpenPipeline.
Settings > Process and contextualize > OpenPipeline.
The stand-alone  OpenPipeline app is now deprecated. For now, you can choose between both versions of OpenPipeline, but we recommend switching to accessing OpenPipeline using Settings at your earliest convenience. The stand-alone OpenPipeline app will be removed from your environment in a later release (to be announced).
Dynatrace Hub
Stay up to date with Dynatrace Hub sort and search
Hub now offers sort and search features to help you keep up to date with the latest changes:
- Sort by Newest Additions to sort the catalog by the newest entries
- Sort by Last Updated to view apps, extensions, and technologies based on their latest release or update date.
Application Observability | Distributed Traces
New trace sampling setting for RPC requests
With the new trace sampling setting for RPC requests, you can configure how OneAgent treats specific Remote Procedure Calls (RPCs) when sampling is needed. You can configure it for a global tenant scope, or for a process group, a host group, a Kubernetes cluster, or a Kubernetes namespace.
Application Observability
Improved data redaction
OneAgent version 1.315+
We have improved data redaction so that data redaction of two variables to the same redacted value no longer changes the order of strings in the web UI.
Platform | Grail
Added new response parameters to Grail Query API
We have updated the Grail Query API specification as follows:
- Added
Retry-Afterheader for 429 responses that indicates the number of seconds to wait before retrying the request. - Added
retryAfterSecondsproperty toErrorResponseto indicate the number of seconds to wait until the next retry.
Application Observability
POST Parameters no longer captured with Query Parameters
Specifying Query Parameter capturing will no longer also capture POST Parameters of the specified name. If needed, Post Parameters will now have to be separately defined in a Body-Capture-Rule.
Software Delivery
Span context propagation for PHP now available
With this release, we have implemented span context propagation for PHP.
Infrastructure Observability | Hosts
Updated OneAgent file aging mechanism
Whether host monitoring is enabled or disabled, unused binaries from the 32-bit and 64-bit directories are now removed. Previously, this was the case only if host monitoring was enabled.
Digital Experience | RUM Mobile
Updated Kotlin version
We have updated Kotlin to version 2.0.21.
Breaking changes
Infrastructure Observability | Kubernetes
Anomaly Detection: Improved "High CPU throttling" alert
We have improved the "High CPU throttling" alert by adjusting the calculation from throttling/usage to throttling/limits. This enhancement ensures more accurate alerts, particularly in scenarios involving idle pods, thereby reducing false positives.
With this update, you can now trust the "High CPU throttling" alert to provide more reliable and actionable insights. If you have customized the thresholds for this alert, please revisit them to ensure they align with the new calculation method.
Digital Experience | Synthetic
Browser monitor autologin is now deprecated
Autologin is now deprecated in browser monitors:
- Browser monitors containing autologin/web form authentication can no longer be edited via API v1 or the web UI.
- 'Web form' authentication is no longer available when creating a browser monitor or on the Advanced setup page.
Platform
Assigning management zones from security context is deprecated
Assigning management zones from the security context is deprecated and will be removed with Dynatrace SaaS version 1.322.
With this change, Settings > Preferences > Management zones > Security context settings will no longer be available.
Use Management zones instead.
Fixes and maintenance
Resolved issues in this release
- Resolved an issue that resulted in logging a
TsmMetricQueryEvaluatorExceptionerror. (PAPA-25342) - Resolved an issue that prevented "OneAgent features" settings on Kubernetes entities from being considered by OneAgent. (PS-33135)
- When sending a Problem notification test email, the message is now also included in plain text. From now on, email clients that do not support HTML will use plain text. (DI-20350)
- Fixed a regression that caused host tags to no longer be considered for OS service monitoring events on OS service entities, for OS service monitoring events sent by OneAgent version 310+. (DI-20559)
- Fixed an issue that displayed an empty space on the dashboard when the upgrade banner was dismissed. (PAPA-25351)
- Session replay: Fixed an issue that forced updated style elements to lose their previous content. In some cases where a style element was being updated, the time after it was created (recording) was shown as a style replacement during the replay. (DEM-8865)
Dynatrace API
To learn about changes to the Dynatrace API in this release, see Dynatrace API changelog version 1.316.