Dynatrace SaaS release notes version 1.255
- Latest Dynatrace
- Release notes
- Published Jan 01, 2020
Rollout start: Nov 29, 2022
New features and enhancements
Vulnerability detection in .NET common language runtime
Application Security | Third-party vulnerabilities
Vulnerability detection in runtimes is now extended to the .NET common language runtime (CLR).
Vulnerabilities in .NET CLR are now visible on the Third-party vulnerabilities page.
Google Cloud overview page
Infrastructure Monitoring | Google Cloud
You can now use the Google Cloud overview page based on the unified analysis framework. It includes views per Google Cloud project and the lists of instances for VMs, SQLs, Cloud Functions, and Kubernetes. To learn how to enable it, see Set up Dynatrace on Google Cloud.
Istio metrics on Kubernetes namespace and workload details pages
Infrastructure Monitoring | Kubernetes
The Istio metrics section displayed on the Kubernetes services details page is now also displayed on the Kubernetes namespace and workload details pages when Istio metrics are available.
Additional DQL functions
Cross Solutions | DQL
Now you can include the following functions in your DQL queries:
New preconfigured dashboard for Adaptive Traffic Management
Apps & Microservices | Distributed traces
A new preconfigured dashboard dedicated to Adaptive Traffic Management is now available, making it easier to oversee and analyze traffic control of Purepath distributed traces ingested by OneAgent.
Change in default anomaly detection setting
Cross Solutions | Anomaly detection
The default anomaly detection setting for Request to unmonitored hosts and Requests to public networks services is now disabled.
Filters for HTTP monitor execution details
Digital Experience Monitoring | Synthetic Monitoring
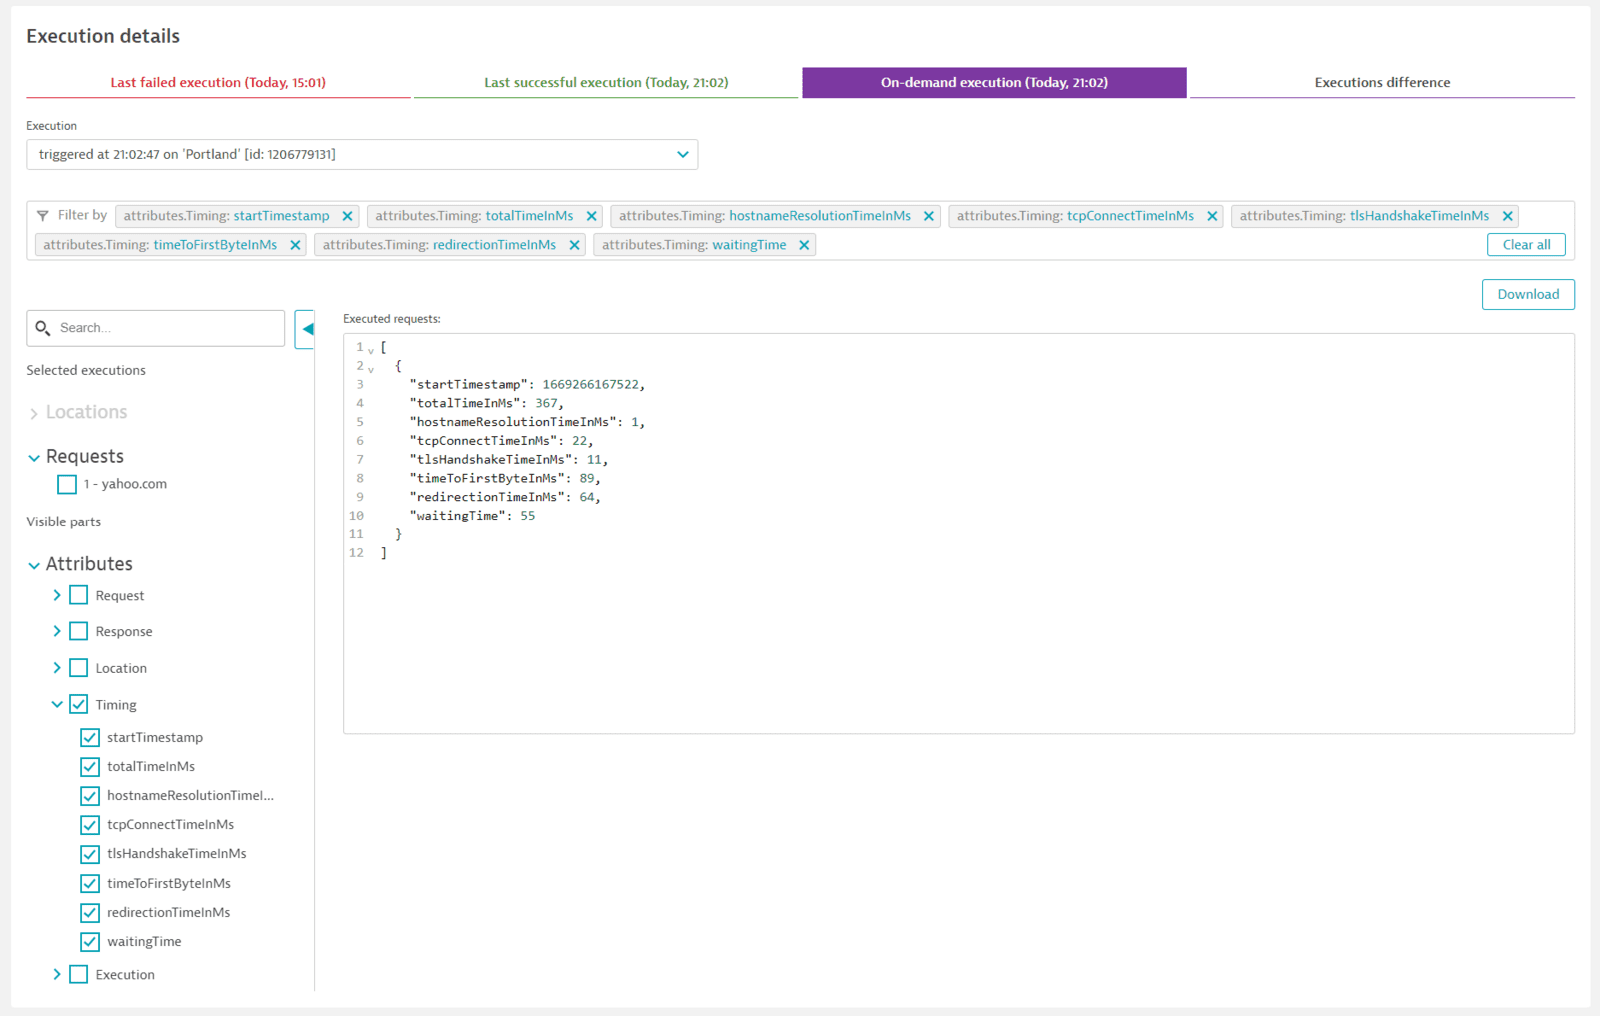
When you Analyze execution details in JSON format for HTTP monitors, new filters and the ability to search text help narrow down your results. Filters enable you to narrow results by request, location, and JSON attributes. The new Executions difference tab compares the last successful and failed executions for each location.

Custom log messages in HTTP monitor execution details
Digital Experience Monitoring | Synthetic Monitoring
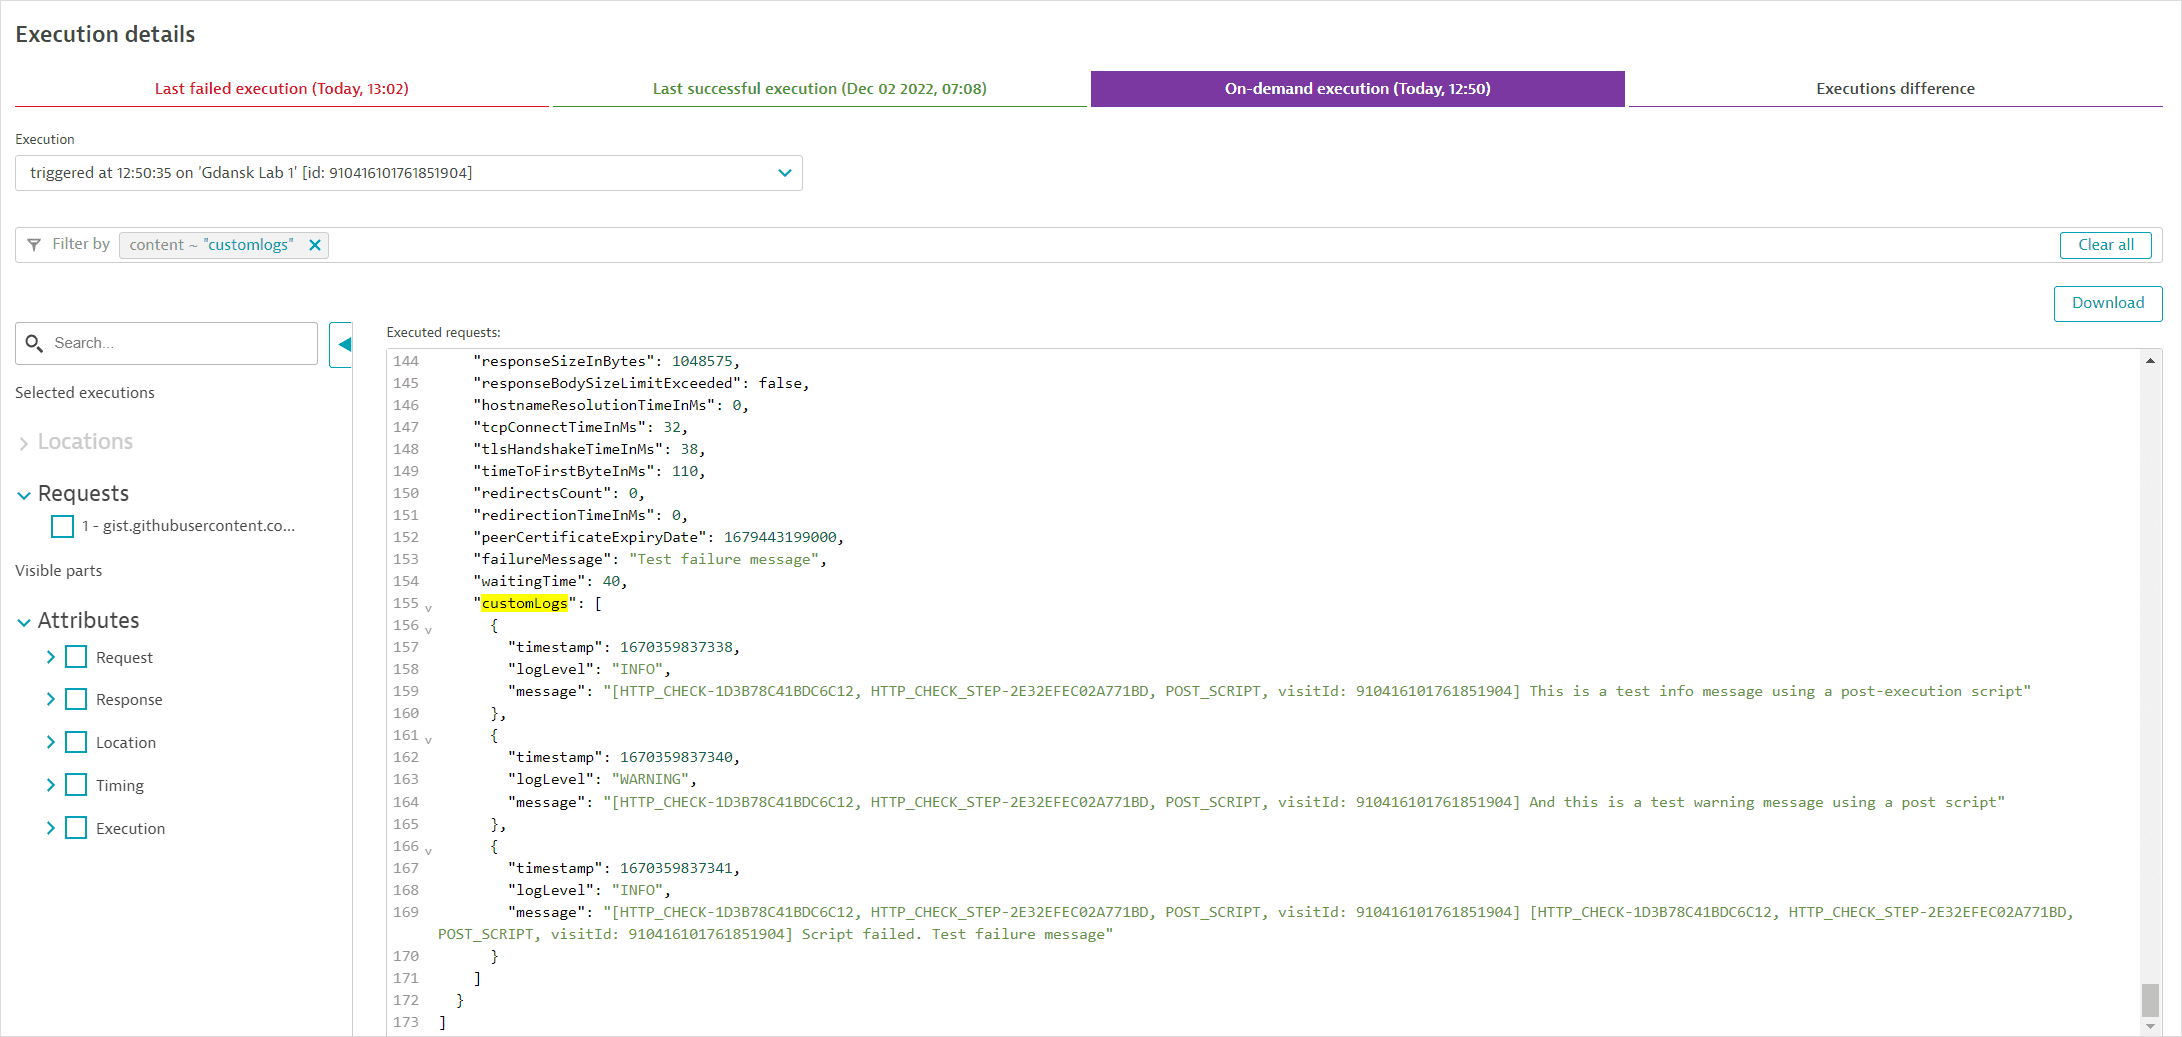
The JSON file for HTTP monitor execution details contains the new customLogs attribute, which displays the timestamp, log level, and log message defined using the api.info(), api.warn(), api.fail(), or api.error() scripting methods. (This feature requires ActiveGate version 1.255+ on private locations.) Custom log messages are viewable for both public and private locations, whereas previously, you could access custom logs only for private locations.

Key-value metadata for on-demand synthetic monitor executions
Digital Experience Monitoring | Synthetic Monitoring
You can define key-value metadata pairs per batch, for example, to identify application versions, when you execute synthetic monitors on-demand via API. This metadata can be retrieved as part of individual or batch results via API and is also displayed in the web UI.
Screenshots upon success for on-demand executions
Digital Experience Monitoring | Synthetic Monitoring
You can capture screenshots upon success for on-demand executions from public or private locations by setting "takeScreenshotsOnSuccess": true in the POST request of the Synthetic - On-demand monitor executions API. Screenshots upon success are captured from the first location specified for a monitor ID. If no location is specified, screenshots are captured from the first executed location.
Dynatrace API
To learn about changes to the Dynatrace API in this release, see Dynatrace API changelog version 1.255.
Resolved issues
General Availability (Build 1.255.156)
The 1.255 GA release contains 15 resolved issues.
| Component | Resolved issues |
|---|---|
| Application Security | 1 |
| Cluster | 10 |
| Synthetic monitoring | 1 |
| Autonomous Cloud | 1 |
| ActiveGate | 2 |
Application Security
- The API response for Kubernetes clusters related entities of third-party vulnerabilities will not return duplicate entities; `HOST` entities have priority over `KUBERNETES_NODE` entities. (CASP-18329)
Cluster
- Fixed problem with events possibly losing management zone assignments if the management zones of entities/metrics changed. (DAVIS-2577)
- Resolved issue where, in rare cases (when OneAgents were unusually out of sync with server time), process restart events were lost. (DAVIS-2651)
- For process metrics on AIX hosts, changed default aggregation from average to sum. (HOST-1622)
- Improved formatting/display of log details sidebar for small screens. (APM-389992)
- Event properties in the scope `deployment` can now be used. Previously, we exported event properties in the scope `deployment` as writable, but they were not actually writable. This was noticeable mostly when ingesting events via the REST API or via Log events. (DAVIS-2645)
- The Log details panel no longer displays a `Topology` section when related data is unavailable. (APM-389709)
- Updated the command in the "Build and run your app" step of the React Native instrumentation wizard. Now it's `npx instrumentDynatrace`. (RUM-8064)
- For process metrics on Windows hosts, changed default aggregation from average to sum. (HOST-1598)
- Fixed problem causing server error (`Application exception` page) when expanding a log record row. (APM-389330)
- Fixed problem with security policies for classic role-based permissions for management zones. Resolves issue in which sign-in failed for users with multiple permissions for the same management zone via security policies. (APM-390356)
Synthetic monitoring
- Corrected message about synthetic monitors when creating a maintenance window. (SYNTH-3044)
Autonomous Cloud
- Kubernetes container restart metric linked from the **Problems** section displays continuous lines. (K8S-4083)
ActiveGate
- The memory dump functionality no longer needs the REST interface enabled. (DMX-2281)
- Fixed proxy settings when updating ActiveGate version 1.248 or earlier where proxy was configured using JVM properties. (DMX-2381)
Update 161 (Build 1.255.161)
This is a cumulative update that contains all previously released updates for the 1.255 release.
Update 164 (Build 1.255.164)
This is a cumulative update that contains all previously released updates for the 1.255 release.