Dynatrace SaaS release notes version 1.232
- Latest Dynatrace
- Release notes
- Published Dec 03, 2021
Product news
- Automatic connection of logs and traces accelerates AI-driven cloud analytics
As digital transformation continues to accelerate and enterprises modernize with the adoption of cloud-native architectures, the number of interconnected components and microservices is exploding. Logs are a critical ingredient in managing and optimizing these application environments. Dynatrace now unifies log monitoring with its patented PurePath technology for distributed tracing and code-level analysis. Logs are now automatically connected to distributed traces for faster analysis and optimization of cloud-native and hybrid applications.
Announcements
TLS 1.0 and 1.1 end-of-support for RUM data
Starting with April 2022, Dynatrace is retiring TLS 1.0 and TLS 1.1 for Dynatrace SaaS RUM data.
Kubernetes monitoring
If until now you could only connect your Kubernetes clusters to Dynatrace via a public Kubernetes API, you now have an easier alternative: connect your clusters via a local Kubernetes API endpoint.
Application Security
- Dynatrace security notification integration with Jira is now available.
- On the Application Security overview page you can now:
- Find information about your host coverage. For instructions on how you can increase host coverage, see How to increase host coverage.
- See the top five affected process groups, and related details.
Dashboards
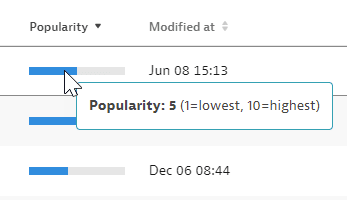
On the Dashboards page, there is a new Popularity column that shows the most-viewed dashboards over the last 30 days. Hover over a popularity bar to see a numerical rating from 1 (least viewed) to 10 (most viewed) for that dashboard.
- To review the changes, go to Dashboards (previous Dynatrace) or
 Dashboards Classic.
 - For details, see Organize Dynatrace dashboards.
Data Explorer
-
The maximum number of metrics per chart has been increased from 5 to 10.
-
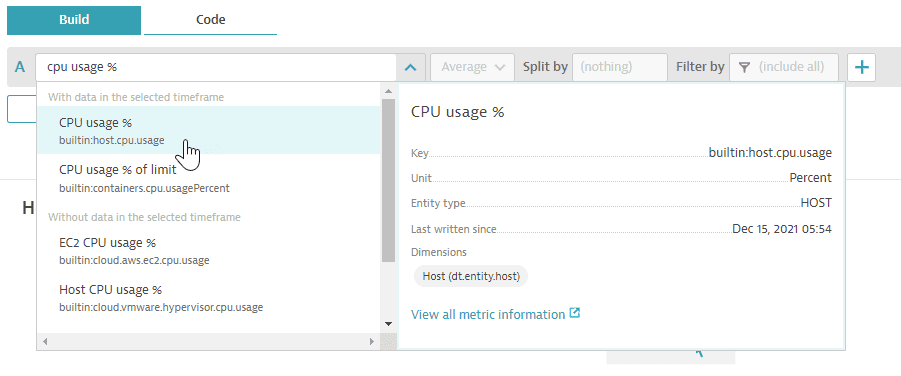
When you select a metric, an overview of the highlighted metric is now displayed. If you need more details about the metric, select View all metric information to open the metric in the Metrics browser.
-
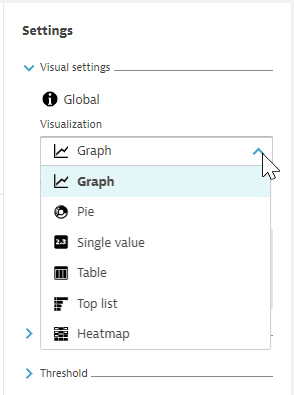
There are new icons for the Visualization options on the right side of the page.
-
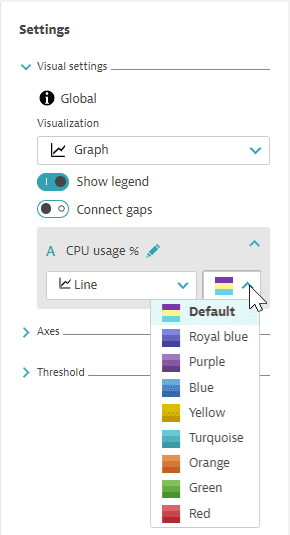
Graph, Pie, Top list, and Heatmap: instead of a single color palette selection per visualization, there is now a color palette selection per metric, including a new color palette: Red.
-
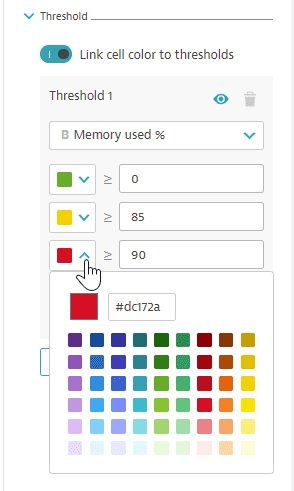
Table: each metric can have its own thresholds, and you can color the table cell backgrounds according to thresholds.
-
Tile text color is adjusted automatically for contrast with the background threshold color.
In Dynatrace, go to Data Explorer to review the changes.
Monitoring consumption
Calculated application, log, and service metrics now consume Davis data units (Metrics pool).
Adaptive Traffic Management
We've optimized the algorithm for Adaptive Traffic Management.
The new algorithm is not bound to a static threshold value. Instead, the capture limit is calculated based on the number of host units per OneAgent-monitored host and the number of incoming service calls to each host. The maximum number of service calls is then distributed among all monitored services on each OneAgent-monitored host. This approach not only prevents services with high loads from consuming your available volume, it also scales automatically with your future requirements as your monitored environment grows or spikes. Especially in highly dynamic environments where services come and go, it's essential to rely on smart algorithms to ensure that your monitoring needs are met now and in the future.
To keep track of actual usage and thresholds of Adaptive Traffic Management, Dynatrace now provides dedicated self-monitoring metrics you can use to build a self-monitoring dashboard.
For more information, see Adaptive Traffic Management.
Rollout
While this new version has been used by selected customers for over a year already, we will start rolling it out to all Dynatrace SaaS environments with Dynatrace version 1.232.
What’s Next?
After the rollout in Dynatrace SaaS, we will extend this capability to Dynatrace Managed. Furthermore, both Dynatrace SaaS and Managed environments will gain the ability to define the importance of monitored services to increase/decrease the number of service calls captured on each tier.
User interface
- The Custom service detection settings have been moved to the Service detection section of the Settings menu.
Settings security policies
These previously existing settings are now available to be used in security policies:
Settings > Web and mobile monitoring > Provider breakdown
Dynatrace API
To learn about changes to the Dynatrace API in this release, see Dynatrace API changelog version 1.232.
Resolved issues
General Availability (Build 1.232.89)
The 1.232 GA release contains 30 resolved issues.
| Component | Resolved issues |
|---|---|
| Cluster | 24 |
| Application Security | 1 |
| Cloud Automation | 1 |
| Log Monitoring | 1 |
| User Interface | 1 |
| RUM | 1 |
| User interface | 1 |
Cluster
- Added REST API endpoint that can be called to set new cluster log events per minute limit based on available resources. (APM-341433)
- Improved cluster detection in root cause analysis. (APM-332992)
- "Server overloaded" popup message no longer displayed on larger deployments. (APM-339014)
- False-positive monitoring alerts caused by internal communication timeouts have been eliminated. (APM-337001)
- Split time series are now aggregated on autogenerated charts on unified analysis page. (APM-340244)
- Fixed occasional inconsistency between filtering by OneAgent version running on hosts and the value displayed for hosts on the "Deployment status" page. (APM-336403)
- "Data explorer" time formatting improved to show days. (APM-333920)
- Improved baselining alert sensitivity for Settings 2.0 configurations to ensure appropriate alerting. (APM-341879)
- Corrected spelling of entity technologies `IBM_WEBSPHERE_APPLICATION_SERVER` and `IBM_WEBSPHERE_LIBERTY`. (APM-338245)
- Legend on "Data explorer" pie chart visualization now correctly reacts to changes in "Show legend" setting. (APM-335899)
- Custom services API - lack of `annotations` parameter no longer breaks validation. (APM-336854)
- Timeframe selector for "Data explorer" now working correctly. (APM-340320)
- Adjusted wording of test results for "Problem notifications" integrations to state which type of notification was tested. (APM-336298)
- When a request filter is active on browser monitor multidimensional analysis, text is displayed during calculated metric creation to warn that the request filter is ignored for the created metric. (APM-335916)
- Fixed a bug with the setting "Mask user actions (web applications only)" for browser extension injected applications. (APM-337861)
- Date and time are now determined and displayed consistently across user sessions, session details, and user details pages. (APM-337538)
- Resolved issue in which custom metrics created in the last 10 seconds of a minute and data written in those 10 seconds could return different data for minute resolution than for higher resolutions after 1 or more hours. (APM-335710)
- Resolved issue in "Data explorer" in which splitBy information was dropped when a filter condition was added to a query. (APM-332819)
- Fixed an issue in which some users received "403 Forbidden" error on attempt to access Anomaly Detection pages. (APM-341698)
- Improved handling of preset dashboards in dashboard JSON editor: presets can now be edited by their non-admin owners in the editor, and an error message is now shown when a non-admin tries to publish or unpublish a preset in the editor. (APM-335491)
- Corrected an issue with process group monitoring overrides. (APM-339558)
- Fixed an issue in which the Kubernetes detail page crashed with a 403 status code for management zones users. (APM-341209)
- Improved request error capturing with HTTP status codes. (APM-338028)
- Resolved issue in which a user with only write settings permission for a management zone containing HTTP monitors couldn't duplicate a HTTP monitor via the synthetic list. (APM-337735)
Application Security
- Removed the "Show all process groups" button in the "Affected Process Groups" pane of the "Security overview" page. (CASP-12511)
Cloud Automation
- Fixed an issue in which access tokens with slo.read permissions could be used to delete an SLO via Dynatrace API. (APM-338563)
Log Monitoring
- The "Log query table" dashboard tile now supports multi-slice search API calls. (APM-325844)
User Interface
- Improved messaging for access token generation when user has insufficient permissions. (APM-338100)
RUM
- Improved behavior of color selector for "Data explorer" thresholds. (APM-337840)
User interface
- Improved performance of Kubernetes cluster details page when Events API v2 is enabled. (APM-335805)
Update 101 (Build 1.232.101)
This cumulative update contains 3 resolved issues (including 1 vulnerability resolution) and all previously released updates for the 1.232 release.
| Component | Resolved issues |
|---|---|
| Session Replay | 1 |
| Cluster | 2 (1 vulnerability) |
Session Replay
- Fixed a bug that prevented updating Session Replay privacy settings from REST API. (APM-345827)
Cluster
- Vulnerability: Updated log4j in Elasticsearch client to version 2.17.1.Updated log4j in Elasticsearch client to version 2.17.1. (APM-345471)
- Capitalized filter values are now correctly parsed. (APM-338476)