Dynatrace SaaS release notes version 1.200
- Latest Dynatrace
- Release notes
- Published Jul 31, 2020
Product news
- Ensure unrivaled customer experience with Davis® AI-powered HTTP and custom error analytics
Dynatrace announces improved error workflow and extended Davis AI awareness of alerting. We now detect and report problems related to your client-side HTTP errors and custom errors, automatically and out of the box.
Resolved issues
General Availability (Build 1.200.75)
The 1.200 GA release contains 16 resolved issues.
| Component | Resolved issues |
|---|---|
| Cluster | 7 |
| Autonomous Cloud | 1 |
| User Interface | 3 |
| infrastructure monitoring solution | 1 |
| on-prem installation | 1 |
| RUM | 2 |
| Session Replay | 1 |
Cluster
- Fixed UI issue where some entities show normal events as frequent issues. (APM-250550)
- Linked problems are no longer returned in the mobile problem feed. (APM-250451)
- Dashboard settings "Default management zone" list no longer displays "(no permissions)" after turning off "Default management zone". (APM-251678)
- Fixed issue in which Session Details event list error flag disappeared on screen resize. (APM-244098)
- For AWS load balancers, more detailed information about the number of affected EC2s is now visualized. (APM-246341)
- On CPU usage chart for Windows host, System and User metrics are no longer interchanged. (APM-249343)
- In a Dynatrace Managed deployment, it's now possible to have a representation of the environment UUID in the docker image name. This enables having images from multiple tenants on one machine without them overriding each other. Applies to all images that are pullable from our Docker repository implementation and is optional. (APM-249123)
Autonomous Cloud
- Cloud Foundry and Azure buttons on Deploy Dynatrace page now open pages in new tabs. (APM-248520)
User Interface
- Resolved Dynatrace UI loading issue on iPhone and iPad when custom proxy is enabled. (APM-247598)
- Standardized the size of sunburst and radial charts in user session pages. (APM-248368)
- Fixed sharing links from new timeframe selector in India and other non-integer time zones, introduced in 198. (APM-250351)
infrastructure monitoring solution
- Introduced additional CPU and memory metrics for containers. Furthermore improved and harmonized existing container metrics. (APM-248331)
on-prem installation
- Fix for Cassandra tables size calculation. The space calculator will be aware of newly excluded tables. (APM-251619)
RUM
- Fixed Cloudflare property pack issues. (APM-249708)
- Improved performance of some Applications pages. (APM-248631)
Session Replay
- Session Replay data fetch improved for sessions with a high amount of processing in the cluster. (APM-251725)
Update 84 (Build 1.200.84)
This cumulative update contains 1 resolved issue and all previously released updates for the 1.200 release.
Cluster
- Tags with colons can now be applied as filters on Deployment Status - OneAgents page. (APM-253257)
Updates
Displaying availability on the Synthetic monitors page
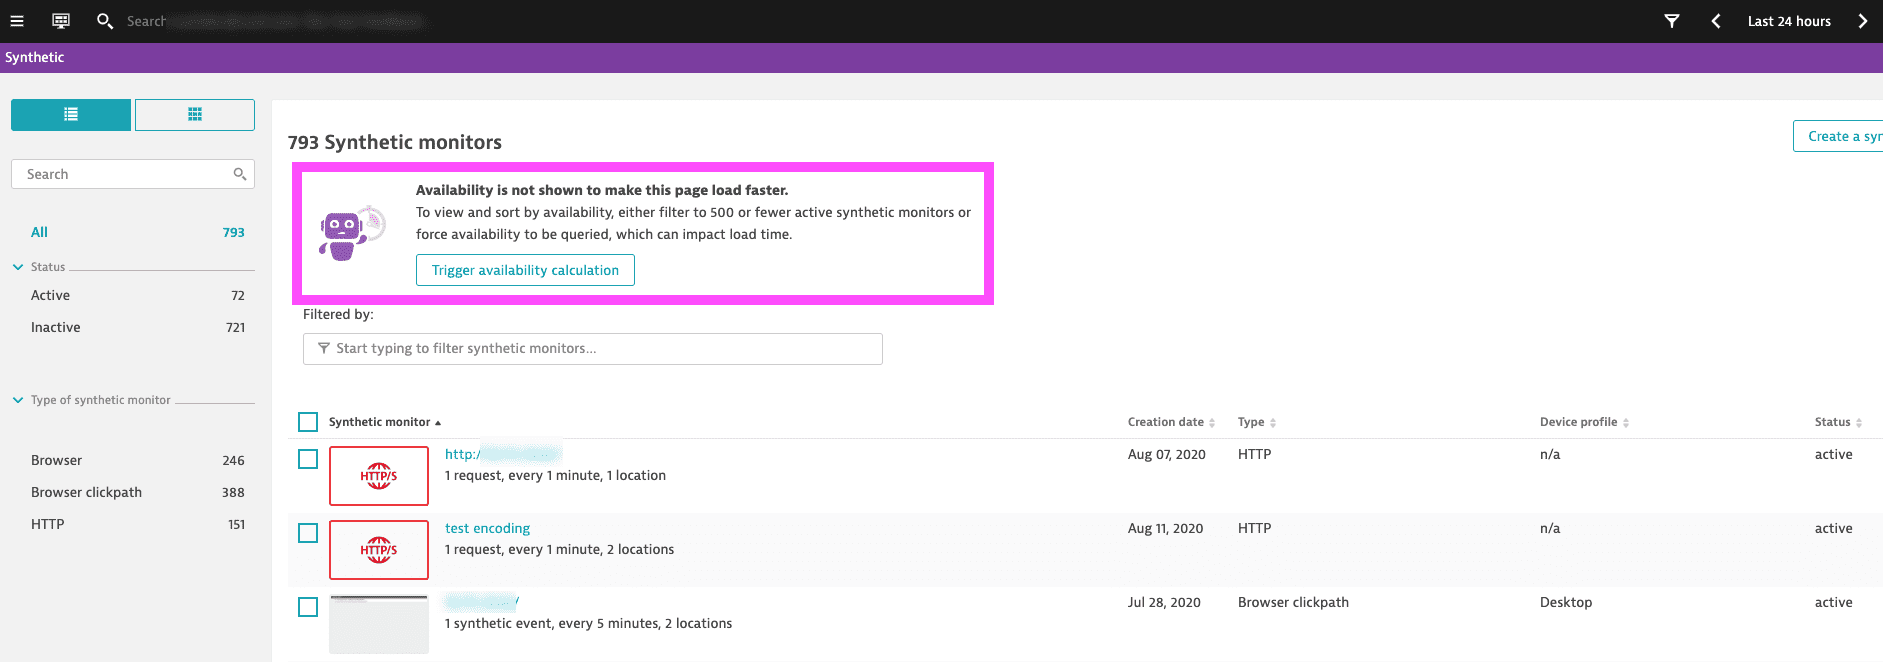
To improve the load time of the list on the Synthetic monitors page, availability is only displayed if the filtered list contains fewer than 500 monitors. Or you can manually display the Availability column by selecting Trigger availability calculation.

Error code for browser monitors failing basic authentication
On Chrome 84+, browser monitors that fail because of an issue with basic authentication will now report the 401 (Unauthorized) status code instead of the error code 12144 (ERR_INVALID_AUTH_CREDENTIALS). Note that HTTP monitors already report the 401 status code when they fail because of issues with basic authentication.