Synthetic SFTP monitor extension
- Latest Dynatrace
- Extension
Monitor SFTP server availability and performance using synthetic checks.
Get started
Overview
This ActiveGate extension connects to a remote host and offers insights into the availability and performance of SFTP connections. The gathered data is transmitted to Dynatrace as a third-party synthetic test, enabling comprehensive analysis of outages and performance trends over time.
Use cases
- Understand connection availability and response times.
- Track directory read performance.
- Keep an eye on how fast files can be uploaded (up to 100KB).
- Monitor the performance of automated file processing in your SFTP directories.
Requirements
SFTP server configuration
| Item | Description |
|---|---|
| IP or hostname of SFTP server | The IP or hostname of the SFTP server |
| Port | The SFTP server port |
Dynatrace tenant configuration
Allows the extension to create external synthetic tests and post results to the test.
Use the local ActiveGate for synthetic test ingest. This option simplifies the extension's configuration by ingesting the synthetic events on the ActiveGate on which the extension is running.
-
URL of the Dynatrace API. Examples:
abc123.dynatrace-managed.com/e/d22e9814-d46d-4b11-8ba0-6f76708e385f,abc1234.live.dynatrace.com. -
API Token with access to create synthetic tests. Create a token with the
ExternalSyntheticIntegrationscope.
Testing configuration
Configure which tests the extension should run.
-
Test read: If enabled, the extension attempts to read the contents of the directory and record the time it takes to perform this check.
-
Test put: If enabled, the extension attempts to upload the file provided in the
Local file to uploadparameter. The extension records the amount of time it takes to perform this test. -
Test file processing: Verify that files are being processed as expected. Some SFTP servers run batch jobs or virus scans on files in SFTP directories. These processes temporarily rename files for further processing. This feature monitors files that have been renamed with a specific file suffix and ensures that their processing job is completed within a defined time frame.
-
File suffix: File suffix that indicates processing is taking place. For example,
pending. -
File age: Age in minutes that indicates a file failed to be processed.
Path configuration
Provide optional file paths to allow the extension to test SFTP read and upload.
-
Remote directory: Enter remote directory for
readandputtests. -
Local file to upload (under 100KB): Local file path. A file path on the ActiveGate that is accessible to the extension. Required for
processingtest.
Polling configuration
- Polling frequency (in minutes): Interval in which to run the extension.
Credential configuration
Credentials for the SFTP user.
-
Use Credential Vault: Optionally, store user name and password in the Credential Vault. If chosen, select the appropriate credential from the dropdown menu.
-
User name: If the Credential Vault is not used, enter user name here.
-
Password: If the Credential Vault is not used, enter password here.
Proxy configuration
-
Connect via proxy: If enabled, connect to the SFTP server via a proxy.
-
HTTP Proxy Host:Port: If you use a proxy to communicate externally, enter the
host:port. -
HTTP Proxy User: If using Basic Auth to HTTP proxy, enter the username.
-
HTTP Proxy Password: If using Basic Auth to HTTP proxy, enter the password.
Key configuration
If the connection to the SFTP server requires a security key, provide either the contents of the security key via the Credential vault or the path to the security key that is stored on the ActiveGate.
Key contents stored in the Credential vaultRecommended
Optionally, store the key file in the Credential vault.
- Create a "User and password" type credential entry.
- Choose "Extension authentication" as the scope.
- Username: Enter any placeholder value (e.g. 'unused'). A username is required by the Credential vault but is unused by the extension.
- Password: Paste the key text into the password field.
- Select the appropriate credential from the dropdown.
Path to the key file on the ActiveGate
- Store the security key on the ActiveGate in a location accessible by the extension.
- Provide the full path to the key on the ActiveGate.
Debug logging
Enable detailed logging on the host running the extension.
By default, logs are found on Linux hosts at /var/log/dynatrace/oneagent/extensions/datasources and on Windows hosts at C:\ProgramData\dynatrace\oneagent\log\extensions\datasources.
Activation and setup
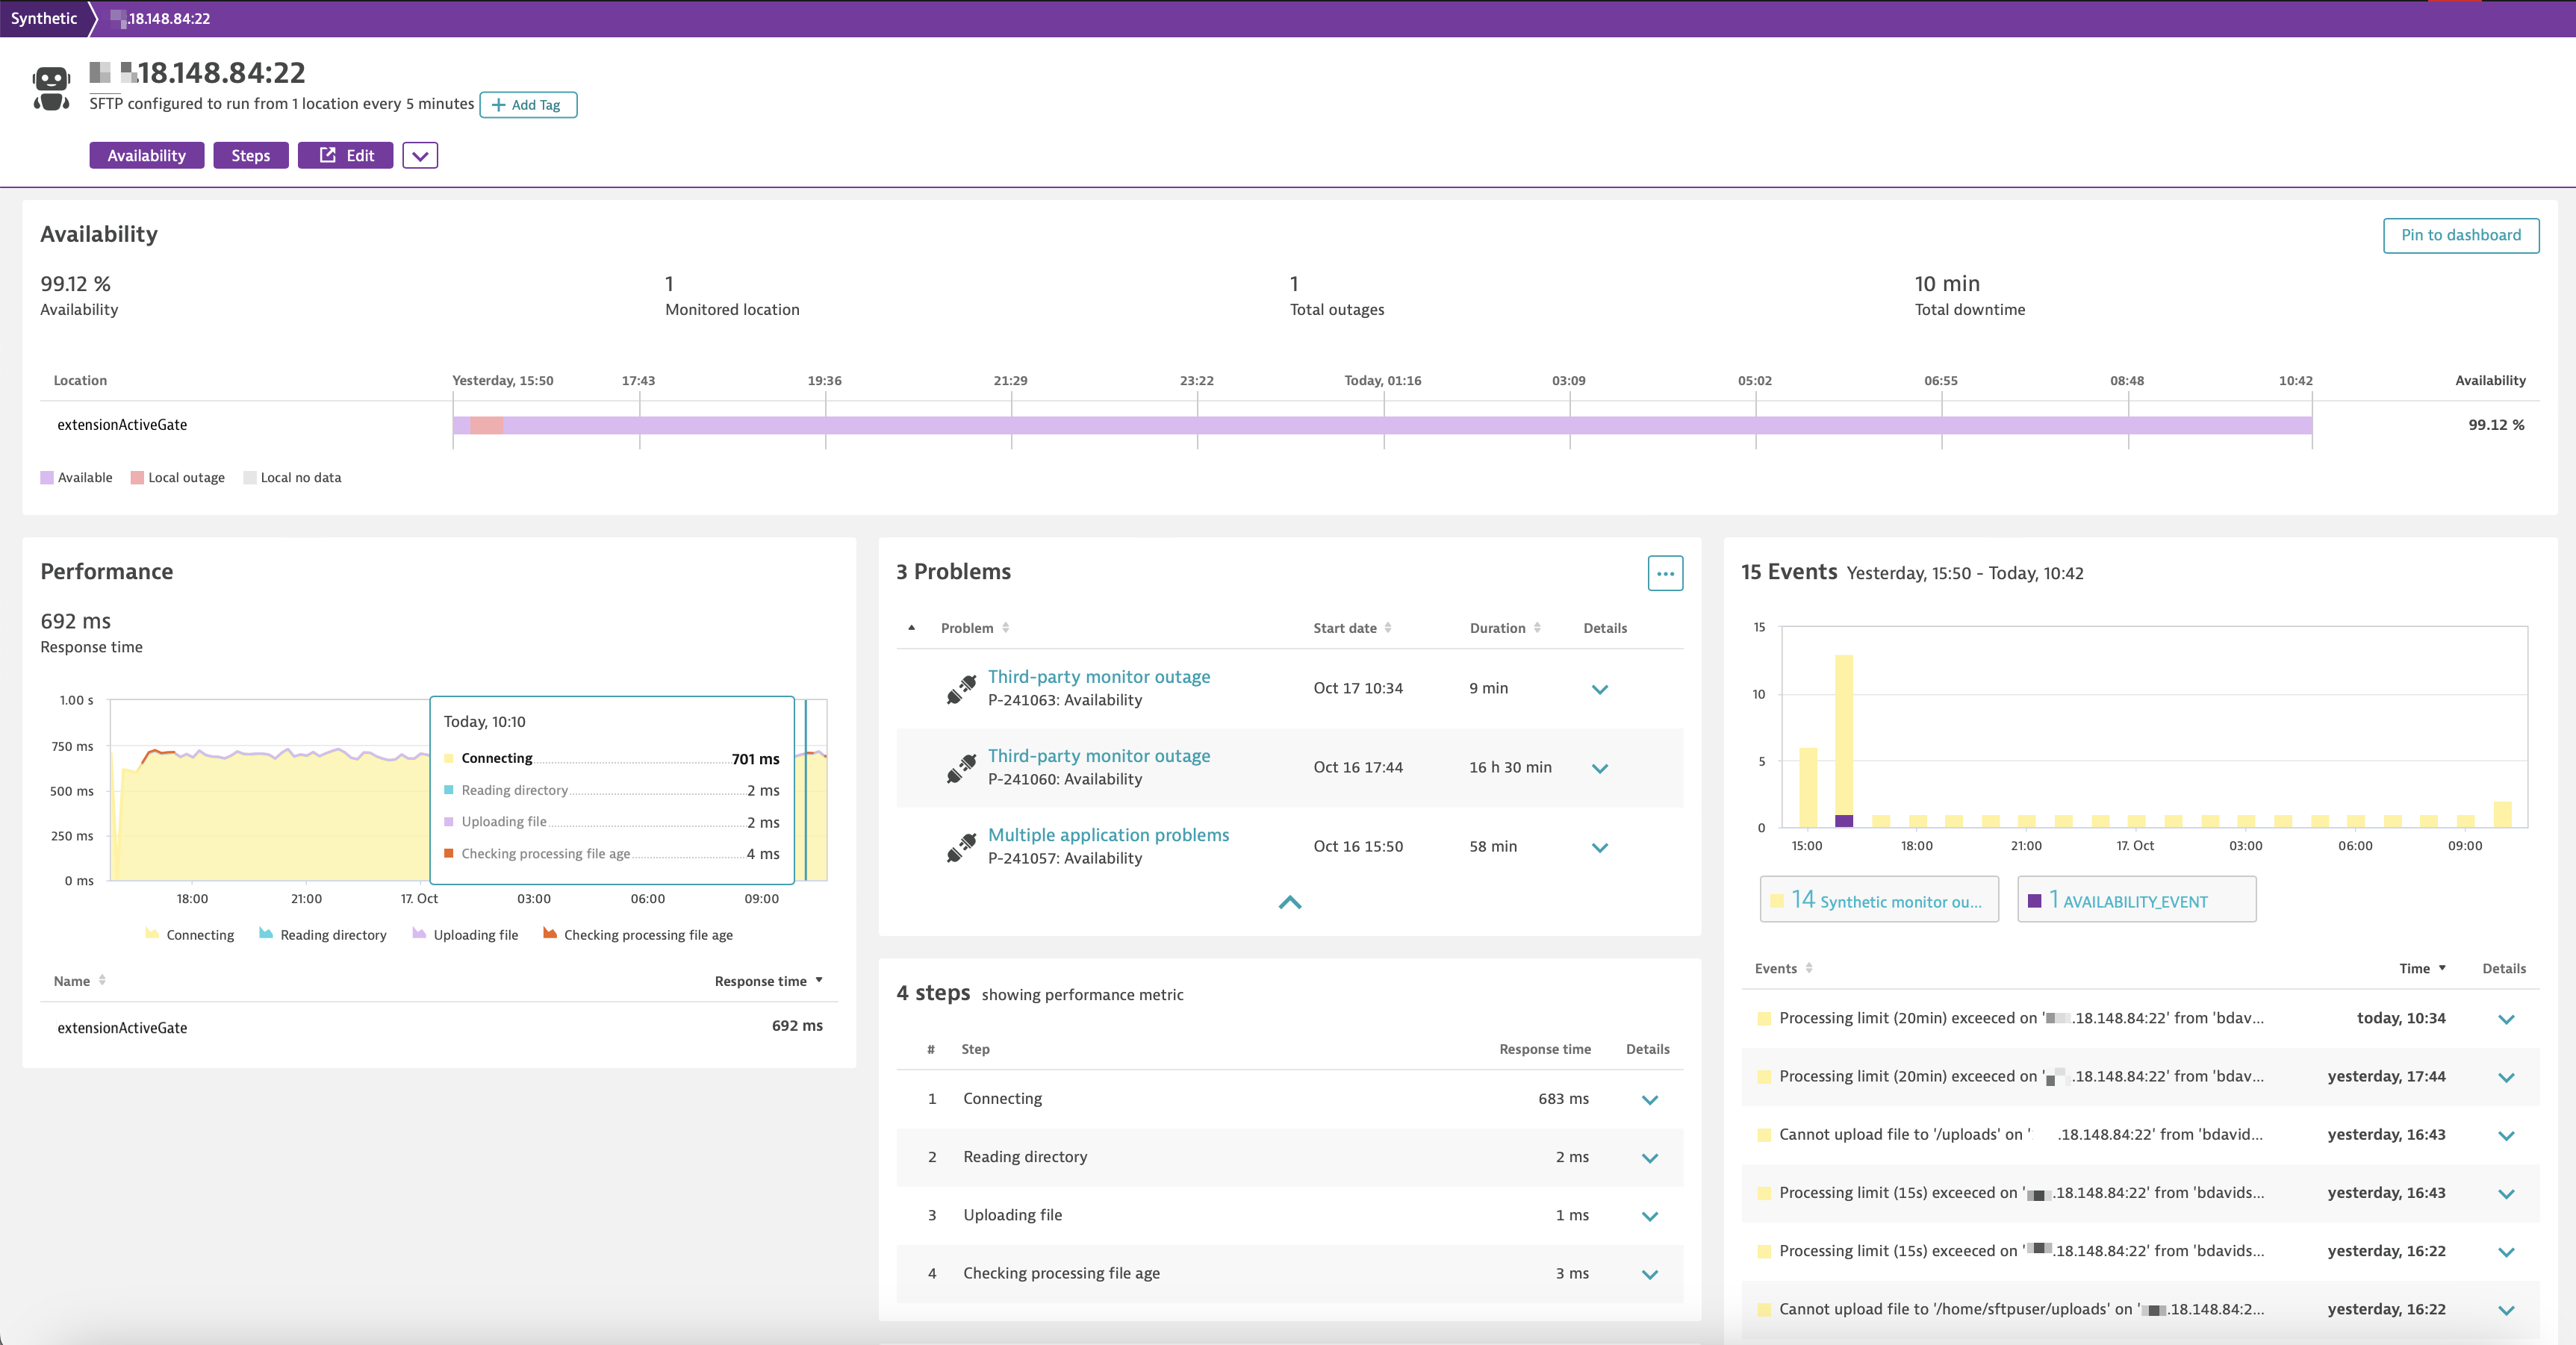
Once the extension is successfully running, you can explore tests from the Synthetic menu. These are automatically created using the endpoint's hostname and port.
Dynatrace automatically signals outages, and in-depth metrics are available, as for other synthetic tests. These can be found easily by typing synthetic.external in the Metrics menu.
Feature sets
When activating your extension using a monitoring configuration, you can limit monitoring to one of the feature sets. To work properly, the extension has to collect at least one metric after the activation.
In highly segmented networks, feature sets can reflect the segments of your environment. Then, when you create a monitoring configuration, you can select a feature set and a corresponding ActiveGate group that can connect to this particular segment.
All metrics that aren't categorized into any feature set are considered to be the default and are always reported.
A metric inherits the feature set of a subgroup, which in turn inherits the feature set of a group. Also, the feature set defined on the metric level overrides the feature set defined on the subgroup level, which in turn overrides the feature set defined on the group level.
default
| Metric name | Metric key | Description |
|---|
