SAP HANA database monitoring
This extension documentation is now deprecated and will no longer be updated. We recommend using the new SAP HANA Database extension for improved functionality and support.
Learn how to monitor your SAP HANA database using the SAP HANA database ActiveGate extension.
Starting with Dynatrace OneAgent and ActiveGate version 1.231, we are upgrading the Extension Framework (also referred to as the plugins framework) from Python 3.6 to Python 3.8.
- Consequences: Some Dynatrace extensions running in your environment may stop working and require redeployment of a new version prepared for Python 3.8.
- Symptoms:
- No data is provided for affected metrics on dashboards, alerts, and custom device pages populated by the affected extension metrics.
- Extension logs display errors. Most often this will manifest itself as Python
ModuleNotFoundErrorin the PluginAgent log. - Sometimes the Python virtual machine crashes.
- Impact: This issue affects only those extensions that use native libraries called from Python code distributed with the extension.
For remediation details, see Dynatrace Extensions.
Prerequisites
- Environment ActiveGate with remote access to the SAP HANA database server
- A SAP HANA database user with the
PUBLICandMONITORINGroles - SAP hdbcli Python library present on the ActiveGate host (see configuration instructions below)
OneAgent on HANA host
You can optionally install OneAgent on a HANA host to get additional infrastructure data related to disk space and networking, as well as host crash and availability monitoring. However, OneAgent installed on a HANA host may interfere with database updates if it has automatic process injection enabled (default). If you decide to have OneAgent installed on your HANA host, make sure you disable process auto-injection.
Disable auto-injection at installation time
To install OneAgent with the parameters to enable Infrastructure Monitoring mode and disable process injection, run the command below:
/bin/sh Dynatrace-OneAgent-Linux-<version>.sh --set-monitoring-mode=infra-only --set-auto-injection-enabled=false
Disable auto-injection after OneAgent installation
To disable auto-injection after OneAgent is installed
- Open a terminal on your HANA host.
- Run the
oneagentctlcommand-line tool with the following parameters to enable Infrastructure Monitoring mode and disable process injection. The command will also restart the OneAgent service to automatically apply your changes.
./oneagentctl --set-monitoring-mode=infra-only --set-auto-injection-enabled=false --restart-service
For more information, see OneAgent configuration via command-line interface
Dynatrace web UI
- Go to Hosts or Hosts Classic (latest Dynatrace).
- Find your HANA host and select it.
- Select More (…) > Settings > Monitoring.
- Turn off Full-stack monitoring and Auto-injection.
Extension installation
To install the SAP HANA database extension
-
In Dynatrace Hub, select SAP HANA Database.
-
Select Download to get the extension ZIP file. Don't rename the file.
-
Unzip the ZIP file to the
plugin_deploymentdirectory of your ActiveGate host. -
Download the SAP hdbcli python wheel file for your ActiveGate's operating system.
- For ActiveGate version 1.230 and earlier, use the closest Python 3 version (cp3x) that is at or below version 3.6.
- For ActiveGate version 1.231+, use the closest version of the library (cp3x) that is at or below version 3.8.
If there is no cp38 version of the
.whlfile for your OS, use the version that is closest to either cp36 or cp38, depending on your ActiveGate version. -
Rename the file extension from
.whlto.zip. -
Unzip the contents of the file into
plugin_deployment/<EXTENSION-SPECIFIC-DIRECTORY>.
The resulting file structure should look like this:plugin_deployment- <EXTENSION-SPECIFIC-DIRECTORY>- all files from unzipping extension ZIP file- hdbcli- __init__.py- dbapi.py- resultrow.py- hdbcli-<VERSION>.dist-info- pyhdbcli.abi3.so/pyhdbcli.pyd -
In Dynatrace, go to Settings > Monitoring > Monitored technologies.
-
Select Add new technology monitoring > Add ActiveGate extension.
-
Select Upload extension and upload the extension ZIP file.
-
After you upload the extension, go to Settings > Monitoring > Monitored technologies and switch to the Custom extensions tab.
-
Find the extension and select it to open it for Endpoint configuration.
-
Enter the endpoint information.
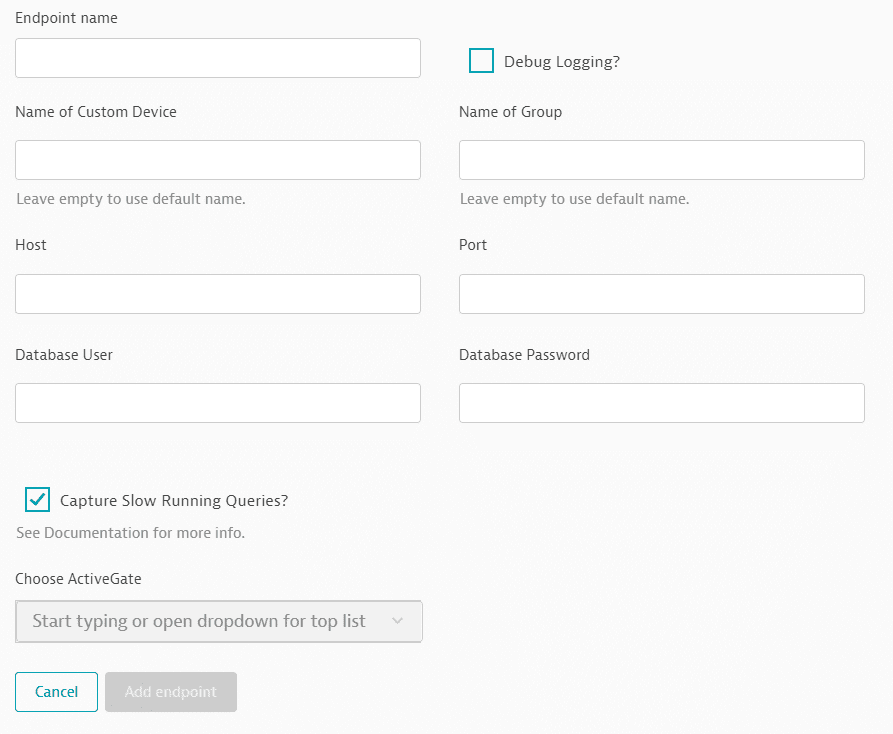
Setting
Details
Endpoint name
Enter a meaningful endpoint name.
Debug logging?
Select this only if a Dynatrace product expert requests it to investigate an issue.
Name of custom device
optional The default device name is
<Host> - <Database Name>.Name of group
optional Enter a custom group name for the new entity to be created. The default group name is
SAP HANADB.Host
The DNS or IP address that the database resides on.
Port
The default port is
3<Instance Number>15or3<Instance Number>40-42.Database user
The user name of a SAP HANA database user with the
PUBLICandMONITORINGroles.Database password
The password of a SAP HANA database user with the
PUBLICandMONITORINGroles.Capture slow-running queries
SAP HANA Database extension version 1.004+ Some metrics require queries that can take longer than the extension timeout. This allows specific endpoints to not capture these metrics.1 Default is to capture these metrics.
Choose ActiveGate
Type or select an ActiveGate.
1Currently, the only metric that would not be captured is
Heap - Temporary Memory Used. See the Additional Information in the SAP HANA Documentation for more information about the view this metric uses.
Metrics
Available metrics are listed below.
License
TRUE, FALSE, EXPIRING_SOON (License Expires in less than 15 days)Infrastructure
RUNNING statusMemory
Replication
DISABLED, ENABLED, ACTIVEERRORSYNC, SYNCMEM, ASYNC, UNKNOWNINITIALIZING, SYNCING, ACTIVE, ERROR, UNKNOWNUNKNOWNBackups
FAILED stateServices
NO, YES, UNKNOWN, STARTING, STOPPINGSavepoints
SQL statements
Transactions
INACTIVEAUTO or CRITICALINACTIVE or RUNNING