Extended network monitoring
- Dynatrace Classic
- How-to guide
- 5-min read
Extend network monitoring with network traffic metrics in containerized Linux hosts.
With network metrics added to your containerized hosts, Davis® root cause analysis will leverage them and extend analysis to provide visibility into network-related issues. Extensive network traffic on particular nodes is a sign that you should consider scaling up the cluster.
NetTracer
NetTracer is an open source tool for tracing TCP events and collecting network connection metrics on Linux. It consists of two parts:
- BPF program used for collecting data
- Binary that presents the data in a structured or semi-structured format
Advantages:
- It can trace TCP events: connect, accept, and close
- It can collect metrics about each traced connection
- It's a high performance application (written in C and C++)
- It's independent from kernel version and configuration (Linux kernel 4.15 and higher)
- It's an open source project (NetTracer)
NetTracer defines an IPv4 and IPv6 TCP connection by source address and port, destination address and port, PID of the communicating process, and network namespace.
Using this TCP connection definition, it collects the following metrics:
- Bytes sent
- Bytes received
- Packets sent
- Packets received
- Packets retransmitted
- Round-Trip Time (in microseconds)
- Round-Trip Time variance (not used in Dynatrace analysis)
By default, NetTracer is included as the binary oneagentnettracer with every OneAgent installation, and it can be enabled via the Dynatrace web UI.
NetTracer supported platforms
NetTracer officially supports Linux kernel versions 4.15 and higher, but other Dynatrace components that coexist with NetTracer on a particular host have specific requirements and are supported on particular Linux distributions. The following table lists the tested and safest Linux distributions to use when planning to use NetTracer with Dynatrace.
| Distribution | Architecture | Release |
|---|---|---|
RedHat Enterprise Linux | x86_64 | 8.0 and higher |
CentOS | x86_64 | 8.0 and higher |
Ubuntu | x86_64 | 18.04 LTS and higher |
Enable NetTracer
When enabled, OneAgent will use NetTracer to collect network data from containers, but only for Linux hosts.
To enable NetTracer on a specific Linux host
- Go to
 Hosts Classic and select your Linux host.
 - On the host overview page, select More (…) > Settings in the upper-right corner of the page.
- On the Host settings page, select NetTracer traffic and turn on Enable NetTracer traffic network monitoring.
To enable NetTracer globally on all your Linux hosts
- Go to Settings > Network & Discovery > NetTracer traffic.
- Turn on Enable NetTracer traffic network monitoring.
To ensure NetTracer works correctly, OneAgent must be installed in either Full-Stack or Infrastructure monitoring mode, as these modes enable the network monitoring feature. If OneAgent is installed in a limited mode (for example, Discovery monitoring mode), NetTracer may not function as intended. For more details, see OneAgent monitoring modes.
Built-in metrics for NetTracer
| Metric key | Name and description | Unit | Aggregations |
|---|---|---|---|
| builtin:tech | Bytes received Number of bytes received | Byte | autoavgcountmaxminsum |
| builtin:tech | Bytes transmitted Number of bytes transmitted | Byte | autoavgcountmaxminsum |
| builtin:tech | Retransmitted packets Number of retransmitted packets | Count | autovalue |
| builtin:tech | Packets received Number of packets received | Count | autovalue |
| builtin:tech | Packets transmitted Number of packets transmitted | Count | autovalue |
| builtin:tech | Retransmission Percentage of retransmitted packets | Percent (%) | autoavgmaxmin |
| builtin:tech | Round trip time Round trip time in milliseconds. Aggregates data from active sessions | Millisecond | autoavgcountmaxminsum |
| builtin:tech | Network traffic Summary of incoming and outgoing network traffic in bits per second | bit | autovalue |
| builtin:tech | Incoming traffic Incoming network traffic in bits per second | bit | autovalue |
| builtin:tech | Outgoing traffic Outgoing network traffic in bits per second | bit | autovalue |
Calculated metrics for NetTracer
The following metrics available for NetTracer are calculated:
-
builtin:tech.nettracer.retr_percentage(Retransmission)Retransmission = retransmitted packets / (retransmitted packets + packets transmitted) × 100
-
builtin:tech.nettracer.traffic_rx(Incoming traffic)Incoming traffic = (sum of bytes received * 8) per second
-
builtin:tech.nettracer.traffic_tx(Outgoing traffic)Outgoing traffic = (sum of bytes transmitted:sum * 8) per second
-
builtin:tech.nettracer.traffic(Network traffic)Network traffic = ((sum of bytes received + sum of bytes transmitted) * 8) per second
Dimensions for NetTracer
| Metric key | Dimension | Value | Unit |
|---|---|---|---|
|
| Gauge, where: sum = number of bytes from all sessions in the given timeframe avg/min/max = average/minimal/maximal bytes per session in the given timeframe count = number of sessions in the given timeframe | Bytes |
|
| Gauge, where: sum = number of bytes from all sessions in the given timeframe avg/min/max = average/minimal/maximal bytes per session in the given timeframe count = number of sessions in the given timeframe | Bytes |
|
| Count, sending deltas/resetting counter | Count |
|
| Count, sending deltas/resetting counter | Count |
|
| Count, sending deltas/resetting counter | Count |
|
| Gauge | Milliseconds |
Container dimensions for NetTracer
If the process is running in a container, the following dimensions are added:
dt.entity.container_group_instancedt.entity.container_group
Additional container dimensions are added depending on the deployment type.
| Kubernetes | Docker (no Kubernetes) |
|---|---|
|
|
Where can I see NetTracer data?
After it's collected, NetTracer data is available as metrics throughout Dynatrace.
-
Data Explorer: You can use the metrics in Data Explorer to create charts and dashboards that display data that interests you.
-
Process group instance page: Go to process group instance page and select Networking tab.
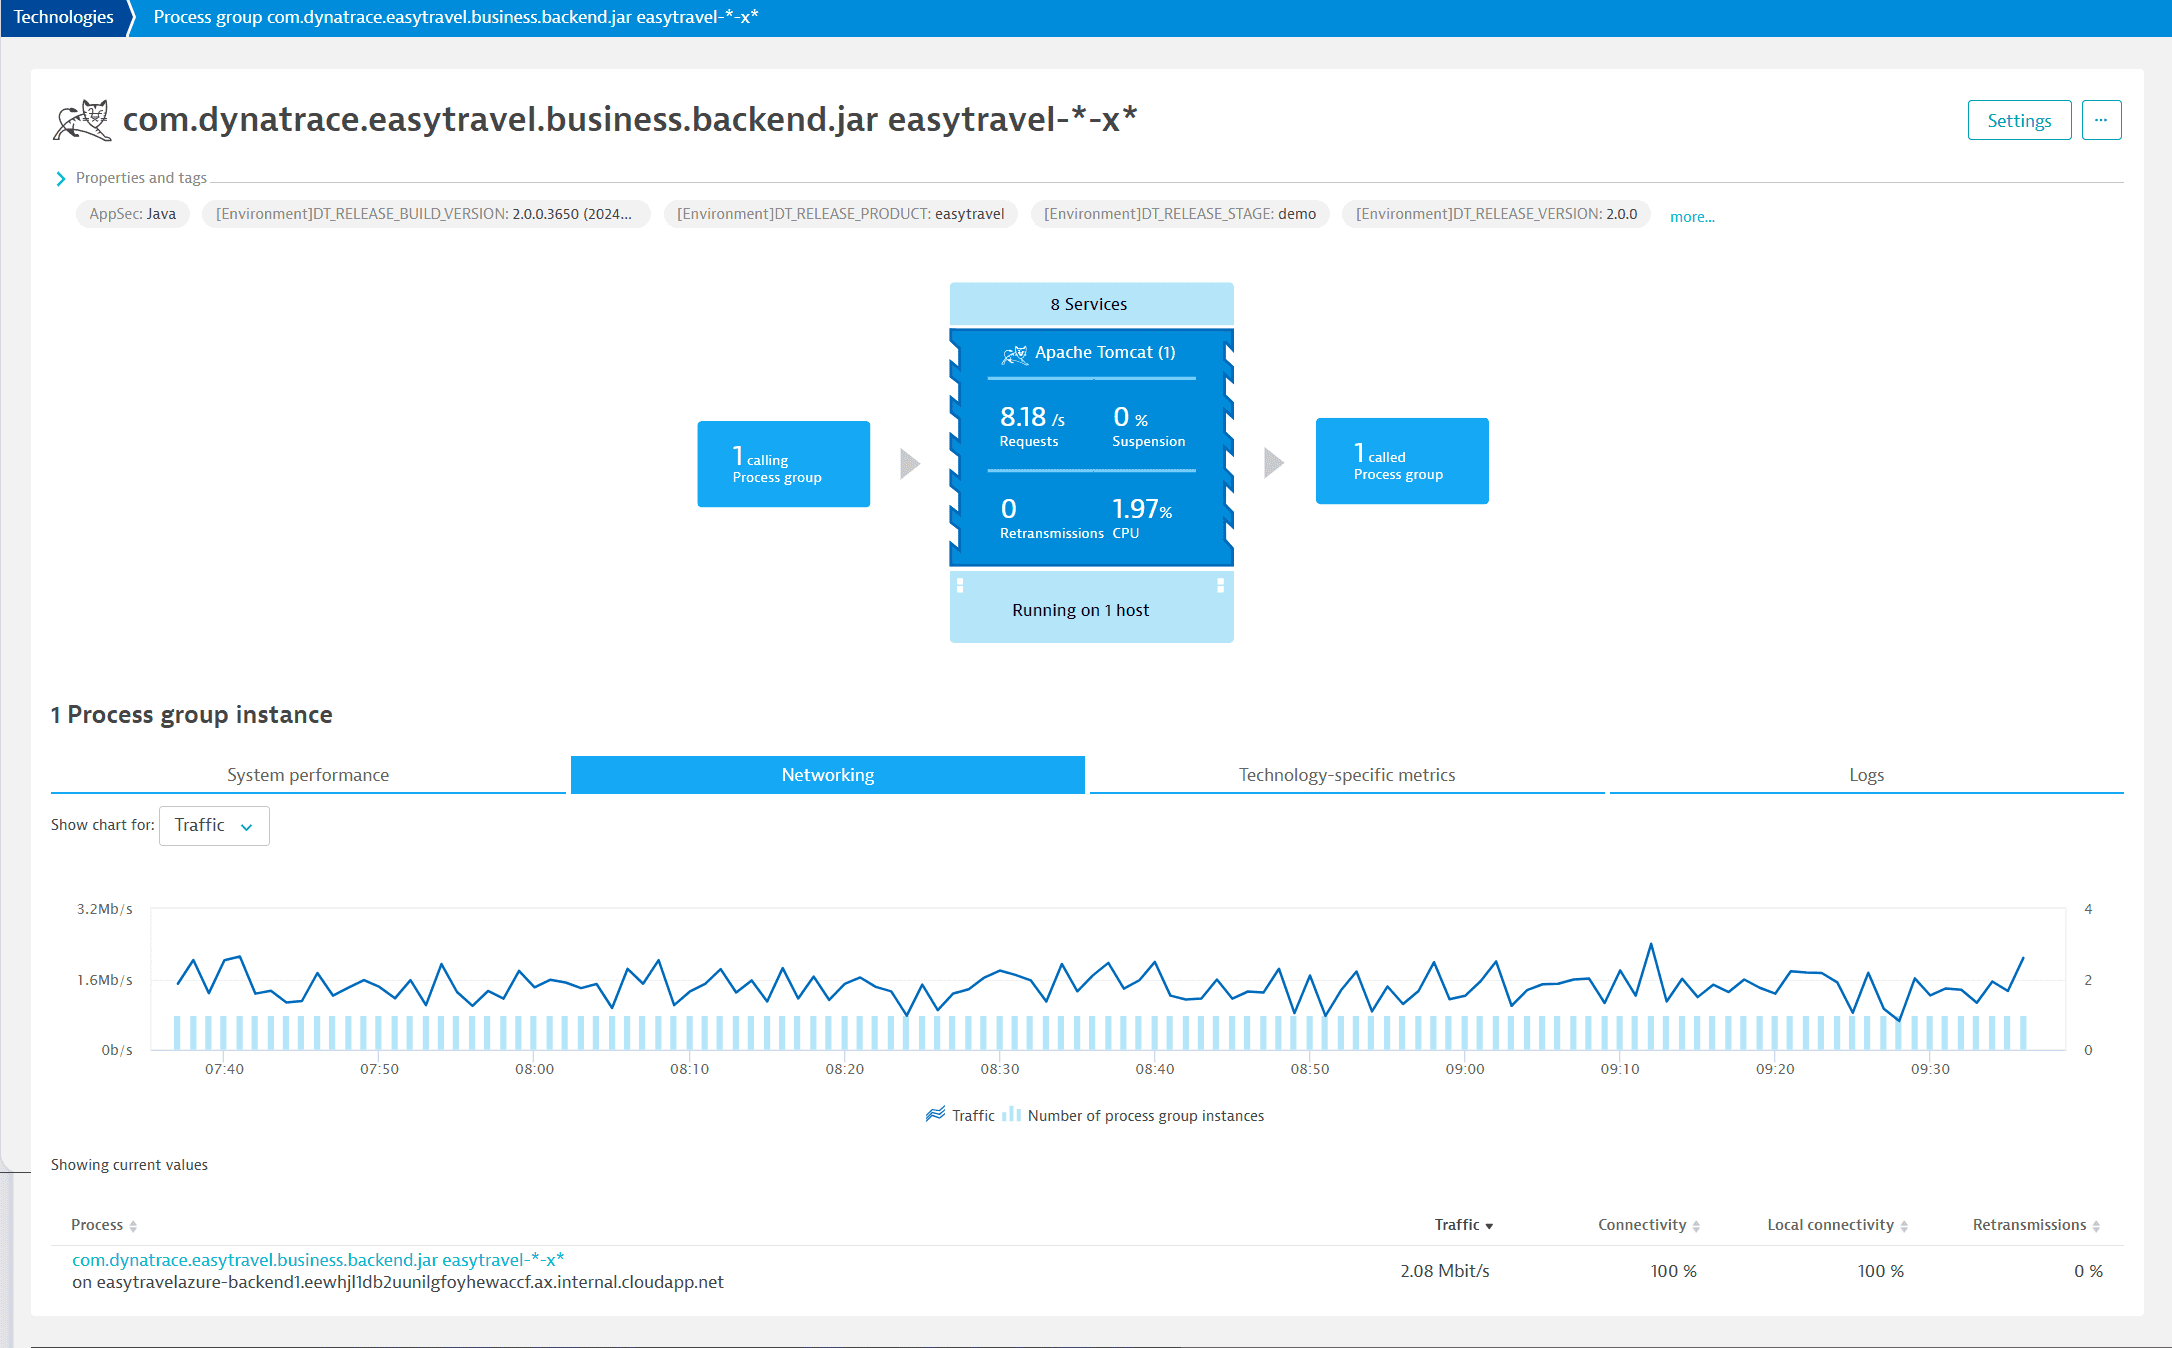 Process group instance page - Networking details
 -
Host overview: Go to host overview page and scroll down to the Network analysis section.
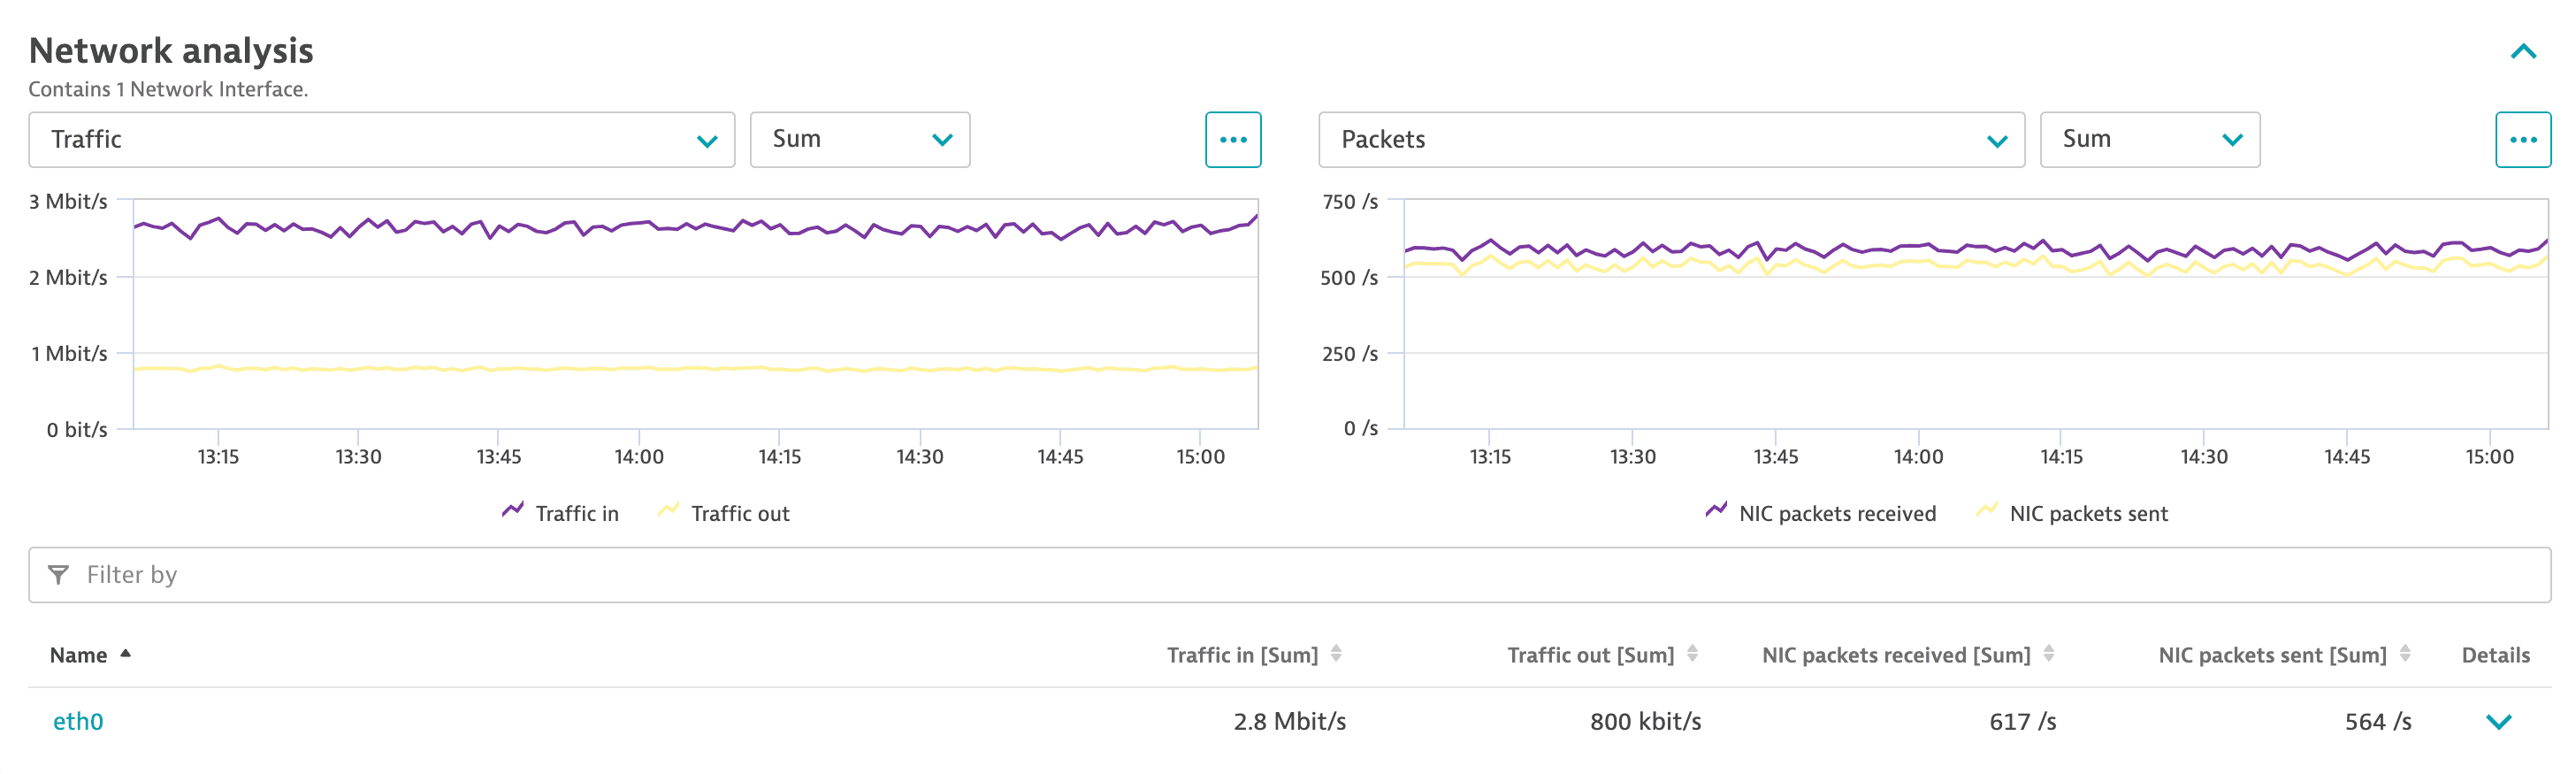 Network analysis
Networking and Network analysis sections contain NetTracer data combined with other network data analysed for this host. NetTracer gathers data for containerized processes, meanwhile Network Agent for native (i.e., non-containerized) processes.
NetTracer characteristics
- Only 4096 TCP connections are tracked from the NetTracer
ebpfmodule. - Information about listen ports requires an active TCP connection.