Browser monitor metrics in Synthetic on Grail
- Latest Dynatrace
- Reference
Metrics and dimensions
Monitor
| Metric key | Metric name | Metric description | Unit | Dimensions |
|---|---|---|---|---|
| Availability rate (by location) [Browser monitor] | The availability rate of browser monitors. | % |
|
| Execution count (by status) [Browser monitor] | The number of monitor executions. | count |
|
| Duration [Browser monitor] | Duration of browser monitor, calculated as a sum of all steps durations. | ms |
|
| Total duration (classic) [Browser monitor] | Total duration of browser monitor, measured as a sum of total durations of all steps. The metric source is the classic RUM JavaScript. | ms |
|
| User events duration [Browser monitor] | Duration of browser monitor, calculated as a sum of all steps-level user events durations. The metric source is the new RUM JavaScript. | ms |
|
| User events total duration [Browser monitor] | Total duration of browser monitor, measured as a sum of all steps-level values of | ms |
|
| User actions duration [Browser monitor] | Duration of browser monitor, calculated as a sum of all steps-level user actions durations. The metric source is the new RUM JavaScript. | ms |
|
| User actions total duration [Browser monitor] | Total duration of browser monitor, measured as a sum of all steps-level values of | ms |
|
Steps
| Metric key | Metric name | Metric description | Unit | Dimensions |
|---|---|---|---|---|
| Execution count (step) (by status) [Browser monitor] | The number of step executions. | count |
|
| Duration (step) [Browser monitor] | Duration of individual browser monitor step, measured as a sum of durations of user action events in the step. | ms |
|
| Total duration (classic) (step) [Browser monitor] | Total duration of individual browser monitor step, measured as a sum of all user actions in the step. The metric source is the classic RUM JavaScript. | ms |
|
| User events duration (step) [Browser monitor] | Duration of individual browser monitor step, measured from the start of the first user event of the step to the end of the last user event of the step. The metric source is the new RUM JavaScript. | ms |
|
| User events total duration (step) [Browser monitor] | Total duration of individual browser monitor step, measured as a sum of durations of all user events in the step. The metric source is the new RUM JavaScript. | ms |
|
| User actions duration (step) [Browser monitor] | Duration of individual browser monitor step, measured from the start of the first user action of the step to the end of the last user action of the step. The metric source is the new RUM JavaScript. | ms |
|
| User actions total duration (step) [Browser monitor] | Total duration of individual browser monitor step, measured as a sum of durations of all user actions in the step. The metric source is the new RUM JavaScript. | ms |
|
Use cases
The following use cases show how you can use the metrics in your DQL queries.
Track monitor availability
Suppose you need to identify monitors that have availability issues.
The following query uses the dt.synthetic.browser.availability metric and the dt.entity.synthetic_test dimension to return the monitors sorted by their availability, with the least available monitors listed first.
timeseries {availability_series = avg(dt.synthetic.browser.availability) },by:{ dt.entity.synthetic_test }| fieldsAdd monitor_name = entityName(dt.entity.synthetic_test)| summarize { monitor_name = takeFirst(monitor_name),availability = avg(arrayAvg(availability_series)) },by: {dt.entity.synthetic_test}| sort availability asc
The raw response looks like this:
{"records": [{"dt.entity.synthetic_test": "SYNTHETIC_TEST-06AFE815FF214729","monitor_name": "Browser monitor1","availability": 31.746031746031743},{"dt.entity.synthetic_test": "SYNTHETIC_TEST-094D2E6AA99D2252","monitor_name": "Browser monitor2","availability": 46.03174603174603},{"dt.entity.synthetic_test": "SYNTHETIC_TEST-0C362AEC36824874","monitor_name": "Browser monitor3","availability": 100},
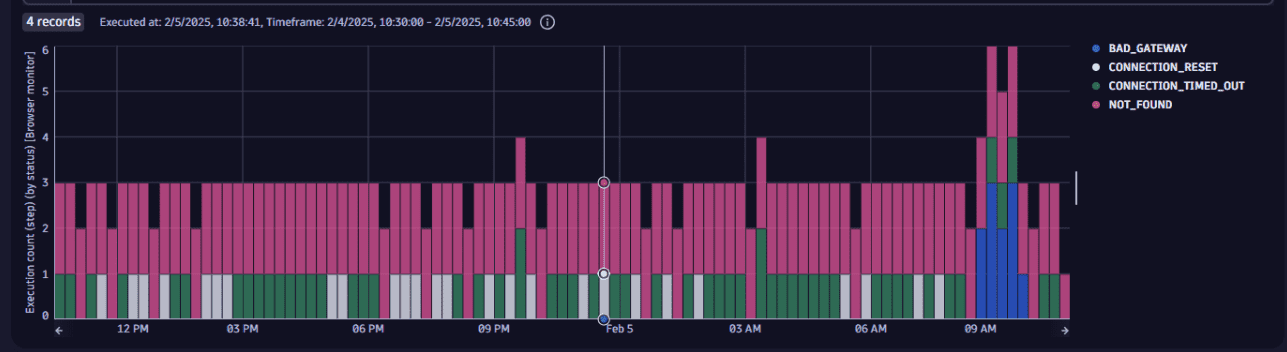
Analyze failures caused by server interactions
Suppose you need to analyze the failures of browser monitors attributed to server interactions.
The following query uses the dt.synthetic.browser.step.executions metric and the dt.entity.synthetic_test, result.status.message, and result.status.code dimensions.
timeseries {execution_series = sum(dt.synthetic.browser.step.executions)}, by:{ result.status.message,result.status.code,dt.entity.synthetic_test},interval: 15m| filter result.status.code != 0| filter (result.status.code < 1000 and result.status.code >= 400) or in(result.status.code, array(10054, 12014, 12183))| summarize { dt.synthetic.monitor_ids = collectArray(dt.entity.synthetic_test),execution_number = sum(arraySum(execution_series)),executions = sum(execution_series[]) },by:{timeframe, interval, result.status.message, result.status.code}
The visualized response looks like this:
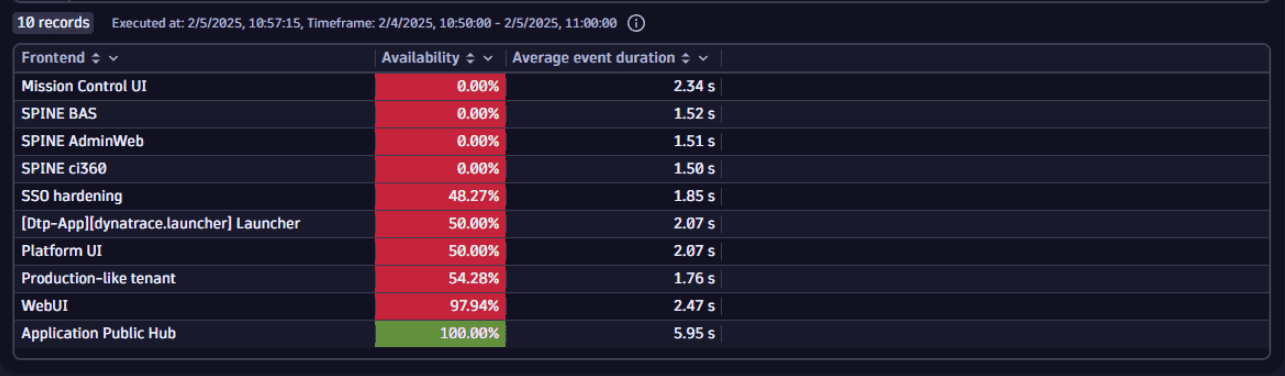
Evaluate the frontend availability and performance
Suppose you need to evaluate frontend availability and performance.
The following query uses the dt.synthetic.browser.availability, dt.synthetic.browser.step.duration, and dt.synthetic.browser.executions metrics together with the dt.synthetic.monitored_entity_ids dimension.
timeseries {availability_series = avg(dt.synthetic.browser.availability),performance_series = avg(dt.synthetic.browser.step.duration),},by:{ dt.synthetic.monitored_entity_ids }| expand entity = dt.synthetic.monitored_entity_ids| filter isNotNull(entity)| fieldsAdd entity_name = entityName(entity, type:"dt.entity.application")| fieldsAdd frontend_name = coalesce(entity_name, entity)| summarize { frontend_name = takeLast(frontend_name),availability = avg(arrayAvg(availability_series)),performance = avg(arrayAvg(performance_series))}, by: {dt.entity.application = entity}| sort availability asc, performance desc| limit 10| fieldsRename `Frontend` = frontend_name,`Availability` = availability,`Average event duration` = performance
In the example visualized response, you can see the breakdown of availability and an average event duration time for 10 frontend applications, sorted by availability with the lowest on the top.