IBM DB2 for LUW (remote monitoring) extension
- Latest Dynatrace
- Extension
Remotely collect monitoring metrics from your DB2 databases.
Get started
Dynatrace provides you with a framework that you can use to extend your application observability into data acquired directly from your IBM Database layer, so that you can monitor how database server tasks impact your app.
Requirements
- Designate an ActiveGate group or groups that will remotely connect to your IBM Database server to pull data. All ActiveGates in each group must connect to your IBM DB2 database.
- Create a dedicated database user in your database instance with necessary permissions. Dynatrace uses this user to run monitoring queries against your IBM DB2 database.
-
Permissions for DB2 user
The DB2 user used by the extension must have read access to monitoring table functions and administrative views:
- EXECUTE privilege on the monitoring table functions:
MON_GET_DATABASEMON_GET_INSTANCEMON_GET_TRANSACTION_LOGMON_GET_TABLESPACEMON_GET_CONNECTIONMON_GET_HADRMON_GET_BUFFERPOOLENV_GET_SYSTEM_RESOURCES
- SELECT privilege on the following administrative views:
ENV_INST_INFOMON_CURRENT_SQL
As an alternative to the above least-privilege approach, any of the following authorities will provide the required access:
- DATAACCESS authority
- DBADM authority
- SQLADM authority
As part of the connection process of the SQL datasource, the user must also have the privilege to perform the SELECT operation on the
SYSIBM.SYSDUMMY1catalog table.If the database was created with the
RESTRICTIVEoption, you'll also need to provide the user with theUSAGEprivilege on an enabled workload. For details, see Grant usage privilege on a workload. - EXECUTE privilege on the monitoring table functions:
-
Compatibility information
All IBM-supported versions of IBM DB2 for Linux, UNIX, and Windows (LUW) running on AIX, HP-UX, Linux, Solaris, or Windows are supported. DB2 for IBM i is not supported.
Refer to the IBM documentation for details on DB2 end-of-support dates.
Activation and setup
Follow these steps to configure your device for IBM DB2 database monitoring. You can add a monitoring configuration for every DB2 instance you'd like to monitor.
Add DB instance
-
Go to Dynatrace Hub
 .
. -
Select and install IBM DB2 extension. This enables the extension in your monitoring environment.
- Required permission: Change monitoring settings
-
Select Add DB Instance in the
 Databases. This opens the Add DB Instance wizard.
 -
Select IBM DB2 section in the wizard.
Select hosting type
Select a hosting type from the options. This choice determines which script generates the necessary database objects later in the process.
- From the Add DB Instance wizard, select the host type that matches your requirement.
- Select Next.
Select ActiveGate group
- Select the ActiveGate group to determine which ActiveGates will run the extension.
- Select Next step.
Create a connection
Set up the connection to your database instance.
- Name the connection, so you can identify it later.
- Add the details in the Configure connection section.
- Select connection. Select either a connection from an existing host or set up manually the host address and port.
- Select Add IBM DB2 endpoint to define the servers from which you want to pull data. You can define up to 100 endpoints. Provide the following connection details:
- Host
- Port
- Database name
- Provide the Authenticate credentials directly or use secure alternatives.
- Basic credentials: With basic authentication, authentication details passed to Dynatrace when activating monitoring configuration are masked to prevent them from being retrieved.
- Credential vault: Use vault credentials to securely store and retrieve database credentials.
- Optionally, enable SSL to establish a secure connection for your configuration, including truststore setup.
- Select Next.
Install instance
- Add manual configurations based on the monitoring requirements.
- Select Create DB instance monitoring.
Instance alias
Starting with version 2.2.0, you can assign an alias to each DB2 endpoint. The alias becomes part of the DB2 instance name and all its child entities. It can be used to provide entities with a more meaningful or shorter name. When added to an existing configuration, the alias is applied automatically, and no reconfiguration is required.
Details
Logs ingested
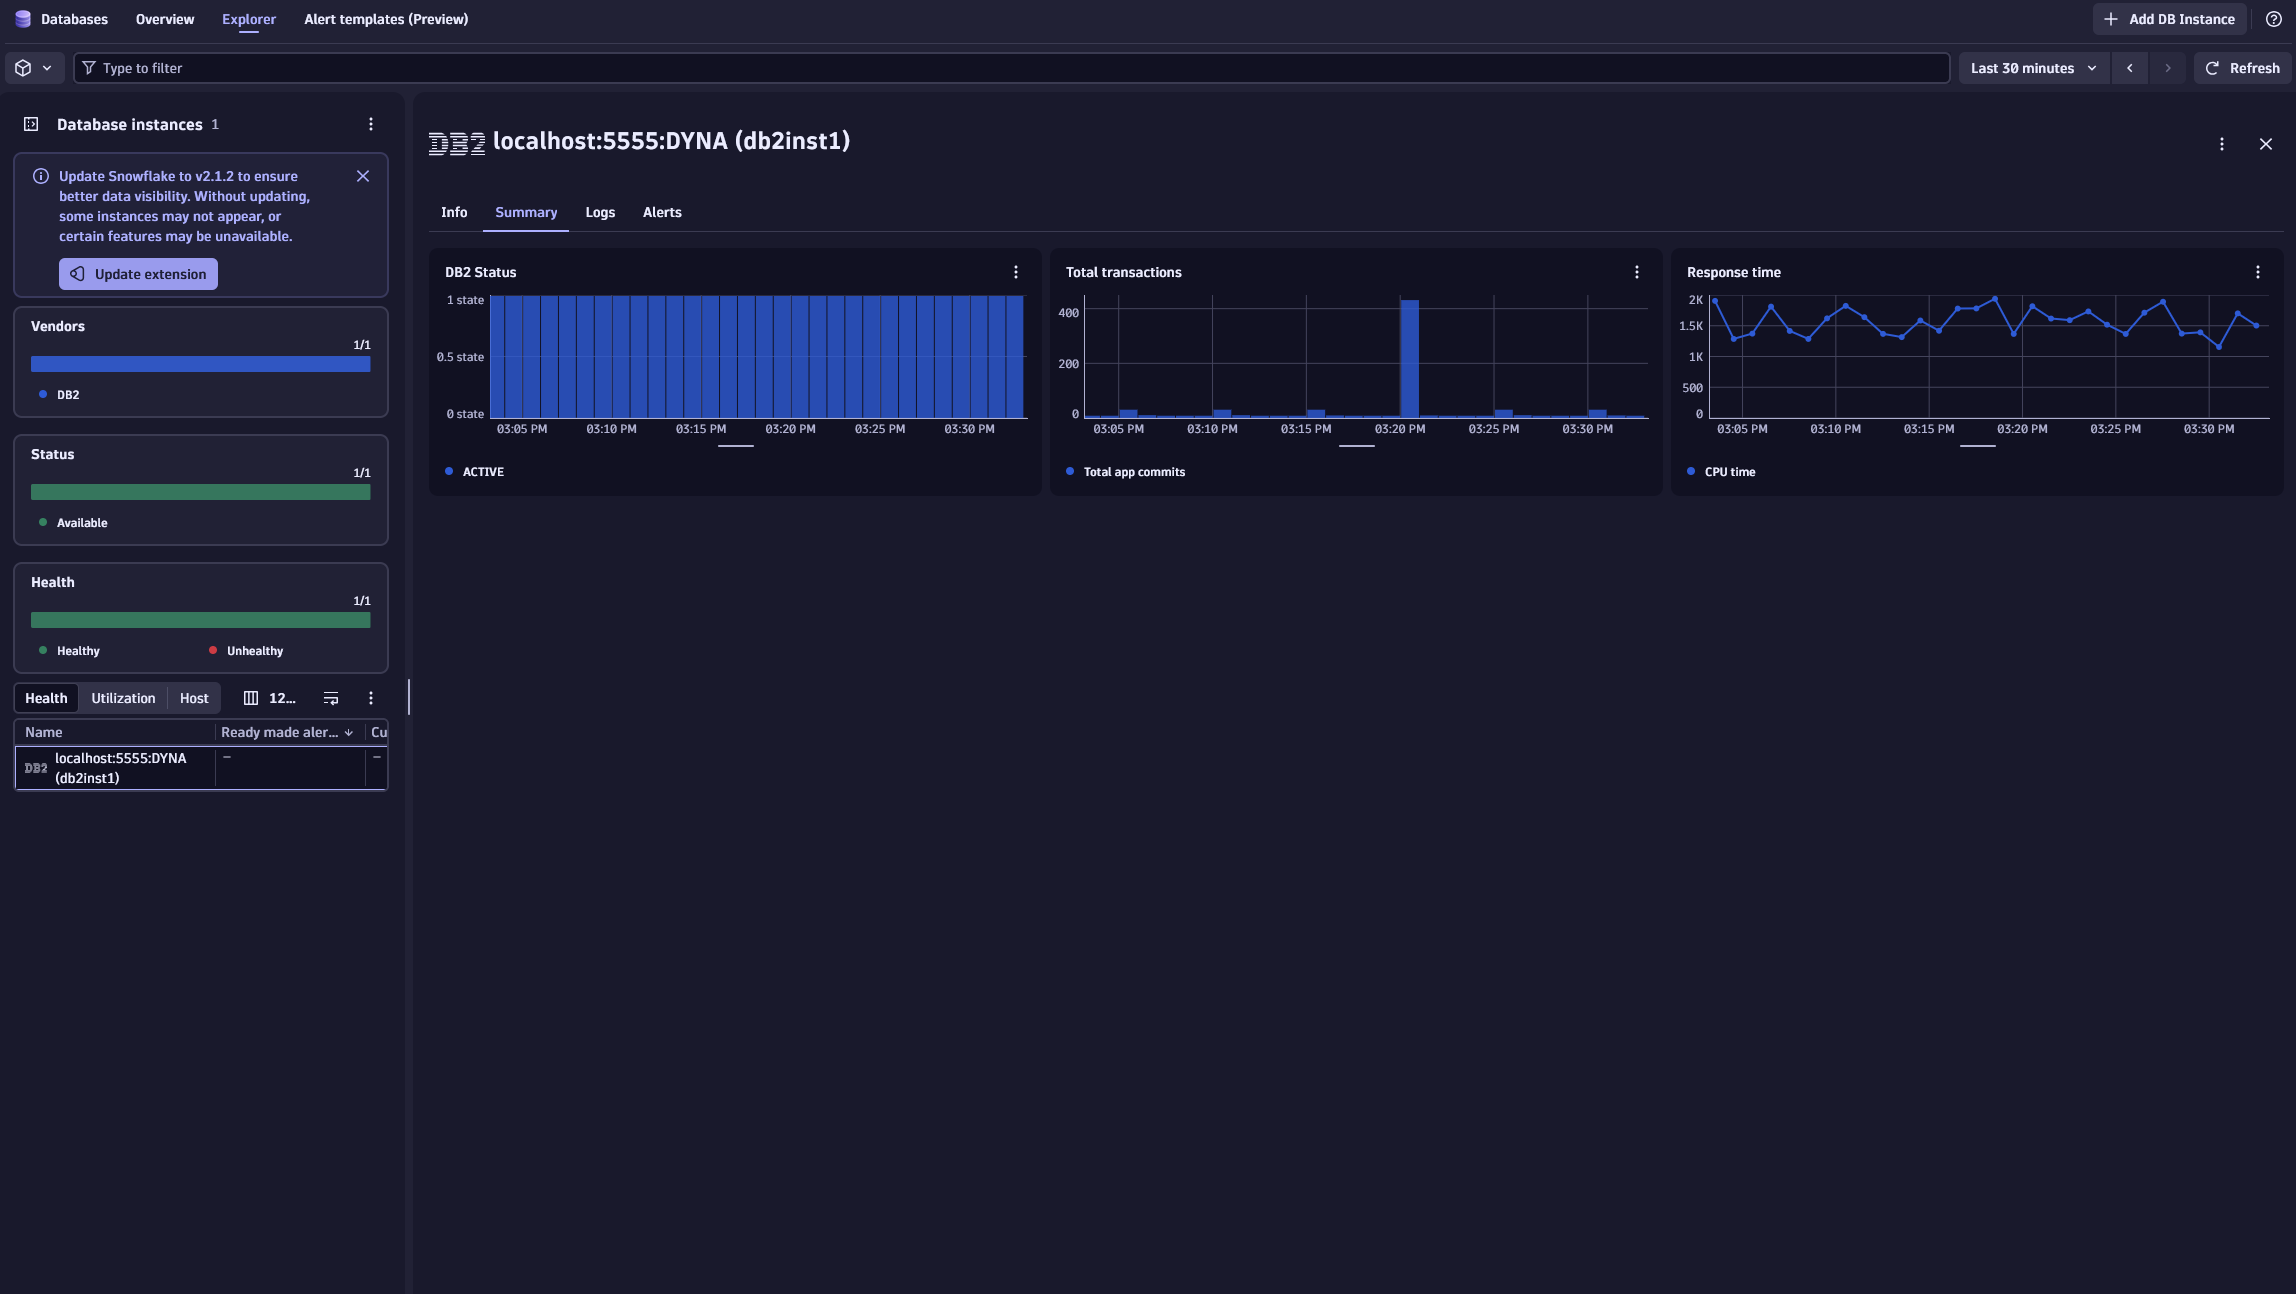
If you enable the top_current_sql feature set, a query to the MON_CURRENT_SQL view will be made once every 5 minutes, and the top 50 currently executing statements (based on elapsed time) will be ingested as log records. This query captures only statements that are executing at the time it runs, allowing you to identify long-running queries in your databases. The resulting logs are associated with the DB2 Database Instance entity.
As this can result in significant log ingestion, it should be used with caution.
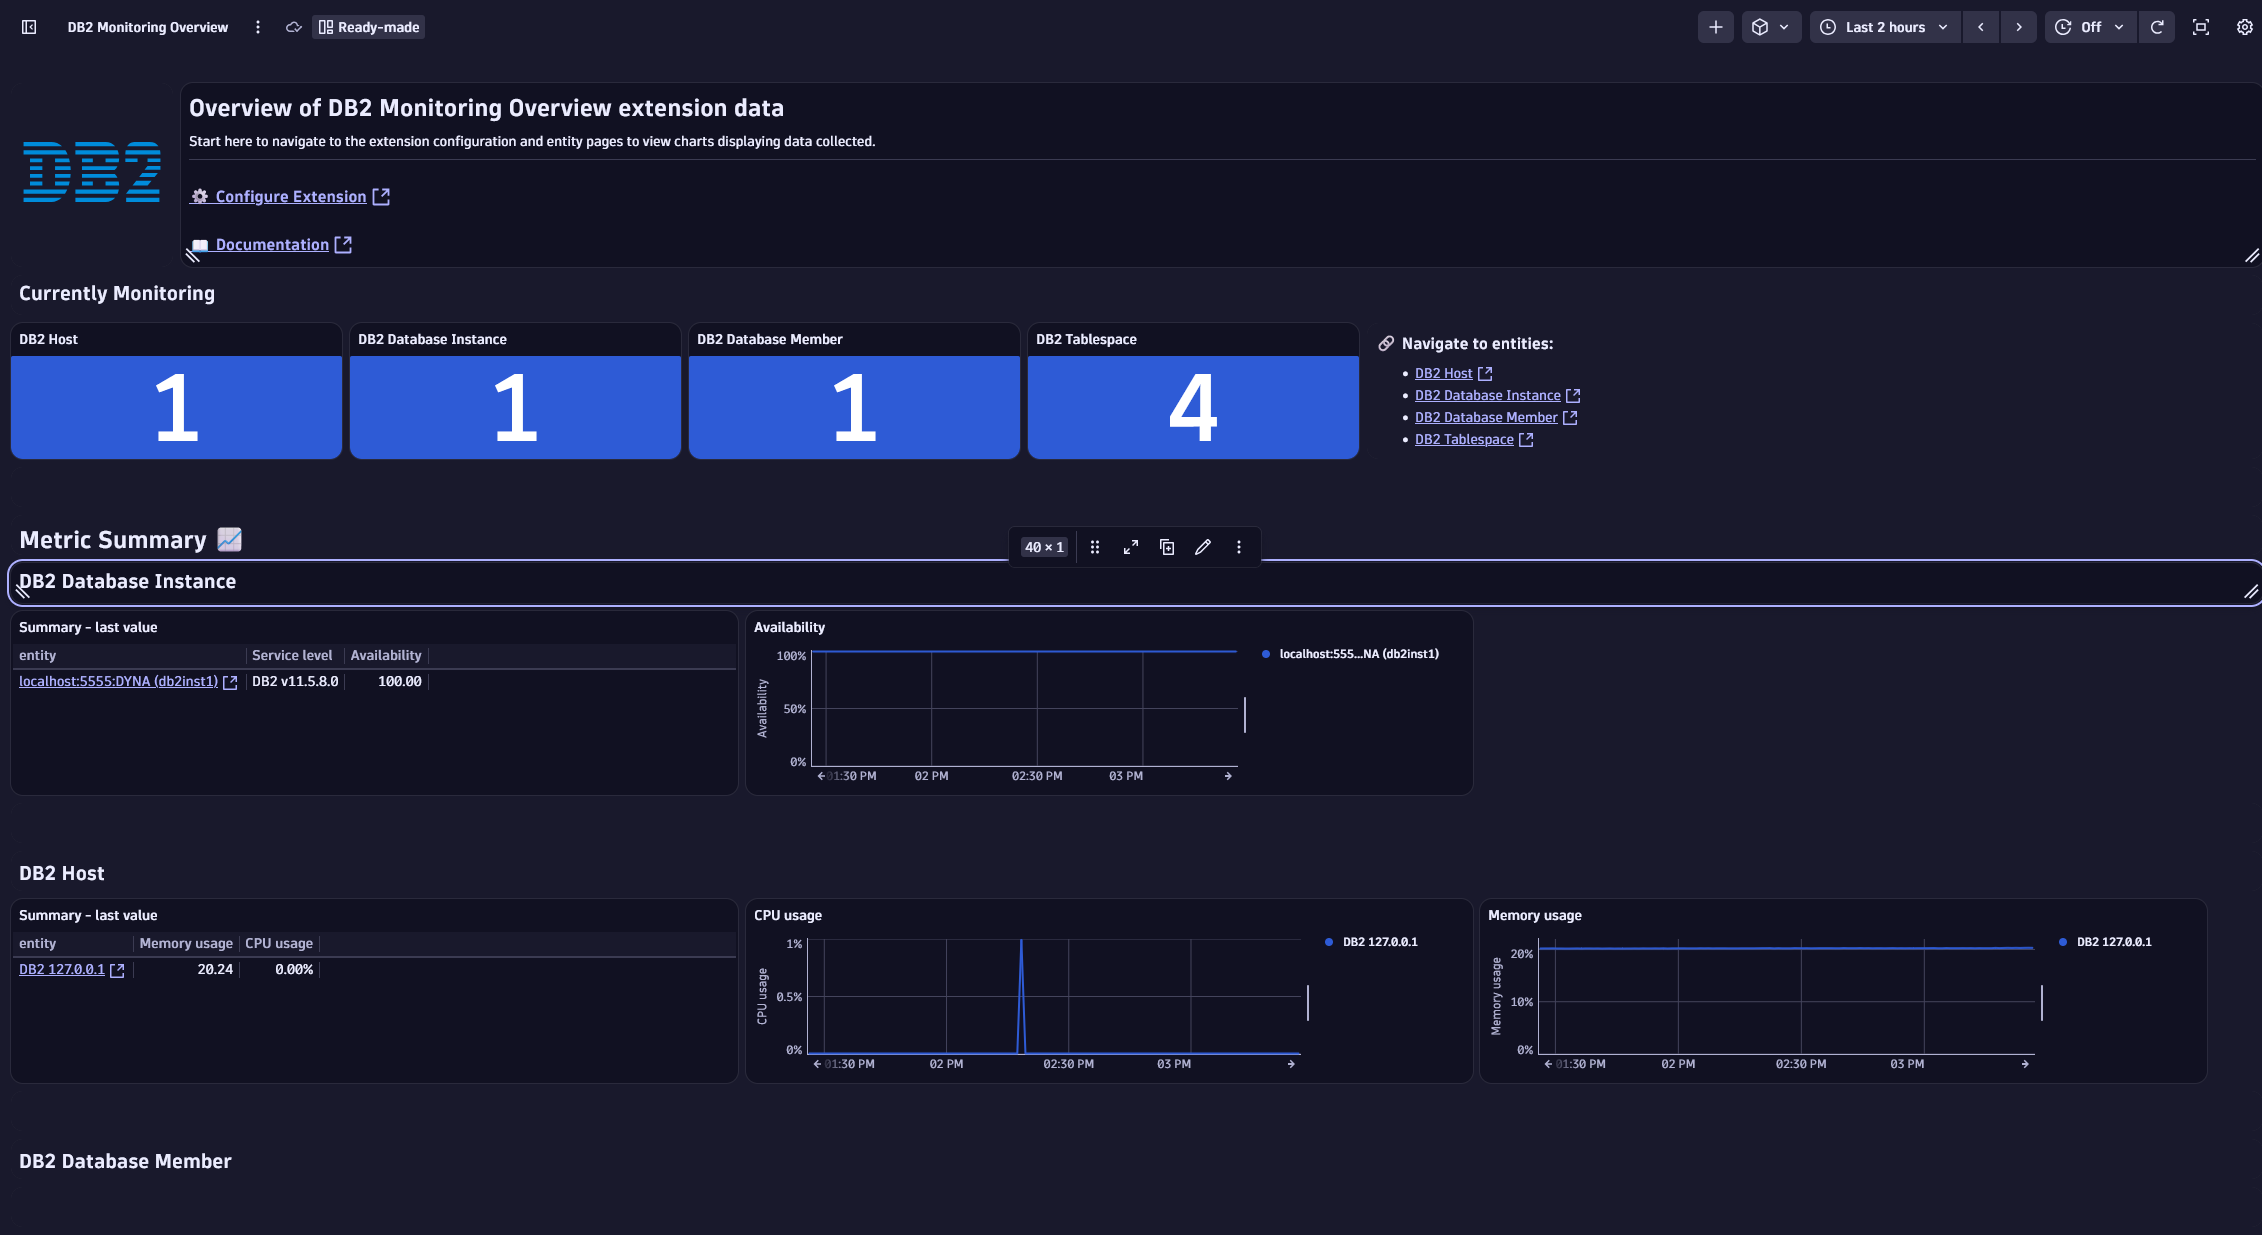
Metrics collected
Review the feature set details to see which metrics are collected.
Calculated metrics
Calculated metrics (prefixed with func:) are calculated on the Dynatrace cluster side based on the metrics collected through the extension. Some calculated metrics require metrics from certain feature sets. If you don't have all feature sets enabled, you may encounter errors when attempting to chart them.
- func:db2.app_transactions (database) - Number of application transactions executed. Commits and rollbacks.
- func:db2.table_reads_per_returned_rows_ratio (database) - Cache usage during transaction reads.
- func:db2.lock_wait_per_transaction_ratio (database) - Lock wait time per transaction.
- func:db2.lock_fails_per_transaction_ratio (database) - Lock fails (deadlocks and lock timeouts) per transaction.
- func:db2.log_flush_time_per_transaction_ratio (database, transaction_log) - The time an agent waits for log records to be flushed to disk.
- func:db2.pool_index_page_hits (database) - Index pages usage.
- func:db2.pool_data_page_hits (database) - Data pages usage.
- func:db2.pool_xda_page_hits (database) - XML storage object (XDA) pages usage.
- func:db2.pool_physical_reads_per_transaction_ratio (database) - Pool physical reads per transaction.
- func:db2.pool_physical_writes_per_transaction_ratio (database) - Pool physical writes per transaction.
- func:db2.pool_dirty_steal_triggers_per_transaction_ratio (database) - Number of ‘dirty steal’ triggers per transaction.
- func:db2.sorts_per_transaction_ratio (database) - The number of sort operations per transaction.
- func:db2.all_transactions.count (database) - All transactions, including internally initiated commits and rollbacks.
- func:db2.response_time (database) - CPU and wait time divided by commits and rollbacks.
- func:db2.tbsp_page_utilization (tablespace) - Percentage of tablespace in use by tablespace.
- func:db2.total_log_utilization (transaction_log) - Percentage of transaction log space used.
- func:db2.bp.overall_hit_ratio - Percentage of buffer pool reads that did not require loading a page from disk.
- func:db2.bp.sync_writes_percent - Percentage of buffer pool writes that were synchronous.
- func:db2.bp.avg_physical_read_time - Average time taken for physical read operations.
Metric event
One metric event for alerting configuration is included: 'DB2 - Instance Unavailable'. After you activate the extension, go to Settings > Anomaly detection > Metric events and enable it to have availability events created on the database instance entity if no data is collected for 3 out of 5 minute intervals.
Licensing and costs
There is no charge to use the extension. You are only charged for the data that the extension ingests.
The IBM DB2 for LUW (remote monitoring) extension ingests custom metrics, which consume Davis Data Units (DDUs) (Dynatrace classic license) or Metrics powered by Grail (DPS), according to your license model.
The following formula provides the number of metric data points per minute, assuming all feature sets are enabled.
10 + (49 * members) + (4 * member tablespaces) + (5 * member buffer pools)
If you use the top_current_sql feature set, you can ingest up to 50 log records per monitored instance every 5 minutes. Exact values will depend on currently executing queries at the time the extension runs.
Dynatrace Platform Subscription
In the Dynatrace Platform Subscription, metric ingestion consumes Metrics powered by Grail according to the number of ingested metric data points.
To calculate the approximate yearly consumption, apply the following calculation: <metric data points per minute> * 60 minutes * 24 hours * 365 days.
For logs, regular consumption applies. See Log Analytics.
Dynatrace classic license
In the classic licensing model, metric ingestion consumes Davis Data Units (DDUs) at the rate of .001 DDUs per metric data point. Multiply the above formula for annual data points by .001 to estimate annual DDU usage.
For logs, regular DDU consumption applies. See DDU consumption for Log Management and Analytics or DDUs for Log Monitoring Classic.
The DDU cost above does not include any possible log events or custom events that are triggered by the extension. For more information, see DDU events.
Feature sets
When activating your extension using a monitoring configuration, you can limit monitoring to one of the feature sets. To work properly, the extension has to collect at least one metric after the activation.
In highly segmented networks, feature sets can reflect the segments of your environment. Then, when you create a monitoring configuration, you can select a feature set and a corresponding ActiveGate group that can connect to this particular segment.
All metrics that aren't categorized into any feature set are considered to be the default and are always reported.
A metric inherits the feature set of a subgroup, which in turn inherits the feature set of a group. Also, the feature set defined on the metric level overrides the feature set defined on the subgroup level, which in turn overrides the feature set defined on the group level.
default
| Metric name | Metric key | Description |
|---|---|---|
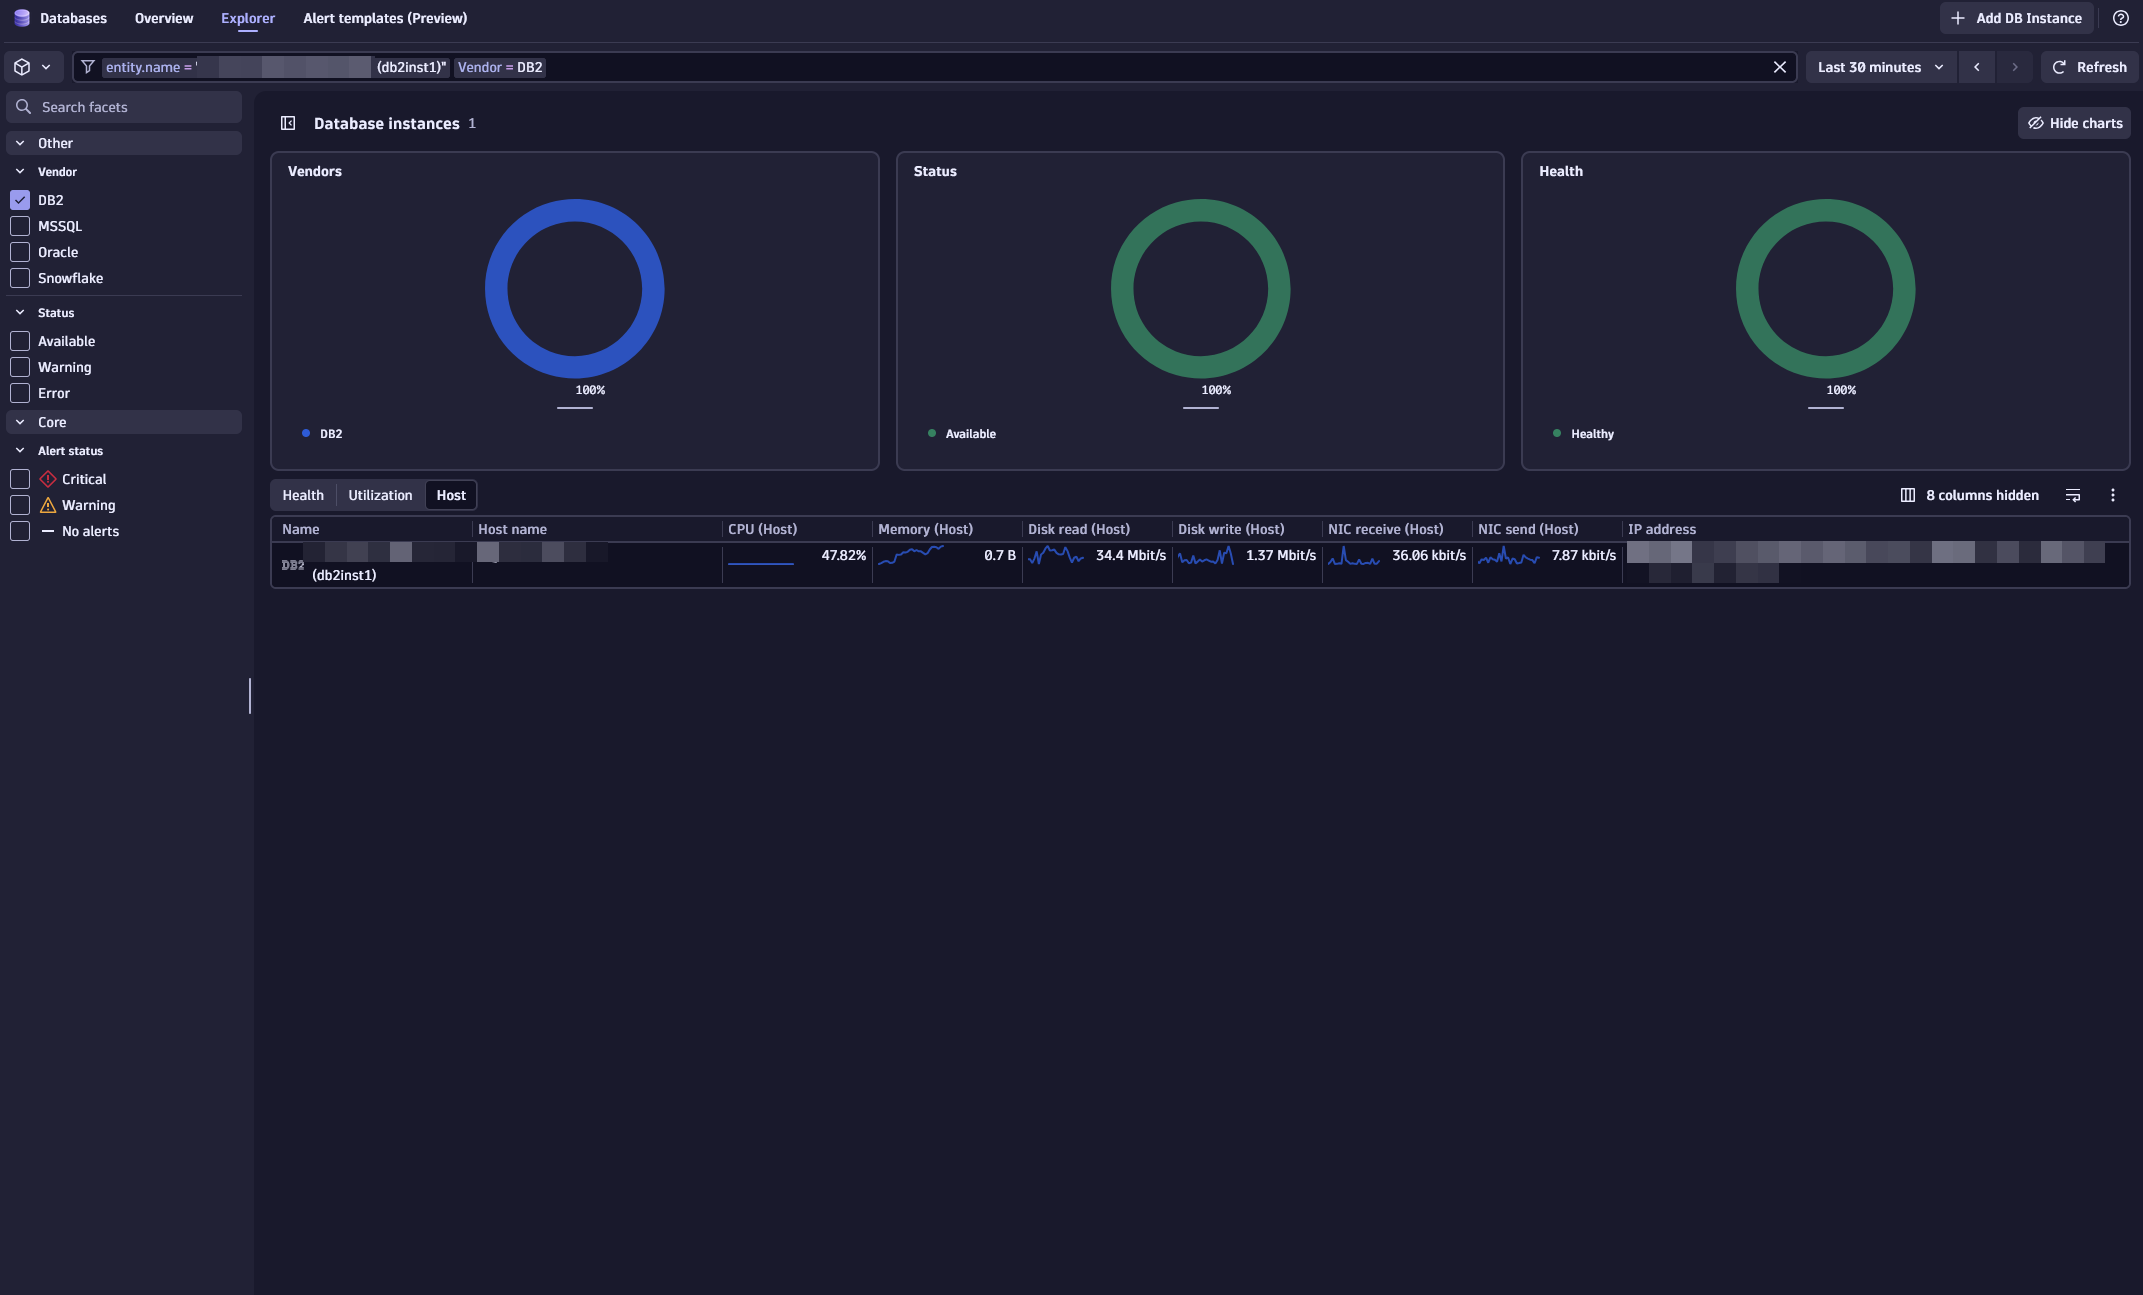
| Availability | db2.availability | Availability based on ability of extension to connect to DB2 instance (100% reported on success, no data on failure). |
| CPU usage | db2.cpu_usage_total | The overall processor usage on this host including kernel processing time, expressed as a percentage. |
| Memory free | db2.memory_free | The total amount of physical memory on this host that is not allocated to a running process. |
| Memory total | db2.memory_total | The total amount of physical memory on this host. |
| Memory usage | db2.memory_usage | The total amount of physical memory on this host allocated to a running process as a percentage. |
| Database manager instance status | db2.db2_status | The current status of the instance of the database manager. |
| Member status | db2.db_status | The current status of the database member. |
connections
| Metric name | Metric key | Description |
|---|---|---|
| Active connections | db2.active_connections | Current active connections to database. |
transactionLog
| Metric name | Metric key | Description |
|---|---|---|
| Log write time | db2.log_write_time.count | The total elapsed time spent by the logger writing log data to the disk. |
| Transaction log used | db2.total_log_used | The total amount of active log space currently used in the database. |
| Transaction log available | db2.total_log_available | The amount of active log space in the database that is not being used by uncommitted transactions. |
| In doubt transactions | db2.num_indoubt_transactions | The number of outstanding indoubt transactions in the database. |
hadr
| Metric name | Metric key | Description |
|---|---|---|
| HADR connect status | db2.hadr_connect_status | The current high availability disaster recovery (HADR) connection status of the database. |
| HADR state | db2.hadr_state | The current high availability disaster recovery (HADR) state of the database. |
| HADR log gap | db2.hadr_log_gap | The recent average of the gap between the PRIMARY_LOG_POS value and STANDBY_LOG_POS value (how far the standby is behind the primary). |
| Standby tablespace error | db2.hadr_standby_tablespace_error | Reports 1 if HADR_FLAGS indicate the standby database has a tablespace in an invalid error state. If this state occurs during a database upgrade and if the problem is not resolved before the upgrade completes, the table spaces that are in error will not be recoverable. |
tablespace
| Metric name | Metric key | Description |
|---|---|---|
| Tablespace total pages | db2.tbsp_total_pages | Total number of pages in a table space. |
| Tablespace used pages | db2.tbsp_used_pages | The total number of pages that are currently used (not free) in a table space. |
| Tablespace size | db2.tbsp_size | Total size of the table space in bytes, calculated from total pages multiplied by page size. |
| Tablespace state | db2.tbsp_state | The current state of a table space. |
bufferPools
| Metric name | Metric key | Description |
|---|---|---|
| Buffer pool total logical reads | db2.bp.total_logical_reads.count | The total number of pages requested from the buffer pool (logical reads) across all page types. |
| Buffer pool total physical reads | db2.bp.total_physical_reads.count | The total number of pages physically read from disk across all page types. |
| Buffer pool total writes | db2.bp.total_writes.count | The total number of pages written to disk across all page types. |
| Buffer pool total asynchronous writes | db2.bp.total_async_writes.count | The total number of pages written asynchronously to disk. |
| Buffer pool read time | db2.bp.pool_read_time.count | The total elapsed time spent reading data from the buffer pool to disk. |
topCurrentSql
| Metric name | Metric key | Description |
|---|
database
| Metric name | Metric key | Description |
|---|---|---|
| Apps currently connected | db2.appl_cur_cons | Indicates the number of applications that are currently connected to the database. |
| Dynamic SQL statements | db2.dynamic_sql_stmts.count | The number of dynamic SQL statements that were attempted. |
| Failed SQL statements | db2.failed_sql_stmts.count | The number of SQL statements that were attempted, but failed. |
| Total app commits | db2.total_app_commits.count | Total number of commit statements issued by the client application. |
| Internal commits | db2.int_commits.count | The total number of commits initiated internally by the database manager. |
| App rollbacks | db2.total_app_rollbacks.count | Total number of rollback statements issued by the client application. |
| Internal rollbacks | db2.int_rollbacks.count | The total number of rollbacks initiated internally by the database manager. |
| CPU time | db2.total_cpu_time.count | The total amount of CPU time used while within the database system. Represents total of both user and system CPU time. |
| Wait time | db2.total_wait_time.count | The total time spent waiting within the database server. |
| Request time | db2.total_rqst_time.count | The total amount of time spent working on requests. |
| Rows returned | db2.rows_returned.count | The number of rows that have been selected and returned to the application. |
| Rows read | db2.rows_read.count | The number of rows read from the tables. |
| Rows updated | db2.rows_updated.count | This is the number of row updates attempted. |
| Rows deleted | db2.rows_deleted.count | This is the number of row deletions attempted. |
| Rows inserted | db2.rows_inserted.count | The number of row insertions attempted. |
| Lock wait time | db2.lock_wait_time.count | The total elapsed time spent waiting for locks. |
| Deadlocks | db2.deadlocks.count | The total number of deadlocks that have occurred. |
| Lock timeouts | db2.lock_timeouts.count | The number of times that a request to lock an object timed out instead of being granted. |
| Buffer pool data writes | db2.pool_data_writes.count | The number of times a buffer pool data page was physically written to disk. |
| Buffer pool index writes | db2.pool_index_writes.count | Indicates the number of times a buffer pool index page was physically written to disk. |
| Buffer pool XDA writes | db2.pool_xda_writes.count | Indicates the number of times a buffer pool data page for an XML storage object (XDA) was physically written to disk. |
| Local buffer pool index pages found | db2.pool_index_lbp_pages_found.count | Indicates the number of index pages which have been synchronously read by agents and asynchronously read by prefetchers from the local buffer pool (logical) for regular and large table spaces. |
| Async local buffer pool index pages found | db2.pool_async_index_lbp_pages_found.count | The number of times an index page was present in the local buffer pool when a prefetcher attempted to access it. |
| Buffer pool index logical reads | db2.pool_index_l_reads.count | Indicates the number of index pages which have been synchronously read by agents from the buffer pool (logical) for regular and large table spaces. |
| Buffer pool temp index logical reads | db2.pool_temp_index_l_reads.count | Indicates the number of index pages which have been requested from the buffer pool (logical) for temporary table spaces. |
| Local buffer pool data pages found | db2.pool_data_lbp_pages_found.count | Indicates the number of data pages which have been synchronously read by agents and asynchronously read by prefetchers from the local buffer pool (logical) for regular and large table spaces. |
| Async local buffer pool data pages found | db2.pool_async_data_lbp_pages_found.count | The number of times a data page was present in the local buffer pool when a prefetcher attempted to access it. |
| Buffer pool data logical reads | db2.pool_data_l_reads.count | Indicates the number of data pages which have been synchronously read by agents from the buffer pool (logical) for regular and large table spaces. |
| Buffer pool temp data logical reads | db2.pool_temp_data_l_reads.count | Indicates the number of data pages which have been requested from the buffer pool (logical) for temporary table spaces. |
| Local buffer pool XDA pages found | db2.pool_xda_lbp_pages_found.count | Indicates the number of data pages for an XML storage object (XDA) which have been synchronously read by agents and asynchronously read by prefetchers from the local buffer pool (logical) for regular and large table spaces. |
| Async local buffer pool XDA pages found | db2.pool_async_xda_lbp_pages_found.count | The number of times a data page for an XML storage object (XDA) was requested by a prefetcher from and found in the local buffer pool. |
| Buffer pool XDA logical reads | db2.pool_xda_l_reads.count | Indicates the number of data pages for XML storage objects (XDAs) which have been synchronously read by agents from the buffer pool (logical) for regular and large table spaces. |
| Buffer pool temp XDA logical reads | db2.pool_temp_xda_l_reads.count | Indicates the number of pages for XML storage object (XDA) data which have been requested from the buffer pool (logical) for temporary table spaces. |
| Buffer pool data physical reads | db2.pool_data_p_reads.count | Indicates the number of data pages which have been synchronously read by agents and asynchronously read by prefetchers from the table space containers (physical) for regular and large table spaces. |
| Buffer pool index physical reads | db2.pool_index_p_reads.count | Indicates the number of index pages which have been synchronously read by agents and asynchronously read by prefetchers from the table space containers (physical) for regular and large table spaces. |
| Buffer pool XDA physical reads | db2.pool_xda_p_reads.count | Indicates the number of data pages for XML storage objects (XDAs) which have been synchronously read by agents and asynchronously read by prefetchers from the table space containers (physical) for regular and large table spaces. |
| Buffer pool temp data physical reads | db2.pool_temp_data_p_reads.count | Indicates the number of data pages read in from the table space containers (physical) for temporary table spaces. |
| Buffer pool temp index physical reads | db2.pool_temp_index_p_reads.count | Indicates the number of index pages read in from the table space containers (physical) for temporary table spaces. |
| Buffer pool temp XDA physical reads | db2.pool_temp_xda_p_reads.count | Indicates the number of pages for XML storage object (XDA) data read in from the table space containers (physical) for temporary table spaces. |
| Buffer pool victim page cleaners triggered | db2.pool_drty_pg_steal_clns.count | The number of times a page cleaner was invoked because a synchronous write was needed during the victim buffer replacement for the database. |
| Total sorts | db2.total_sorts.count | The total number of sorts that have been executed. |
| Time since backup | db2.time_since_backup | Time since last backup was completed |
| Backup time | db2.backup_time.count | The elapsed time that was spent doing online backups |
| Online backups | db2.total_backups | Total number of online backups |
FAQ
What if I need to connect using SSL?
The DB2 data source supports SSL connections as of ActiveGate version 1.269. Monitoring configurations will need to be updated to enable SSL and connect to the SSL port.