HPE Integrated Lights-Out (iLO) extension
- Latest Dynatrace
- Extension
Remotely collect iLO data via the Redfish API.
Get started
Overview
Collect iLO data remotely via the Redfish API.
Integrated Lights-Out (iLO) is a proprietary management technology built into HPE products that allows for remote control access to ProLiant servers even without being connected to the main network.
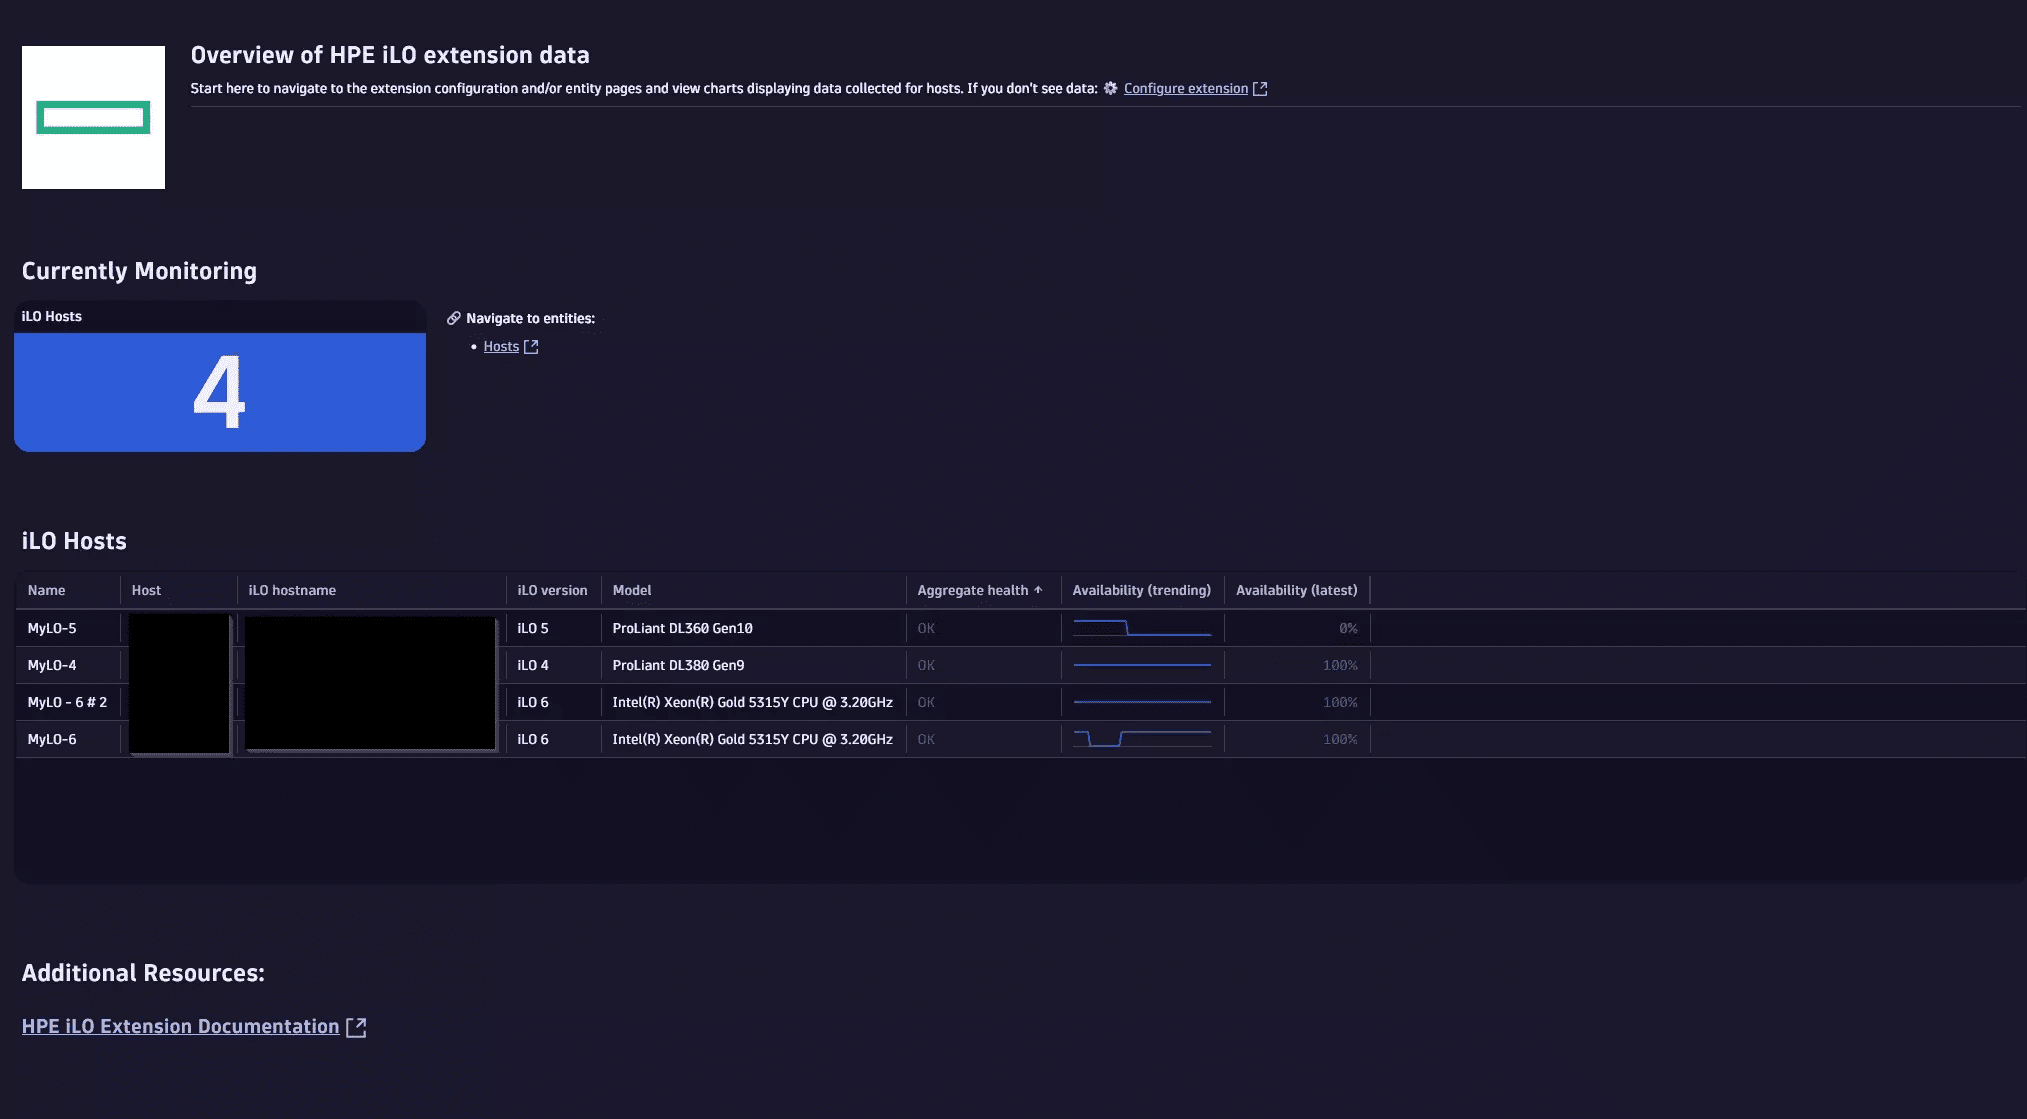
The iLO extension allows for remote monitoring of such instances via their Redfish API (first introduced in iLO 4).
Use cases
- Monitor iLO instance health and availability
- Quickly alert on health or availability related issues
- View and alert on instance activity such as logins, virtual power events, log clears, and some configuration changes
Requirements
- Minimum Dynatrace environment and ActiveGate version 1.310
- ActiveGate must be able to reach the target iLO instances (HTTPS)
- An OS in the listed of the supported distributions
- A user account on the iLO instance with at least ReadOnly permissions (
username:password)
Compatibility information
- iLO 4
- iLO 5
- iLO 6 (limited testing)
iLO 4 was the first version with the Redfish API and as such reports a much smaller amount of data as compared to later versions, primarily limited to instance properties and high-level health statuses.
iLO 6 has been tested to a limited extent but has not been confirmed to have run on a live iLO 6 instance. While safe to use, if you experience issues or feel something is missing reach out to support to help us better cover this latest version.
Activation and setup
Find 'HPE Integrated Lights-Out (iLO)' in the in-product Extensions App or Hub page and activate (if offline you can download the extension from this Hub page in the 'Release notes' section and install as a custom extension).
Once activated in your environment you can create monitoring configurations. Each monitoring configuration can have one or more iLO targets.
First select the desired ActiveGate group that will run the monitoring configuration.
For each cluster configure onr or more iLO hosts:
-
Default authentication
- If you are using the same credentials for multiple hosts you cand define top-level authentication that will apply to all endpoints (unless overridden at the endpoint level)
- Can use the credential vault
-
Endpoints
- iLO Host: hostname or IP address to connect to
- If the port is left off then the default 443 will be used. If you need to use a custom port add it at the end of the host name (e.g.
<hostname>:<port>)
- If the port is left off then the default 443 will be used. If you need to use a custom port add it at the end of the host name (e.g.
- Alias (Optional): if an alias is configured it will override any auto-discovery of the hostname. If not set, we will try to determine the configured hostname based on the Redfish API output and will fall back to the configured hostname or IP address
- Issues have been observed with the discovered names reverting to previous values after resets and other issues. If you want to ensure the entity name is consistent and what you expect you should use the alias configuration
- Credentials: Username and password pair. This can come from the Credential Vault (make sure the credential (username/password) was enabled for use with extensions)
- iLO Host: hostname or IP address to connect to
-
Collect iLO Event Logs (IEL)
-
Log collection delay (if logs enabled): How far back to shift log collection windows to ensure that ther are log records available in the queried window
- There is a delay after an event occurs before a log is available to view/collect. To ensure we don't query logs 'to soon' we shift back the query timeframe to a time when we can be sure the logs will be available. For example, with the default delay of 60 minutes at 10:00 we will query for logs from 8:59 to 9:00.
-
Advanced settings:
- Use log collection time as timestamp
- By default we will use the true event timestamp as the timestamp for the log ingested into Dynatrace. Because a delay is required during collection this means that the most recent periods (1 hour by default) will not have records. If you prefer, you can enable this to have the collection time used as the timestamp associated with the log record. This will result in the records 'appearing' to be occurring after their true time but will ensure you have records in the recent intervals regardless of the configured collection delay
- Connection retries: default 5
- Connection timeout: default 20 seconds
- Collection frequency: default 1 minute
- Task bucket size: up to 500 instances can be configured per monitoring configuration but you can break this up into multiple smaller tasks (or batches) that can be distributed across ActiveGates in the group
- Use log collection time as timestamp
-
Log level
Details
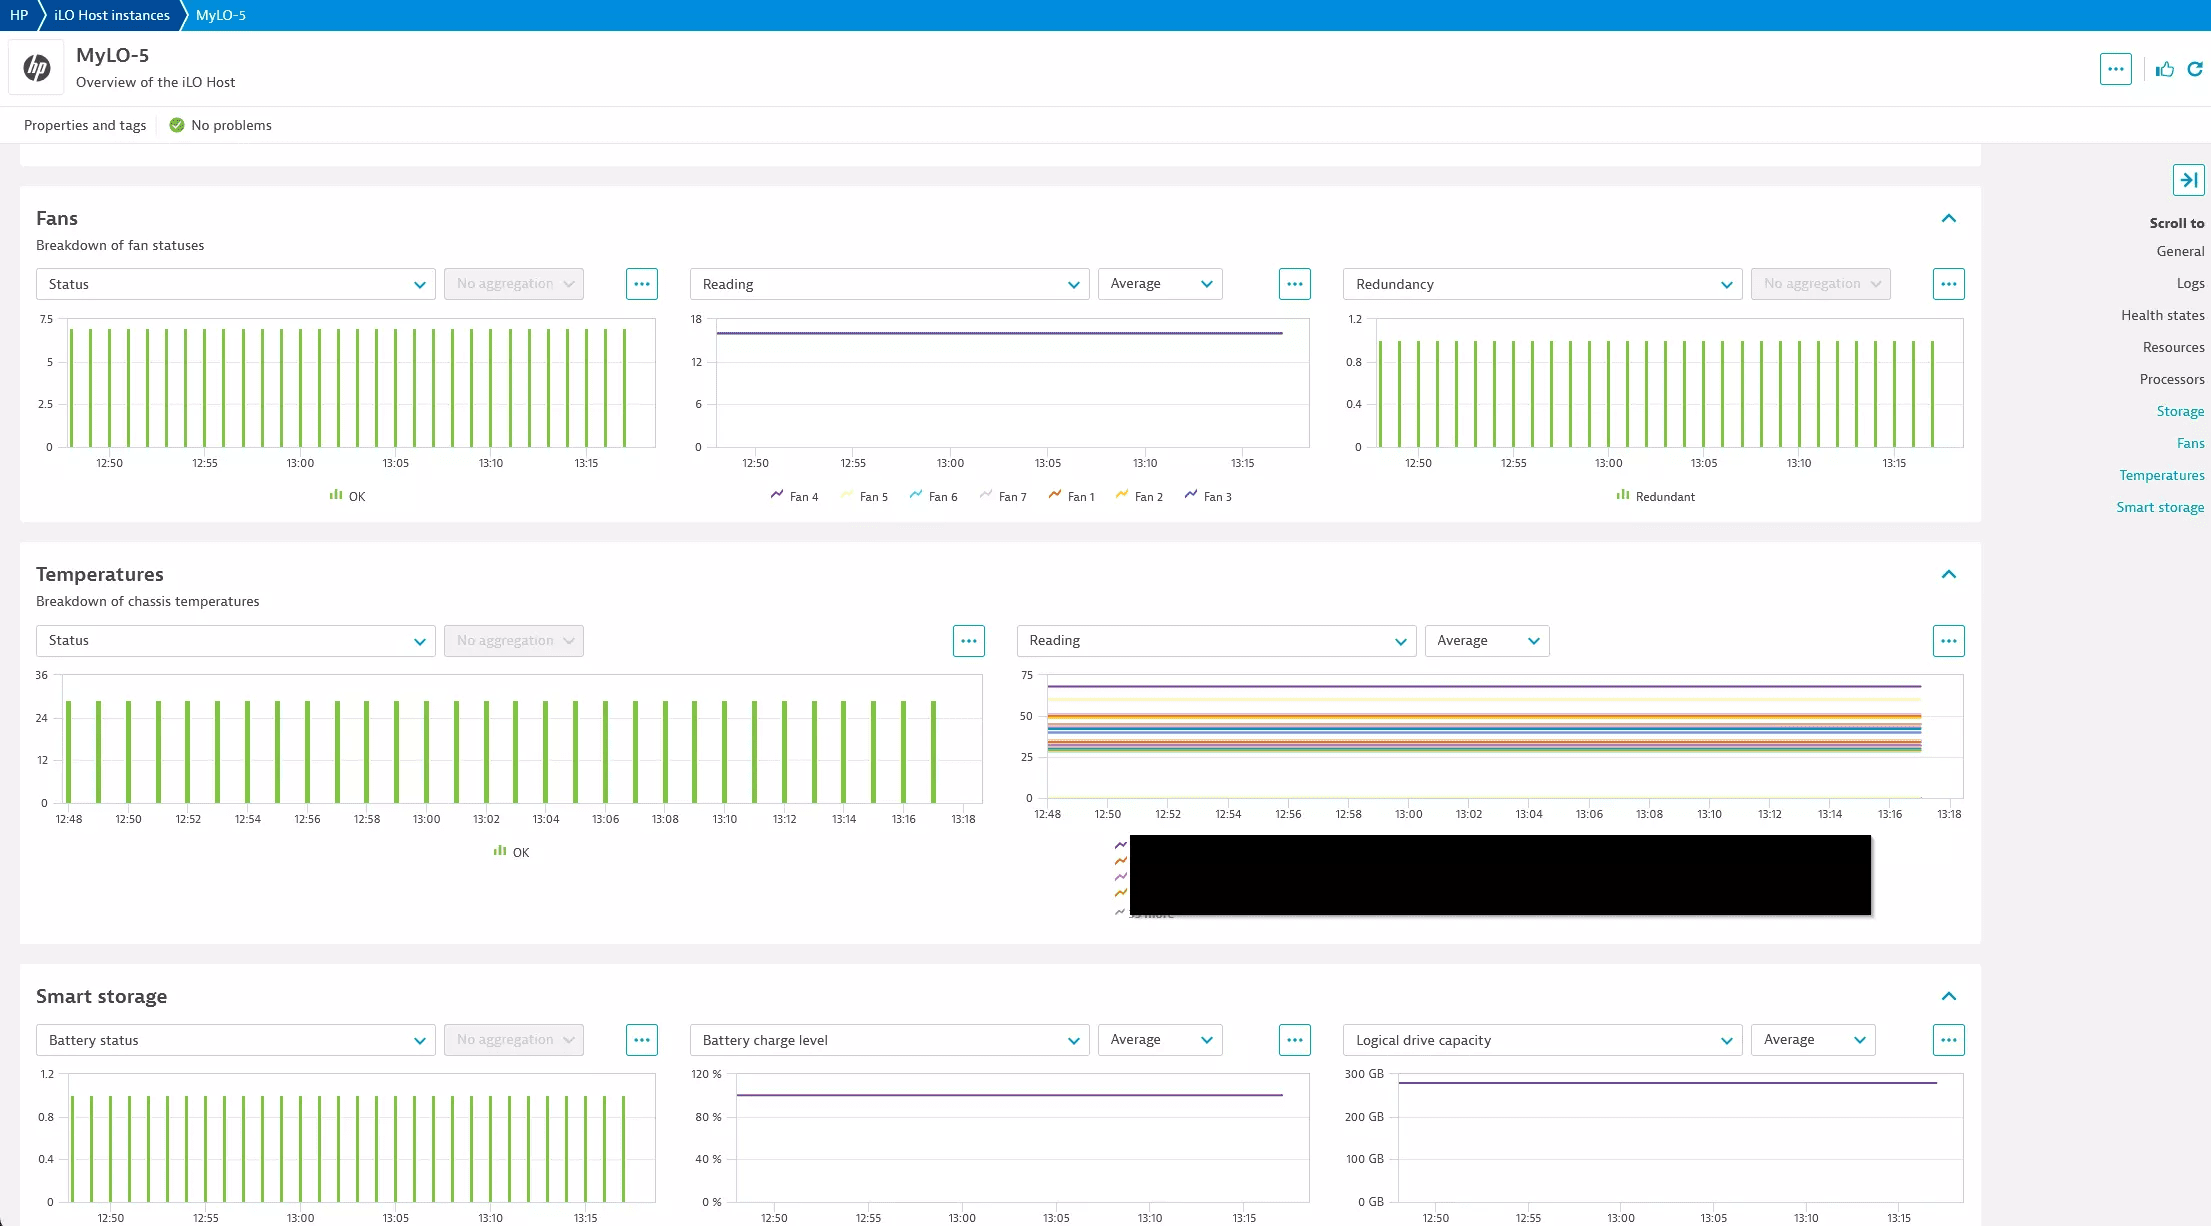
Metrics
Review the list of feature sets to see which metrics are collected. Note that different supported iLO versions have significant changes in their Redfish API output which means that some versions (typically the earlier iLO 4) will have much less data exposed for collection meaning monitoring of such instances will be more limited than the later version(s). As such, not every metric in the available feature sets will be reported for all instances.
Log events
If enabled, we will collect iLO Event Log (IEL) records. There is a significant delay before such records are guaranteed to be available for collection so by default there is a 1 hour collection delay. You can lower this delay but make sure to verify that you are not losing records by querying too soon. The API delay for log availability has been observed to mirror the delay before they are available in the iLO management UI log viewer.
iLO 4 was created prior to the Redfish specification being completed and does not implement the query filters we require to monitor logs. If your iLO hosts are affected the extension will detect it and stop trying to collect logs to prevent unneeded overhead and errors.
Licensing and costs
There is no charge to use the extension. You are only charged for the data that the extension ingests.
The HPE Integrated Lights-Out (iLO) extension ingests custom metrics, which consume Davis Data Units (DDUs) (Dynatrace classic license) or Metrics powered by Grail (DPS), according to your license model.
Assuming all feature sets are enabled, the approximate number of metric data points per minute is:
24 + <number of logical drives> + (2 * <number of fans>) + <number of processors> + <number of storage drives>
Due to the lower amount of data available in earlier iLO versions, usage in iLO 4 will be lower than iLO 5. These numbers estimate the maximum usage.
Each iLO Event Log record will be ingested as a log record.
Dynatrace Platform Subscription
In the Dynatrace Platform Subscription, metric ingestion consumes Metrics powered by Grail according to the number of ingested metric data points.
To calculate the approximate yearly consumption, apply the following calculation: <metric data points per minute> * 60 minutes * 24 hours * 365 days.
For logs, regular consumption applies. See Log Analytics.
Dynatrace classic license
In the classic licensing model, metric ingestion consumes Davis Data Units (DDUs) at the rate of .001 DDUs per metric data point. Multiply the above formula for annual data points by .001 to estimate annual DDU usage.
For logs, regular DDU consumption applies. See DDU consumption for Log Management and Analytics or DDUs for Log Monitoring Classic.
The DDU cost above does not include any possible log events or custom events that are triggered by the extension. For more information, see DDU events.
FAQ
The most likely issue is that the configuration does not point to the Redfish API endpoint on the instance or that the instance is unreachable from the configured ActiveGate(s). To manually test the configured target, reachability from the ActiveGate, and credentials you can run a curl command like below (see the iLO doc) for details.
For the most accurate test it must be run from the ActiveGate the extension will try to connect from (or an ActiveGate in the group).
curl --include --insecure \--user username:password \--location https://{IP}/redfish/v1/Systems/
Feature sets
When activating your extension using a monitoring configuration, you can limit monitoring to one of the feature sets. To work properly, the extension has to collect at least one metric after the activation.
In highly segmented networks, feature sets can reflect the segments of your environment. Then, when you create a monitoring configuration, you can select a feature set and a corresponding ActiveGate group that can connect to this particular segment.
All metrics that aren't categorized into any feature set are considered to be the default and are always reported.
A metric inherits the feature set of a subgroup, which in turn inherits the feature set of a group. Also, the feature set defined on the metric level overrides the feature set defined on the subgroup level, which in turn overrides the feature set defined on the group level.
default
| Metric name | Metric key | Description |
|---|---|---|
| Availability | hp.ilo.availability | The ability to connect and login to the iLO instance |
| Aggregate server health | hp.ilo.health_status.aggregate_server_health | Overall health state |
system
| Metric name | Metric key | Description |
|---|---|---|
| Total system memory | hp.ilo.memory.total_system_memory | Total system memory |
| Power on time | hp.ilo.uptime | Power on time/uptime as reported by the API |
| CPU utilization | hp.ilo.cpu_util | Reported CPU utilization |
| I/O bus utilization | hp.ilo.io_bus_util | Input/output bus utilization |
| Memory bus utilization | hp.ilo.memory_bus_util | Memory bus utilization |
| BIOS or hardware health | hp.ilo.health_status.bios_or_hardware_health | BIOS or hardware health |
| Fan health | hp.ilo.health_status.fans | Fan health |
| Fans redundancy | hp.ilo.health_status.fans_redundancy | Indicates whether the fans are redundant or not |
| Memory health | hp.ilo.health_status.memory | Memory health |
| Network health | hp.ilo.health_status.network | Network health |
| Power supply health | hp.ilo.health_status.power_supplies | Power supply health |
| Power supply redundancy | hp.ilo.health_status.power_supplies_redundancy | Indicates whether power supplies are redundant |
| Processor health | hp.ilo.health_status.processors | Overall processor(s) health status |
| Temperature health | hp.ilo.health_status.temperatures | Temperature health |
| Smart storage battery health | hp.ilo.health_status.smart_storage_battery | Smart storage battery health (iLO 5) |
| Smart storage logical drive capacity | hp.ilo.smart_storage.logical_drive.capacity | Smart storage logical drive capacity (iLO 5) |
chassis
| Metric name | Metric key | Description |
|---|---|---|
| Chassis health | hp.ilo.chassis.health | Overall chassis health |
| Chassis power supply health | hp.ilo.chassis.power_supply.health | Chassis power supply health |
| Chassis temperature health | hp.ilo.chassis.temperature.health | Chassis temperature health |
| Chassis temperature reading | hp.ilo.chassis.temperature.reading | Current chassis temperature reading |
| Chassis fan health | hp.ilo.chassis.fan.health | Chassis fan health |
| Chassis fan reading | hp.ilo.chassis.fan.reading | Current chassis fan temperature reading |
| Chassis power supply redundancy | hp.ilo.chassis.power_supply_redundancy_health | Indicates whether the chassis power supply is redundant or not |
| Chassis smart storage battery health | hp.ilo.chassis.smart_storage_battery.health | Chassis smart storage battery health (iLO 5) |
| Chassis smart storage battery charge level | hp.ilo.chassis.smart_storage_battery.charge_level_percent | Chassis smart storage battery charge level (iLO 5) |
storage
| Metric name | Metric key | Description |
|---|---|---|
| Drive health | hp.ilo.storage.drive.health | Individual storage drive health |
processor
| Metric name | Metric key | Description |
|---|---|---|
| Processor health | hp.ilo.processor.health | Individual processor health |
manager
| Metric name | Metric key | Description |
|---|---|---|
| Graphical console enabled | hp.ilo.manager.graphical_console_enabled | Indicates whether the graphical console is enabled or not |
