RUM initial setup for custom applications
- How-to guide
- 1-min read
Monitoring data sent via Dynatrace OpenKit is encapsulated into an entity that represents your application and is called custom application. Therefore, to monitor your application, you need to define and instrument the custom application following the instructions below.
To create a custom application in Dynatrace and instrument it
- In Dynatrace, go to Custom Applications.
- Select Create custom application.
- Enter a name for your custom application, and choose an icon to visually represent your application in the Dynatrace web UI.
- Select Monitor custom application. Your custom application settings page opens.
- From the application settings, select Instrumentation wizard and then select your technology to download the latest OpenKit library.
- Use the downloaded library and the Beacon URL and Application ID provided in the instrumentation wizard to instrument your application.
- optional In the instrumentation wizard, select View incoming beacons to show incoming beacons as they arrive, with only a couple of seconds delay. This view also provides information about potential issues.
Below is a basic example that shows how to use Dynatrace OpenKit to send monitoring data to Dynatrace. For more details, see Dynatrace OpenKit API methods.
// Obtain an OpenKit instanceString applicationID = "application-id"; // Your application's IDlong deviceID = 42; // Replace with a unique value per device/installationString endpointURL = "https://tenantid.beaconurl.com/mbeacon"; // Dynatrace endpoint URLOpenKit openKit = new DynatraceOpenKitBuilder(endpointURL, applicationID, deviceID).withApplicationVersion("1.0.0.0").withOperatingSystem("Windows 10").withManufacturer("MyCompany").withModelID("MyModelID").build();// Wait up to 10 seconds for OpenKit to complete initializationlong timeoutInMilliseconds = 10 * 1000;boolean success = openKit.waitForInitCompletion(timeoutInMilliseconds);// Create sessionString clientIP = "8.8.8.8";Session session = openKit.createSession(clientIP);// Identify usersession.identifyUser("jane.doe@example.com");// Create root and child actionsString rootActionName = "rootActionName";RootAction rootAction = session.enterAction(rootActionName);String childActionName = "childAction";Action childAction = rootAction.enterAction(childActionName);// Leave actionchildAction.leaveAction();rootAction.leaveAction();// Finish sessionsession.end();// Terminate OpenKit instanceopenKit.shutdown();
You can find your application ID and the endpoint URL in the instrumentation wizard (from your application settings, select Instrumentation wizard).
For custom applications, user identification is achieved by passing deviceID, which should be unique for each user or device. Then deviceID is marked as the Internal user ID in the Dynatrace web UI.
After creating a custom application in Dynatrace and instrumenting your actual application with OpenKit, check the pages below to customize and troubleshoot the instrumentation.
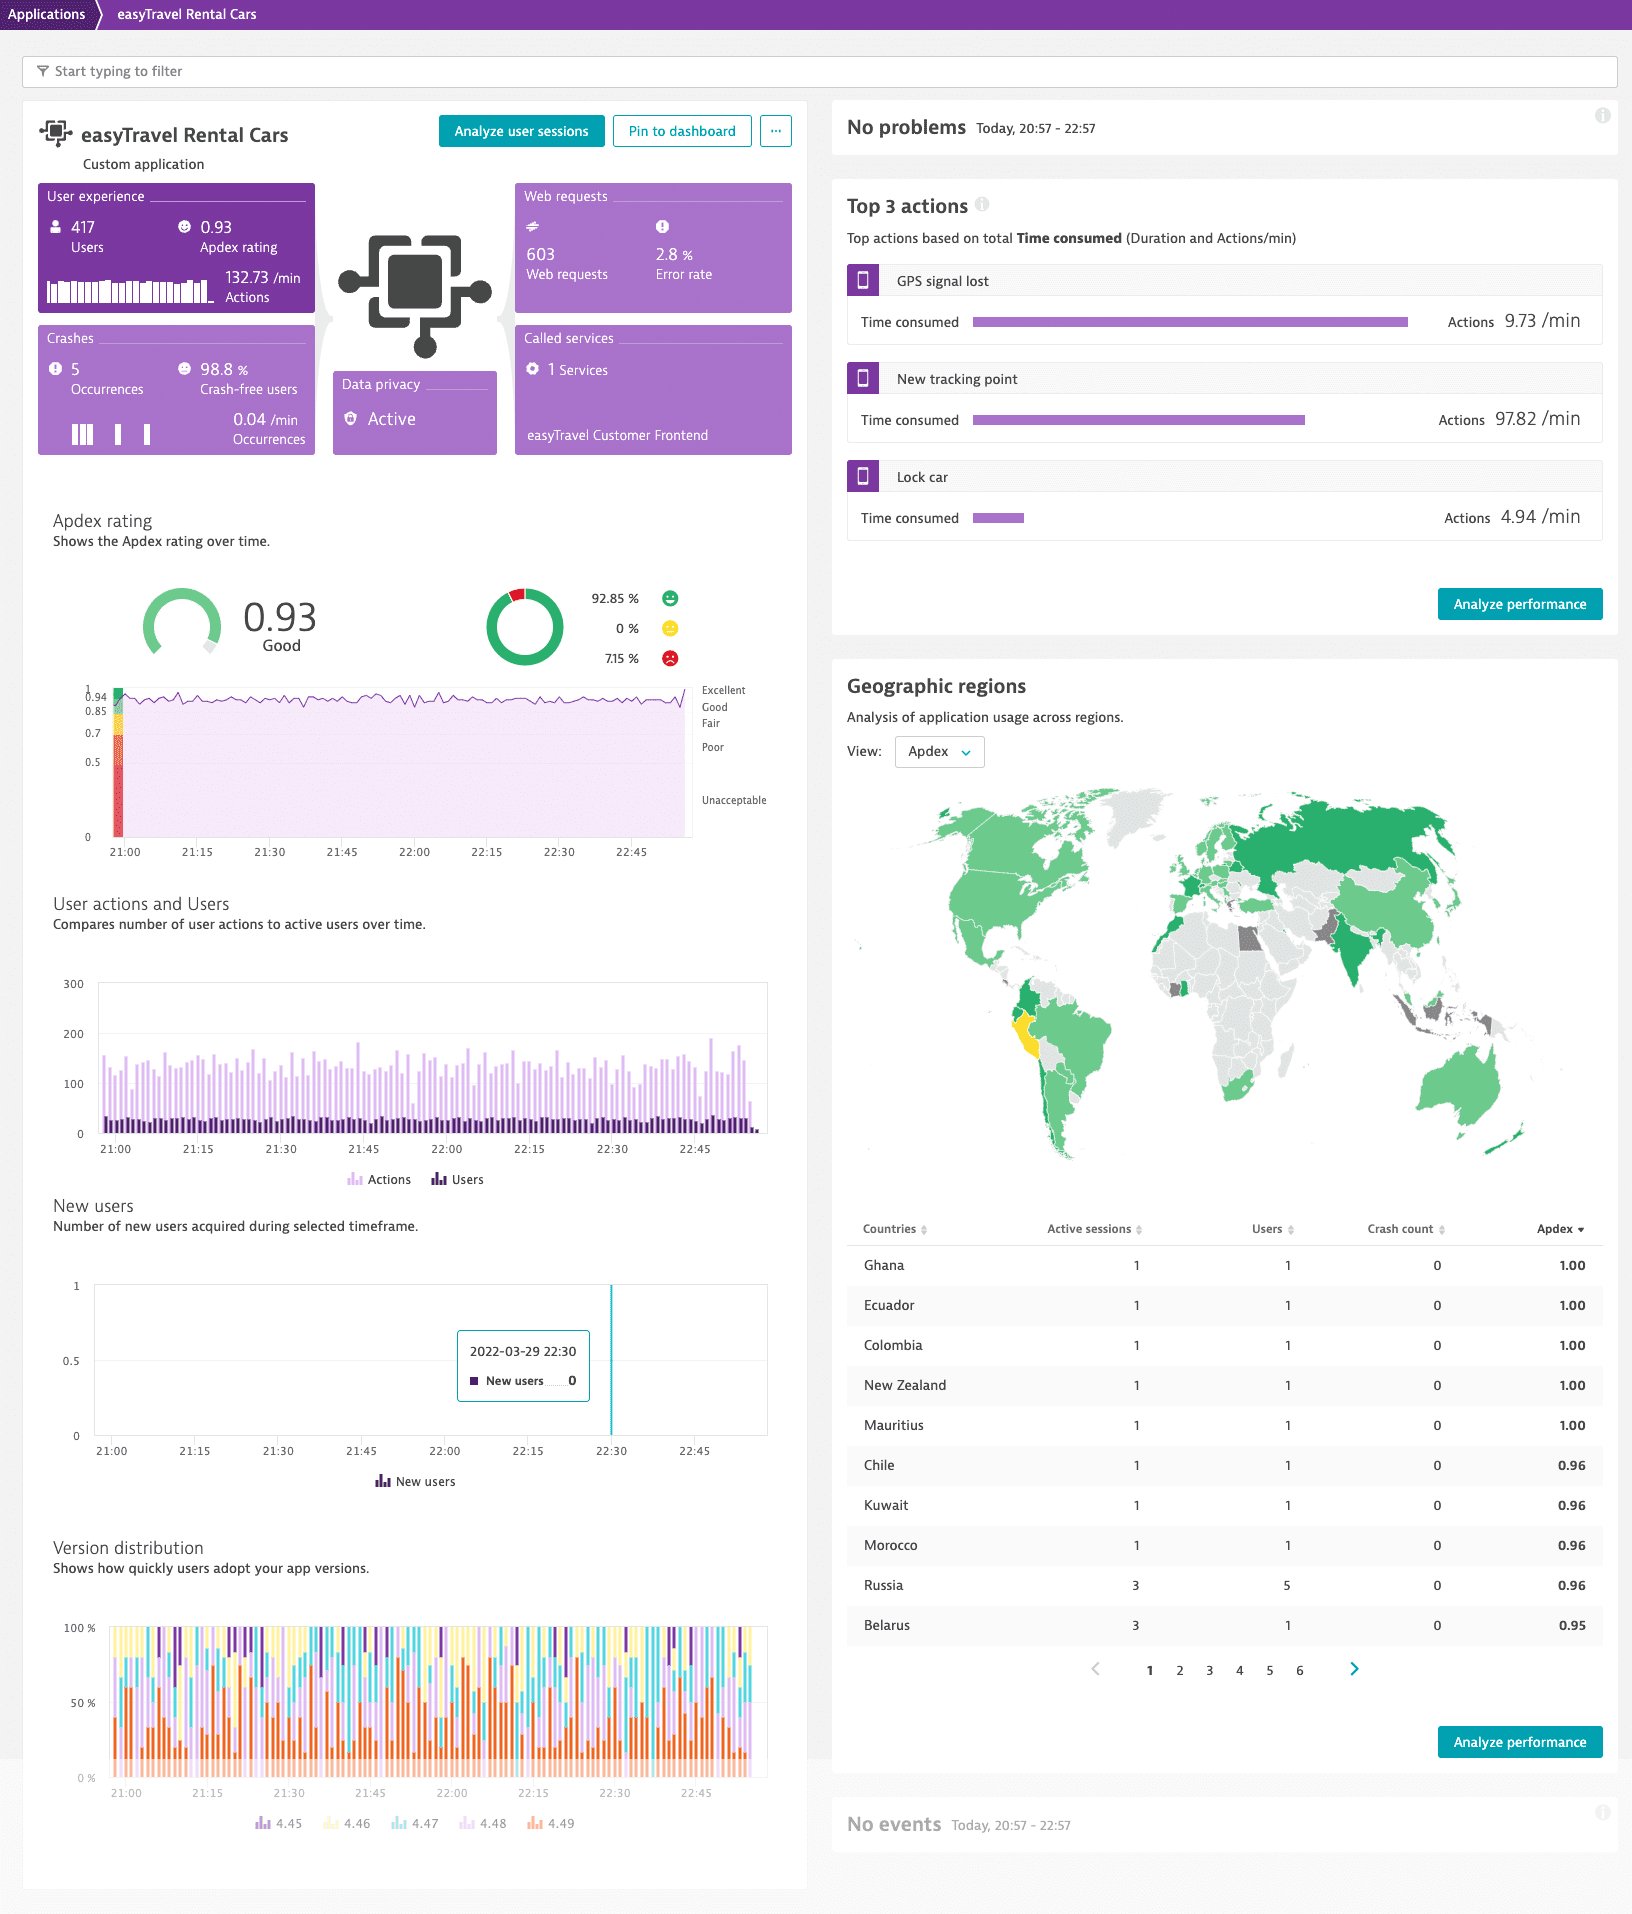
Once your custom application starts sending monitoring data to Dynatrace, you can analyze this data just like you do for any other application. For example, you can examine user sessions, check user experience metrics, analyze web requests, view crash reports, and more.
The image below shows the overview page of our test custom application.