Anomaly detection configuration
- Latest Dynatrace
- Explanation
- 7-min read
An anomaly detection configuration relies on several components:
- Data source—a time series that is evaluated. It can be a DQL query, fetching data from Grail or a specific metric.
- Analyzer type and parameters: how the data is evaluated.
- Sliding window: a period over which the data is evaluated.
- Event template: what kind of template is triggered by the configuration.
Once configured and activated, the configuration observes the data and triggers an event when conditions are met. To ensure the configuration works as expected and alerts you about the right events, you can preview the results of its work:
- Previous Dynatrace The preview of a metric event visually represents your event's behavior. You can adjust the settings to see how they affect the configuration.
To learn how to set up alerts in  Anomaly Detection, see Configure a simple custom alert or Configure an advanced custom alert depending on your needs.
Data source
Data source provides a time series that is evaluated by Dynatrace Intelligence:
- Previous Dynatrace A metric defines the time series. It can be a single metric defined by a metric key or a metric expression.
If your data has a latency, you need to offset it in your configuration via the Query offset parameter. Specify the value in minutes.
Delay
The Delay parameter helps you to reduce the frequency of DQL query executions performed by a custom alert in an hour, thereby helping to lower query costs and minimize system load.
While the default delay period between custom alert executions is 1 Minute, you can configure the query execution to longer intervals (for example, every five minutes) without losing the ability to perform retroactive evaluations for each minute within the selected time window.
You can configure the Delay parameter using Minutes or Seconds, but the delay can't be longer than 60 Minutes.
Data type
The Data type parameter allows you to choose which type of data for which the Anomaly Detection configuration should create alerts.
- Timeseries
- Records
Timeseries
Timeseries analyzers alert based on the detected threshold violations, like static threshold analyzer, and pattern deviations, like seasonal baseline. This means that timeseries analyzers raise an alert based on:
- A threshold violation condition (above the threshold, below the threshold, or both), where the threshold is calculated from continuous monitoring or is fixed and set within the known, predefined range.
- An observed anomaly within the calculated and established pattern.
Timeseries analyzers are suitable for:
- Continuous timeseries monitoring
- Pattern detection
- Reducing noise in case of frequent value shifts, which can be done via the sliding window
Analyzer type and parameters
Analyzer parameters define how Dynatrace Intelligence evaluates the data provided by the data source. The exact set of parameters depends on the type of the analysis:
- Auto-adaptive threshold—Dynatrace calculates the threshold automatically and adapts it dynamically to your data's behavior.
- Seasonal baseline—Dynatrace creates a confidence band for data with seasonal patterns.
- Static threshold—A threshold that doesn't change over time.
| Parameter | Description |
|---|---|
Number of signal fluctuations | The auto-adaptive threshold consists of two components: a baseline and a signal fluctuation. This parameter defines how many times the signal fluctuation is added to the baseline. For more information, see Threshold calculation. |
Threshold | This parameter defines the value of a static threshold and, if applicable, its unit. Select Suggest values to use a value calculated by Dynatrace Intelligence based on the previous data. |
Tolerance | This parameter defines the tolerance of the seasonal model. The higher the tolerance, the broader the confidence band, leading to fewer triggered events. |
Alert condition | This parameter defines when an event is triggered: if the metric is above, below, or outside of the threshold. |
Missing data alert | This parameter defines whether the missing data alert is active for the configuration. If active, it's combined with the threshold condition by the OR logic. You can find it in the Advanced properties section of the configuration. |
Records
A records data type analyzer alerts based on the records that matches the filters provided in the Query parameter field. This means that each record detected by a custom alert with Data type set to Records is treated as a potential anomaly that should be reported.
A records-based analyzer is suitable for:
- Using aggregated metrics as a threshold: a records-based analyzer supports a wider range of Grail queries. This means that you can use a variety of commands, such as aggregation commands, to set the threshold. For example, you can provide a query that that creates an alert when the sum or a count of selected field values exceeds or drops below a given number.
- Smartscape-based alerting: you can provide and combine multiple types of
 Smartscape data to define the undesired state that should be treated as an anomaly.
 - Alert on missing events: let's assume that a backup should be made every 48 hours, and for that you send a success event that a backup was performed. You can use a records-based analyzer to be alerted if no backup data is received in a period higher than 48 hours.
If you're using the records data type and choose to not define a timeframe in the query (for example, from: -48h), the default 2-hour timeframe (from: -2h) is used.
To learn more about using records-based analyzer, see Monitor daily LLM cost burn rate using records-based custom alerts.
Alert identity fields
As we explained in the DQL writing guide, most record fields are treated as dimensions: every distinct value produces a separate monitored dimension. To prevent a rapid increase in monitored dimensions, remove volatile (high‑cardinality) fields from the query. However, those volatile fields often contain useful context you still want attached to the event. With Alert identity fields feature, you can keep volatile fields in the query for event context while selecting only stable fields for the anomaly detector. Unselected fields are ignored for monitoring purposes but remain in the event properties for context.
For this parameter, you should only provide fields with stable values that don't change over time. This helps you avoid duplicate events and reduces noise by matching newly detected records with the ones you've already been alerted on. If the identity fields match between the records, the existing event gets updated instead of creating a new one.
Choosing a correct alert identity field
When choosing alert identity fields, keep in mind that the chosen fields must represent a dimension that's unique for this record.
Suppose you want to track disk usage and your query found two records:
Record 1:
host=A, disk=A, disk_usage=90
Record 2:
host=A, disk=B, disk_usage=70
These records have one field that shares the same value (host=A), and two unique fields, disk and disk_usage. Between them, you need to set a correct alert identity field.
You shouldn't choose:
disk_usage: this is an example of a volatile dimension. Each time the value changes, be it after a minute or an hour, a new alert will be created.host: this is a stable field, but it's shared between both records. If you choosehostas your alert identity field, you'll receive an alert for bothdisk=Aanddisk=Bbecause they share the same host, even if the only one of the records has been matched. This can lead to an increased noise from the inflow of false positive alerts.
Instead, choose:
disk: this is a stable field with a value that's unique for both records. Choosingdiskas an alert identity field allows you to track disk usage per disk, regardless of whether they use the same host or not. This is the optimal approach because:hostis less granular, higher-level entity. Tracking disk usage per host is imprecise and results in false alerts for both disks, even if the disk usage ofdisk=Bdoesn't match the alerting condition.diskis more granular and provides a more precise, detailed result when tracking disk usage. The alert is raised only for a disk whose disk usage matches the alerting condition.
Missing data alert
Dynatrace provides you the ability to set an alert on missing data in a metric or a DQL query. If the alert is active, Dynatrace regularly checks whether the sliding window of the anomaly detection configuration contains any measurements. For example, if the sliding window is set to 3 violating samples during any 5 minutes, Dynatrace triggers an alert if there's no data within a 3-minute period.
The missing data condition and threshold condition are combined by the OR logic.
We recommend disabling missing data alerts for sparse data streams, where measurements are not expected in regular intervals, as it will result in alert storms.
For expected late-incoming data (for example, cloud integration metrics with a 5-minute delay), use long sliding windows that cover delays. For a 5-minute delay, use a sliding window of at least 10 minutes.
The {missing_data_samples} event description placeholder resolves to the number of minutes without data received.
Sliding window
The sliding window of an anomaly detection configuration defines how many one-minute samples must violate the threshold during a specific period. When the specified number of violations is reached, Dynatrace raises an event. The goal is to avoid overly aggressive alerting on single violations, when every measurement that violates the threshold triggers an event.
The event remains open until the metric stays within the threshold for a certain number of one-minute samples within the same sliding window, at which point Dynatrace closes the event. Keeping the event open helps to avoid over-alerting by adding new threshold violations to an existing problem instead of raising a new one.
You can find settings for the sliding window in the Advanced properties section of the configuration. By default:
- Any three one-minute samples out of five must violate your threshold to raise an event.
- Five one-minute samples must be back to normal to close this event.
You can set a sliding window of up to 60 minutes for each of the three analyzer types.
Let's consider a case of a static threshold of 90% CPU usage.
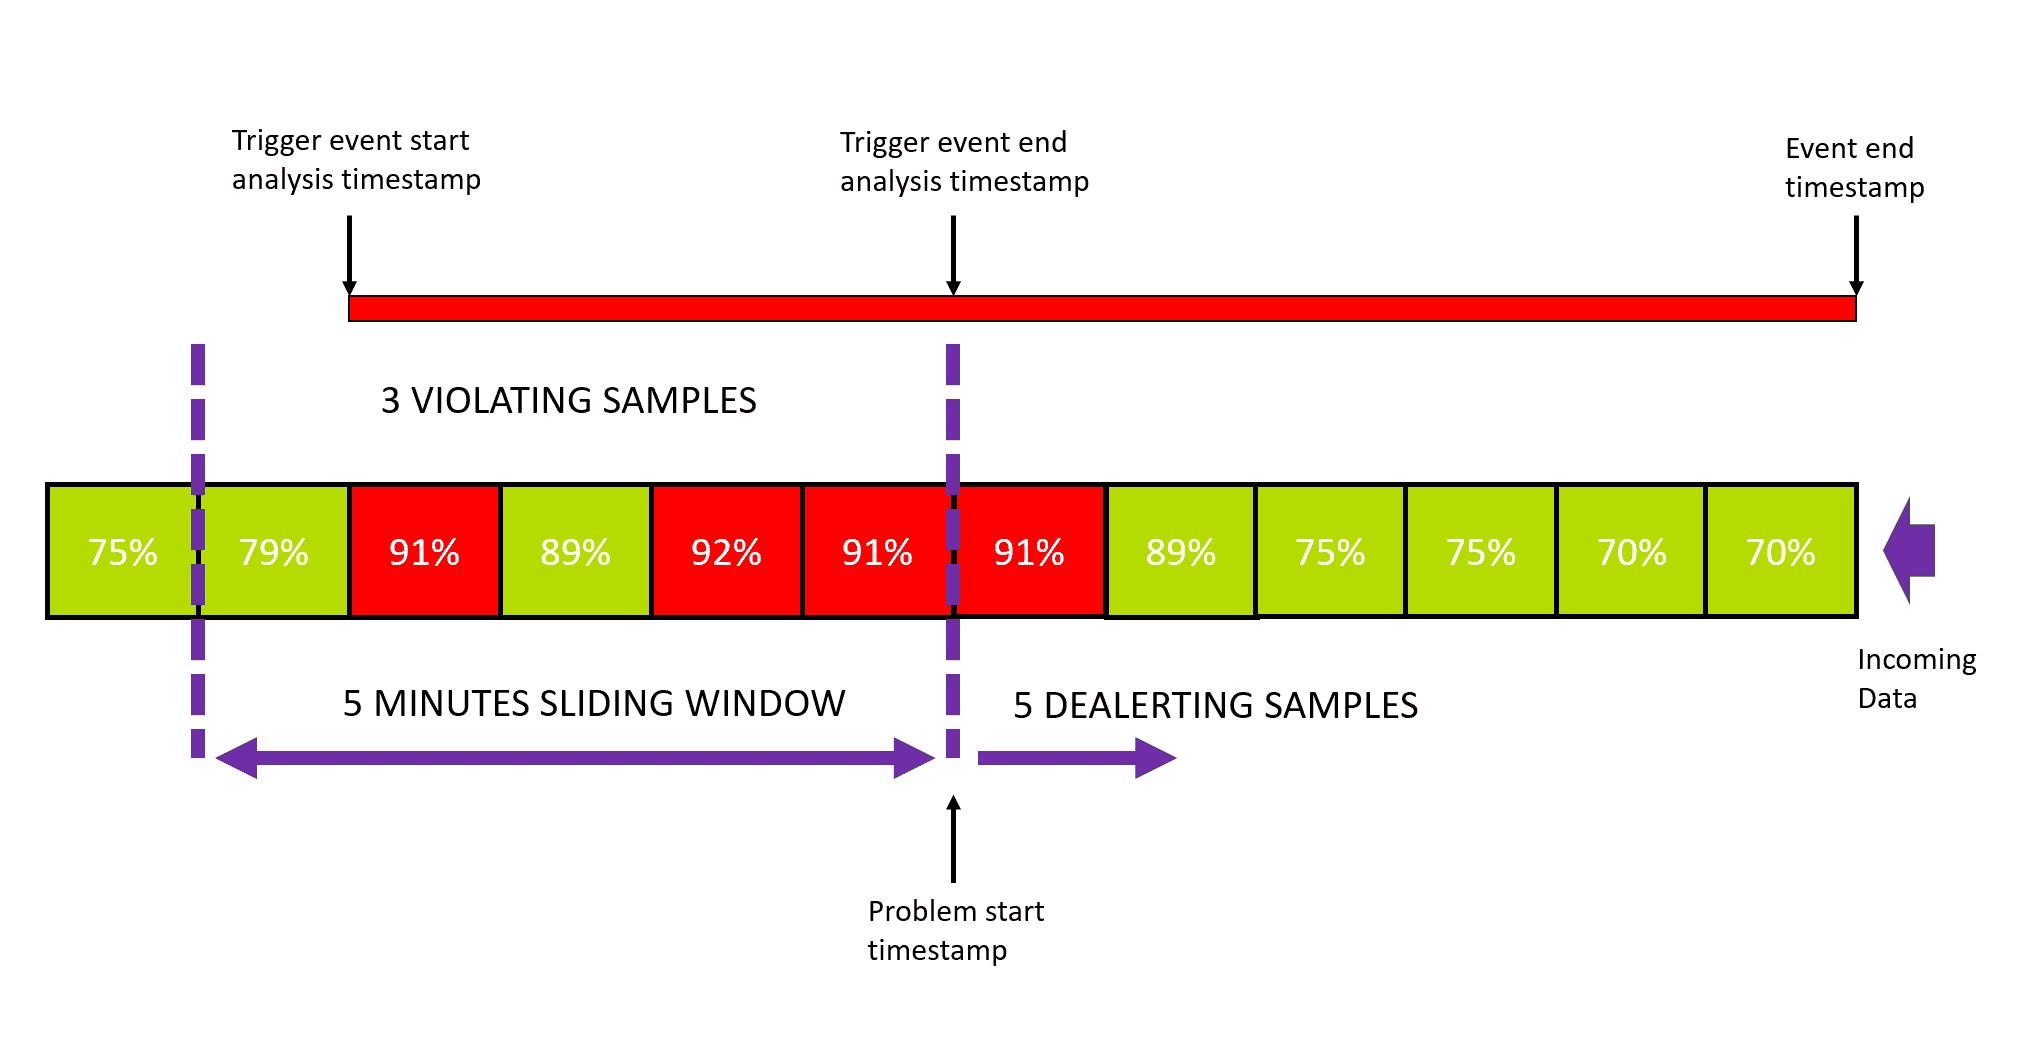
The event analysis starts with the first violating sample in the sliding window. Once the number of violating samples reaches the defined threshold, the event analysis stops and a problem is raised. Even though event analysis is stopped, the event itself remains open until the de-alerting criteria are met:
- The number of violating samples must be lower than the threshold number to raise the problem.
- The number of "normal" samples must be greater than or equal to the number of de-alerting samples.
Both criteria must be met to close the event.
The default numbers (3 violating samples in the sliding window of 5 samples to trigger a problem, 5 de-alerting samples to close the event) are a good fit for most configurations. However, you might need to update them (for example, due to noise in measurements).
Event template
The event template defines characteristics of an event triggered by threshold violation. You need to provide at least the name and the type of the event.
- For quick understanding of the event, the name should be a short, easy-to-read description of the situation, such as
High network activityorCPU saturation. - The name can include placeholders such as
{threshold}or{alert_condition}. Placeholders are replaced with real values in the actual event. To see available placeholders, type{in the input field. There are several available thresholds:{alert_condition}- the condition of the alert (above/below the threshold).If you set the Alert condition to
Alert if the metric is outside,{threshold},{severity}and{baseline}placeholders will not be available.{baseline}- the violated value of the baseline.{dims}- a list of all dimensions (and their values) of the metric that violated the threshold. You can also specify a particular dimension:{dims:dt.entity.<entity>}. To fetch the list of available dimensions for your metric, query it via the GET metric descriptor request.{entityname}- the name of the affected entity.{metricname}- the name of the metric that violated the threshold.{missing_data_samples}- the number of samples with missing data. Only available if missing data alert is enabled.{missing_data_samples}in the event descriptionWe recommend including the
{missing_data_samples}placeholder in the event description to see whether the problem is raised due to missing data samples or threshold violations.{severity}- the severity of the event.{threshold}- the violated value of the threshold.
You can provide additional parameters as key-value pairs. For a list of possible event properties, see Semantic Dictionary.