Apache CouchDB extension
- Latest Dynatrace
- Extension
- Published Oct 27, 2025
Intelligently observe and optimize health and performance of your database.
Get started
Overview
Automatically detect all applications and microservices deployed in your system.
Dynatrace provides automatic end-to-end tracing down to the single database statement, database server metrics and log insights. Dynatrace visualizes application to database dependencies for SQL and noSQL database as well as for cloud databases and self hosted databases. It diagnoses anomalies in real time with AI and pinpoints the root-cause down to the slow performing or erroneous SQL statements. Deep code-level insights combined with cloud native database server monitoring will help you ensure a robust production environment.

Apache CouchDB server monitoring in Dynatrace provides a cluster overview and all relevant nodes metrics.

If your Apache CouchDB installation is underperforming or a problem occurs, Dynatrace lets you know immediately and shows you which nodes are affected. You can then drill down into the metrics of individual nodes to find the root causes of problems and potential bottlenecks.

Use cases
- Understand all dependencies of your applications to the database, which database statements are executed and their performance.
- Improve the performance of your application by reducing or optimizing typical database patterns like the 1+N query problem
- Understand the resource impact that your applications have on your database.
- Understand the impact of resource shortages, locks or other database issues have on your application by observing the database server itself.
Requirements
-
Virtual machine: If your Apache CouchDB is running on a virtual machine directly, install OneAgent on that virtual machine to get started.
-
Kubernetes workload: If your Apache CouchDB is running as a workload in Kubernetes, set up Dynatrace on Kubernetes.
-
Openshift workload: If your Apache CouchDB is running as a workload in OpenShift, set up Dynatrace on OpenShift.
-
Extension: Activate the CouchDB extension to get full metric insight including events.
Compatibility information
- CouchDB user with access to
/_membershipand/_nodeendpoints. - Linux or Windows OS
- CouchDB 3+
Activation and setup
- Select "Add to Environment".
- Create a monitoring configuration.
- Select the ActiveGate group that will handle the execution of the extension. This selected ActiveGates must be able to establish a connection with the CouchDB cluster on the port that the cluster is using (the default is 5984).
- Select "Create an endpoint".
- Provide to URL to the CouchDB cluster that you would like to monitor.
- Set the "Username" and "Password". We recommend to first create the credential in the Credential Vault and then select the "Credential Vault" option to choose your CouchDB credentials.
- Set the query interval. For best results, we recommend an interval of 1-5 minutes.
Details
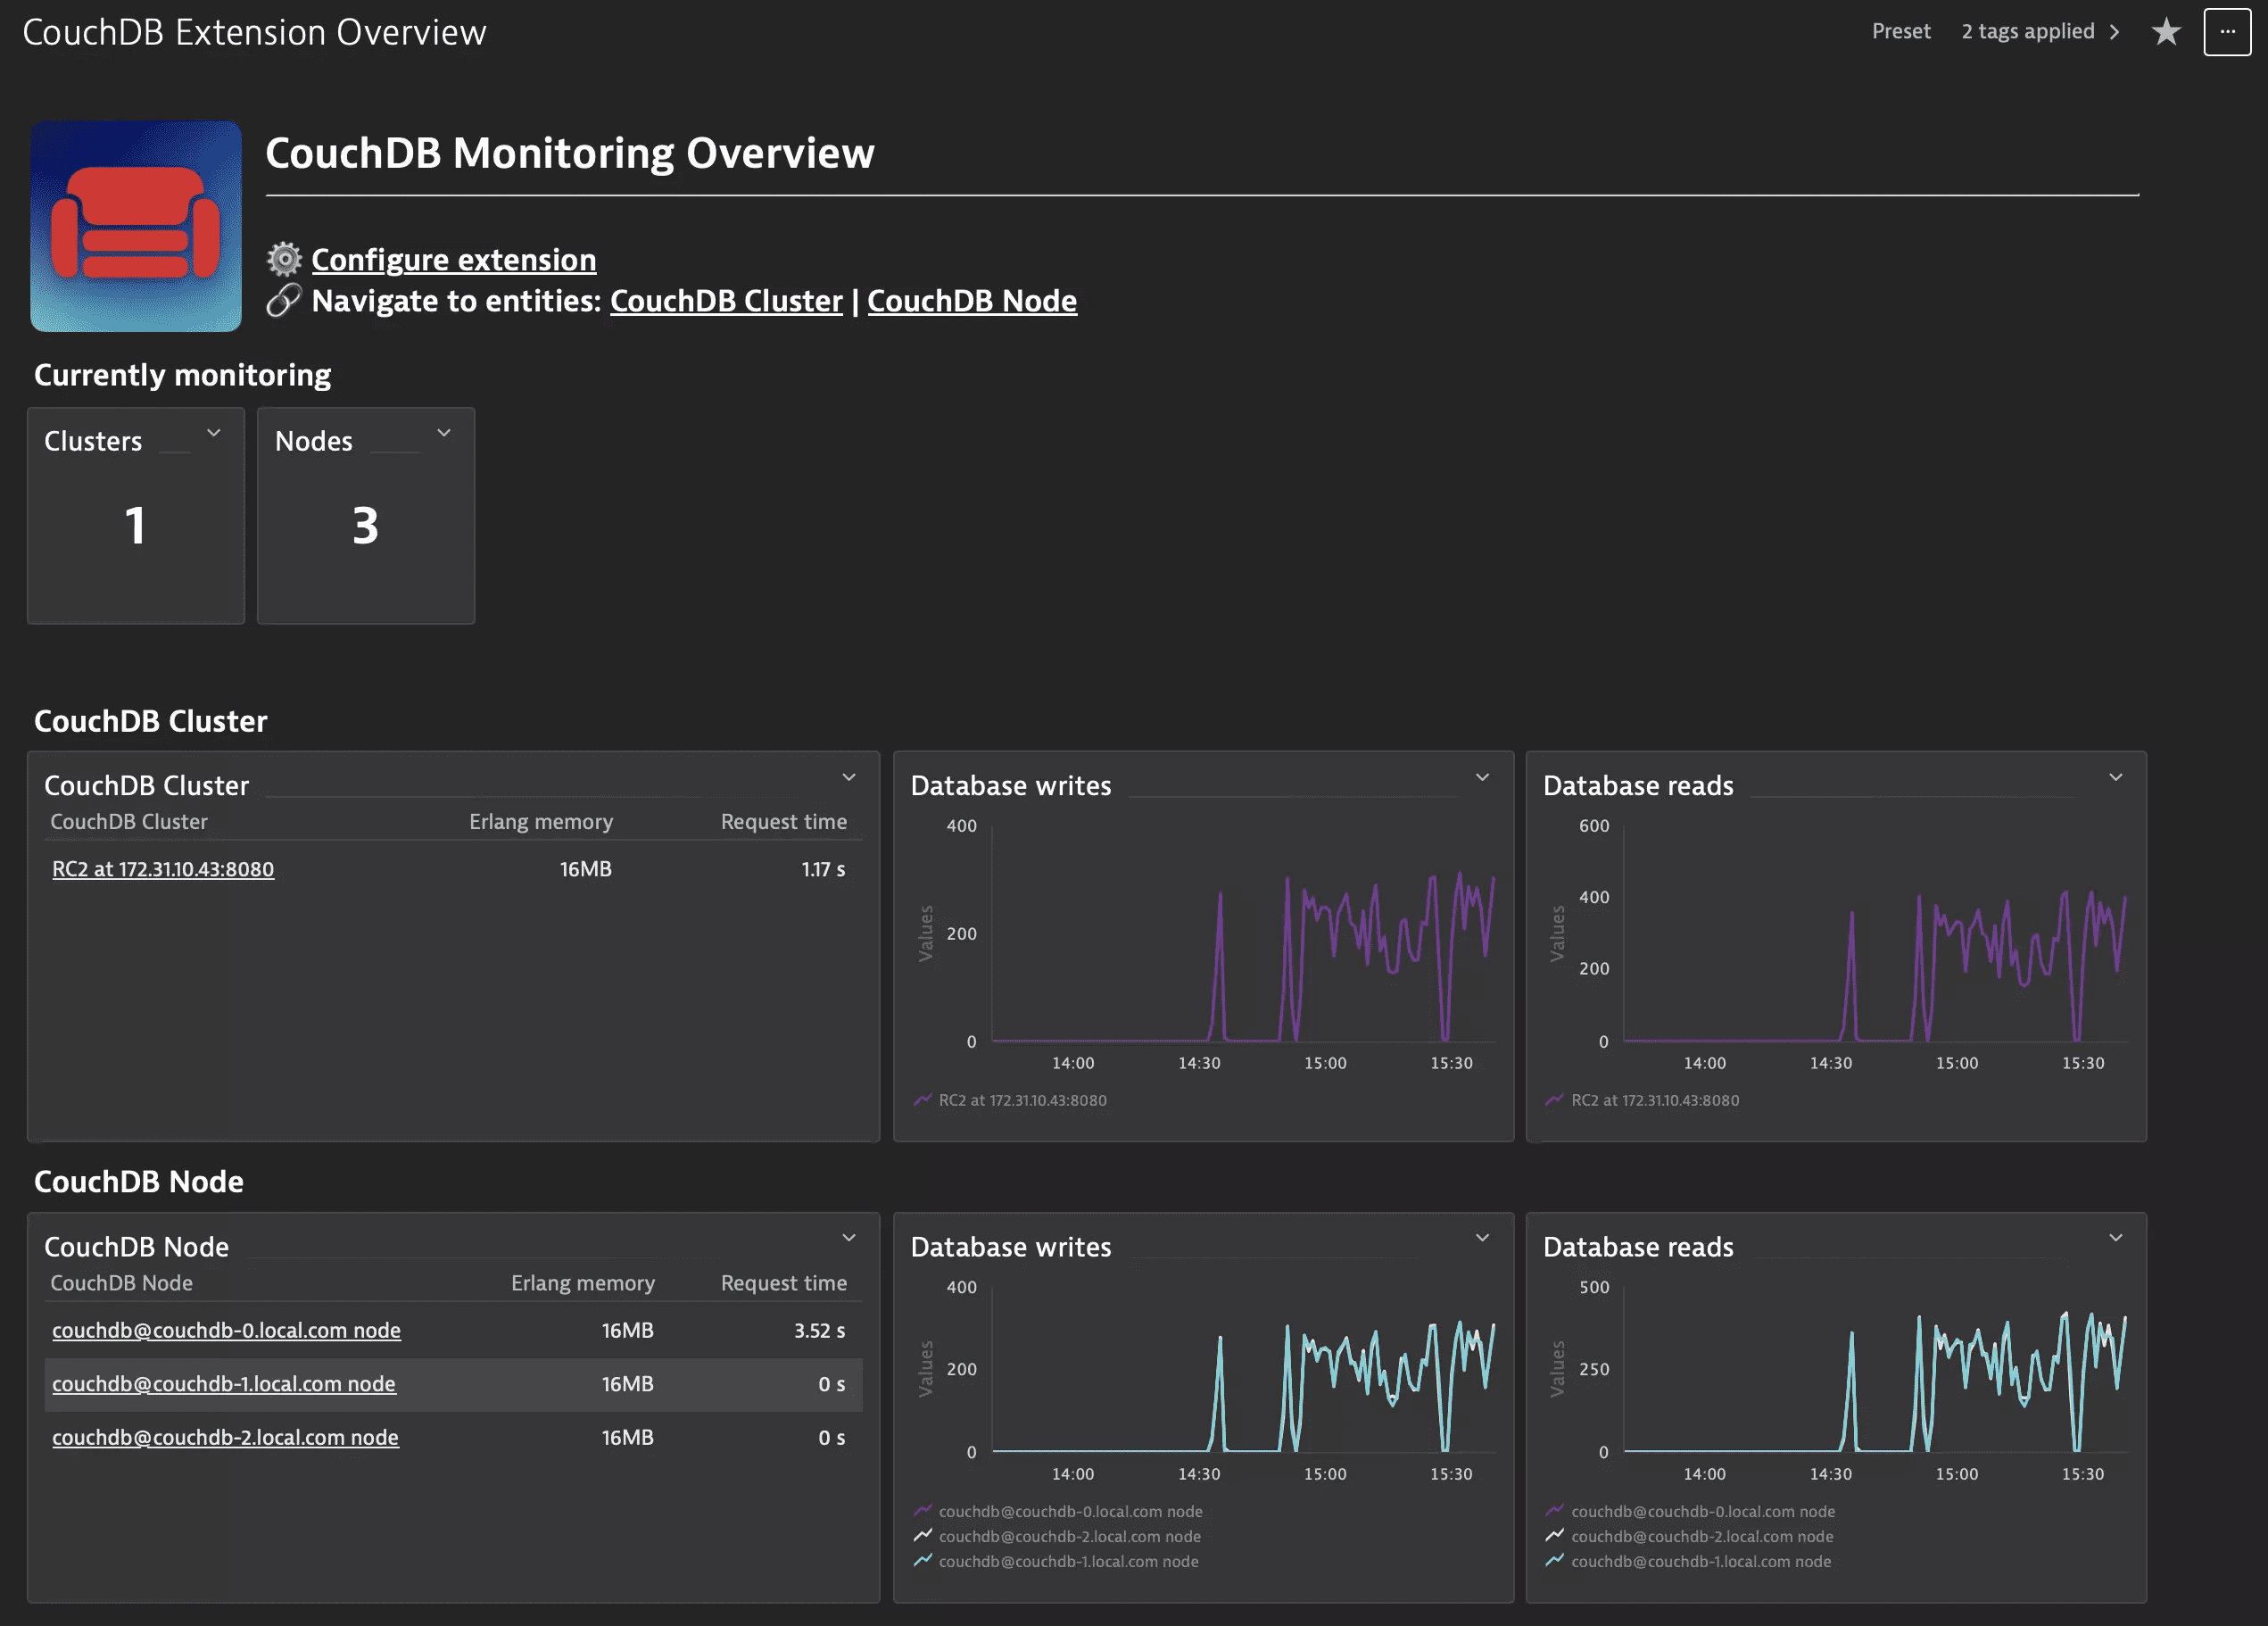
- In the Dynatrace menu, go to Dashboards.
- Select the "CouchDB Extension Overview" dashboard.
- This dashboard provides an overview of the CouchDB clusters and nodes that are being monitored in your environment.
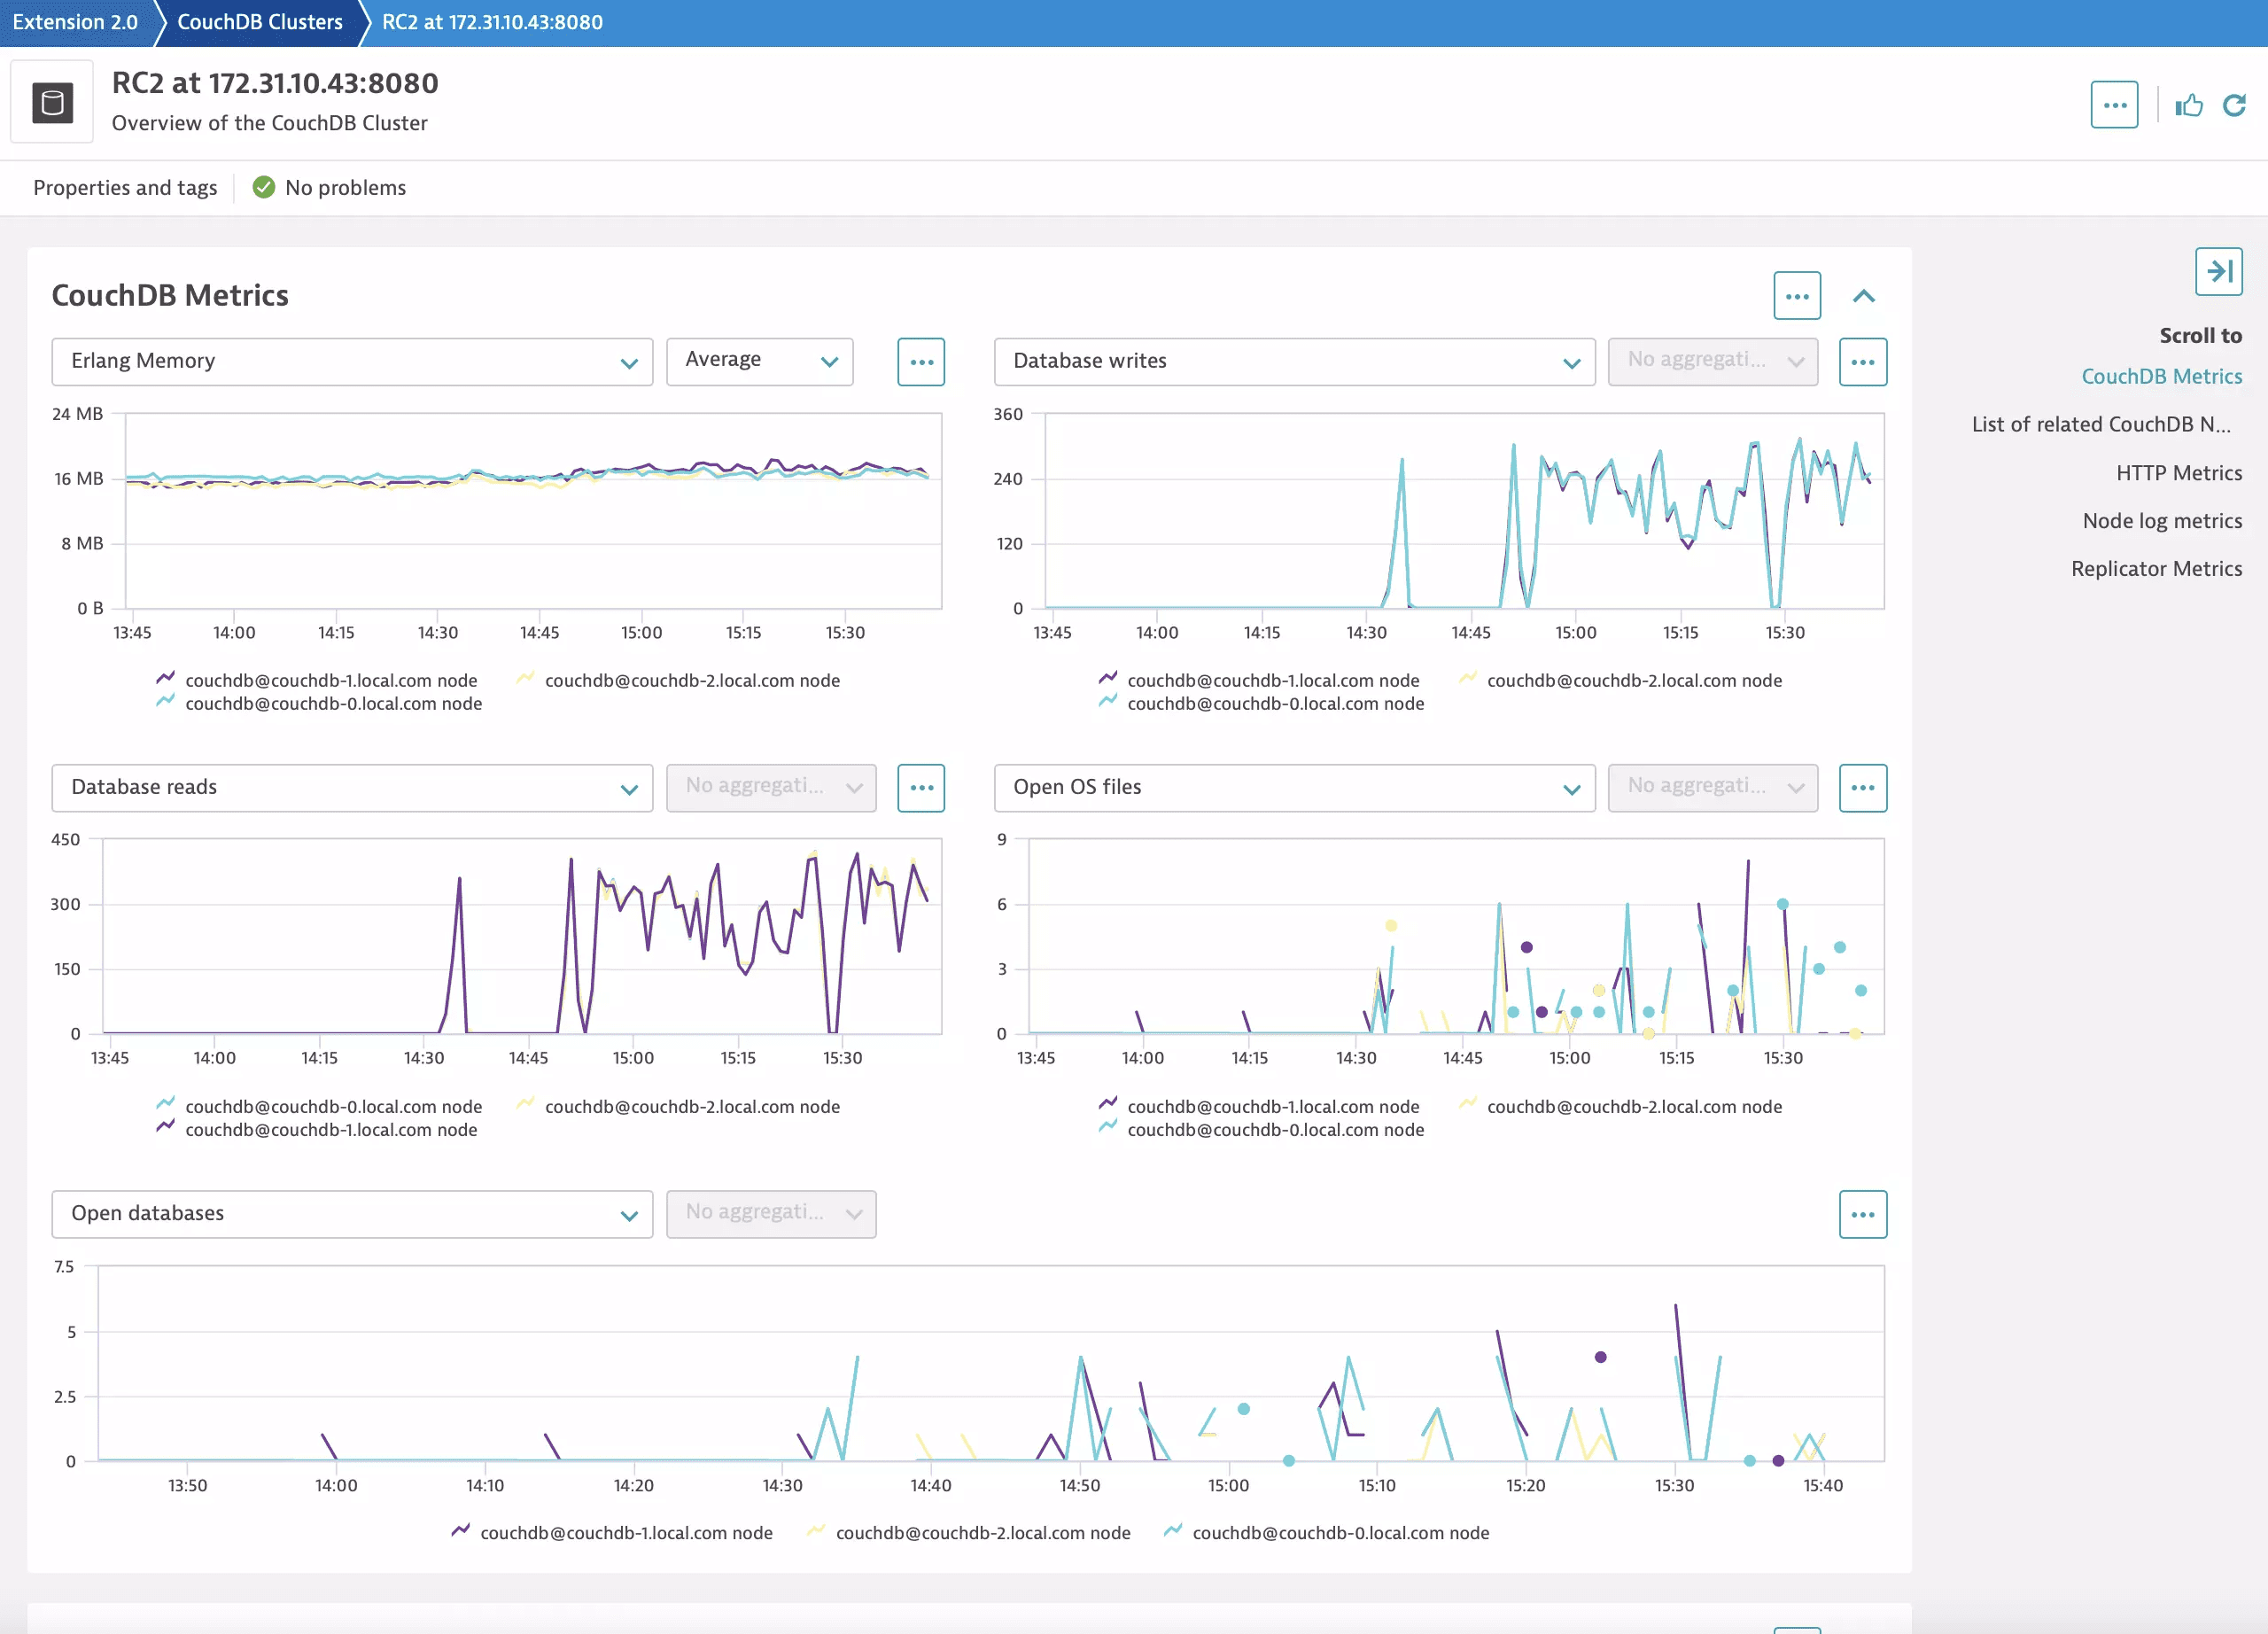
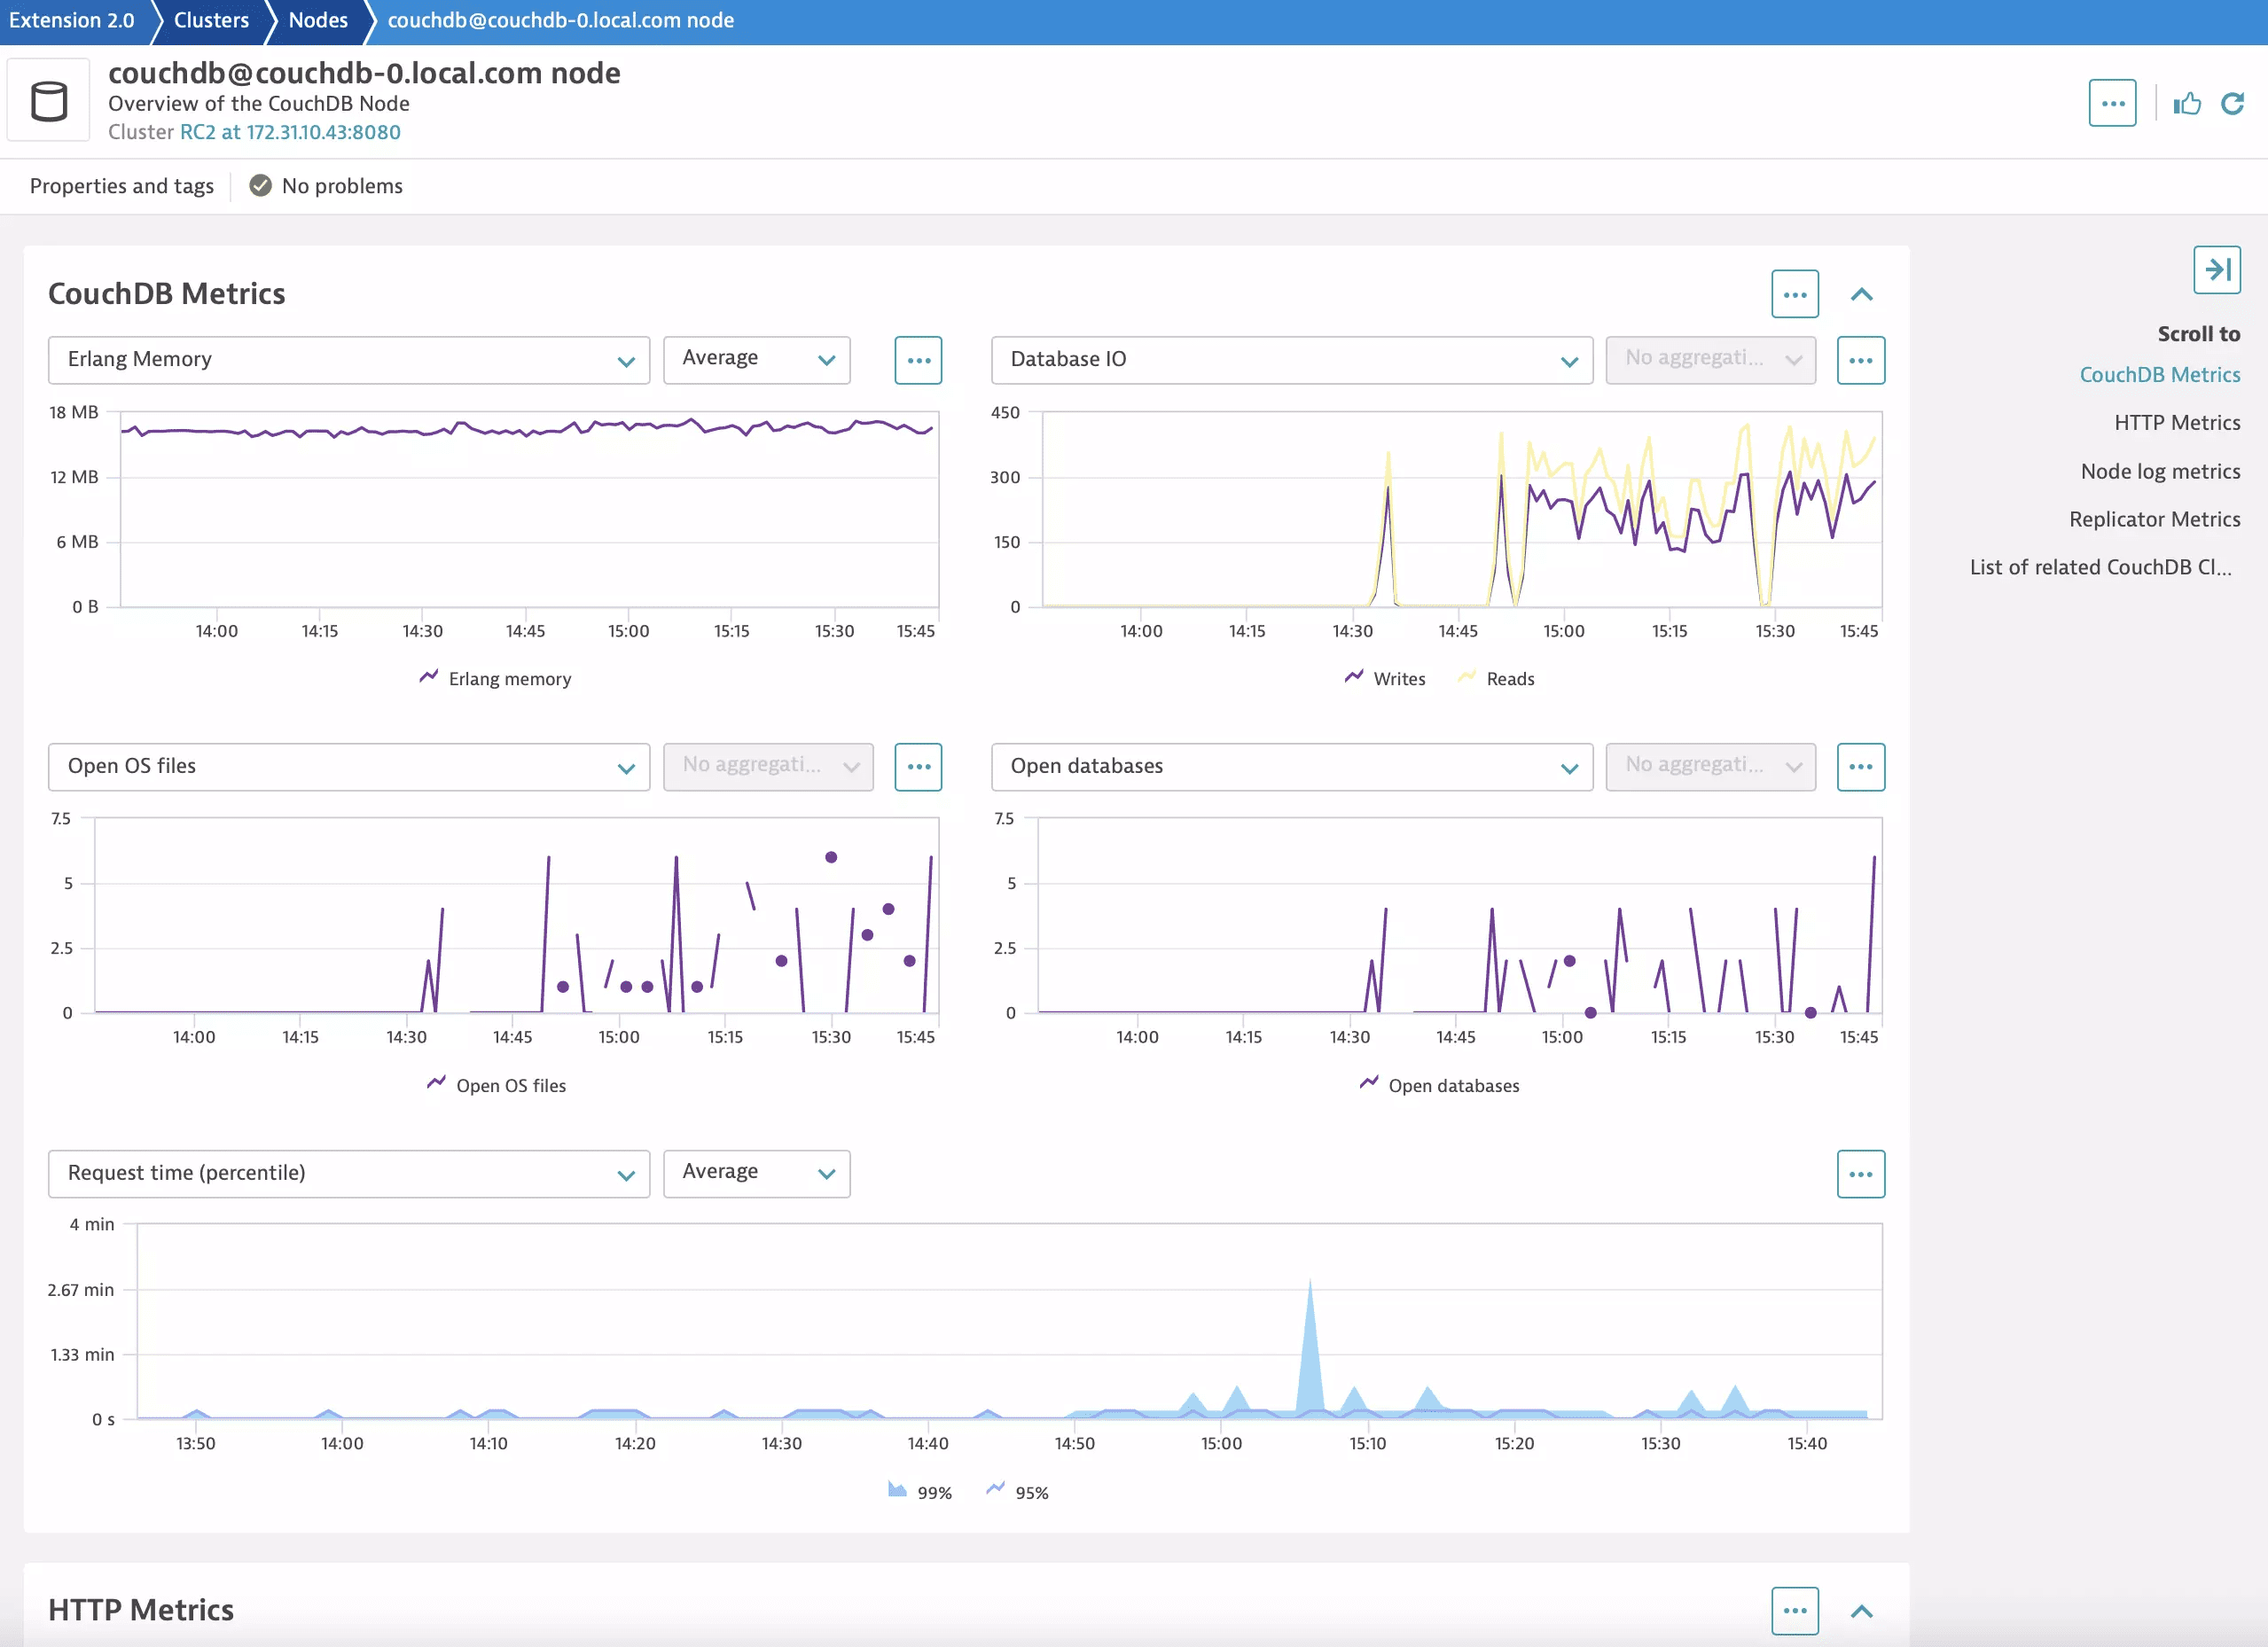
- Select the link to "Cluster" and "Node" to get a list of all clusters and nodes being monitored.
- Select an individual cluster or node for detailed metrics.
Access to the Dashboard is also available from the Extension configuration screen by selecting the green "Go to Dashboard" button.
DQL and Logs
Activate log monitoring to get full log insight.
Feature sets
When activating your extension using monitoring configuration, you can limit monitoring to one of the feature sets. To work properly the extension has to collect at least one metric after the activation.
In highly segmented networks, feature sets can reflect the segments of your environment. Then, when you create a monitoring configuration, you can select a feature set and a corresponding ActiveGate group that can connect to this particular segment.
All metrics that aren't categorized into any feature set are considered to be the default and are always reported.
A metric inherits the feature set of a subgroup, which in turn inherits the feature set of a group. Also, the feature set defined on the metric level overrides the feature set defined on the subgroup level, which in turn overrides the feature set defined on the group level.
base metrics
| Metric name | Metric key | Description |
|---|---|---|
| Database reads | couchdb.couchdb_database_reads_total.count | Number of times a document was read from a database. |
| Database writes | couchdb.couchdb_database_writes_total.count | Number of times a database was changed. |
| HTTP bulk requests | couchdb.couchdb_httpd_bulk_requests_total.count | Number of bulk requests. |
| HTTP request methods | couchdb.couchdb_httpd_request_methods.count | Split by Method for COPY, DELTETE, GET, HEAD, POST and PUT metrics |
| HTTP status codes | couchdb.couchdb_httpd_status_codes | Split by 'Reponse code' for status code breadown |
| HTTP temporary view reads | couchdb.couchdb_httpd_temporary_view_reads_total.count | Number of requests to the temporary view indexes. |
| HTTP view reads | couchdb.couchdb_httpd_view_reads_total.count | Number of requests to the view indexes. |
| HTTP view timeouts | couchdb.couchdb_httpd_view_timeouts_total.count | — |
| Open databases | couchdb.couchdb_open_databases_total.count | Number of open databases. |
| Open OS files | couchdb.couchdb_open_os_files_total.count | Number of file descriptors CouchDB has open. |
| Request time | couchdb.couchdb_request_time_seconds | — |
| — | couchdb.couchdb_request_time_seconds_count.gauge | — |
| — | couchdb.couchdb_request_time_seconds_sum | — |
| — | couchdb.couchdb_uptime_seconds | — |
default
| Metric name | Metric key | Description |
|---|---|---|
| Erlang memory | couchdb.couchdb_erlang_memory_bytes | — |
couchLog
| Metric name | Metric key | Description |
|---|---|---|
| Log requests total | couchdb.couchdb_couch_log_requests_total.count | — |
couchReplicator
| Metric name | Metric key | Description |
|---|---|---|
| Replicator changes manager deaths | couchdb.couchdb_couch_replicator_changes_manager_deaths_total.count | — |
| Replicator changes queue deaths | couchdb.couchdb_couch_replicator_changes_queue_deaths_total.count | — |
| Replicator changes reader deaths | couchdb.couchdb_couch_replicator_changes_reader_deaths_total.count | — |
| Replicator cluster is stable | couchdb.couchdb_couch_replicator_cluster_is_stable | — |
| Replicator connection owner crashes | couchdb.couchdb_couch_replicator_connection_owner_crashes_total.count | — |
| Replicator connection worker crashes | couchdb.couchdb_couch_replicator_connection_worker_crashes_total.count | — |
| Replicator jobs crashes | couchdb.couchdb_couch_replicator_jobs_crashes_total.count | — |
| Replicator jobs pending | couchdb.couchdb_couch_replicator_jobs_pending | — |
