Install the Dynatrace Service Broker for Cloud Foundry dashboard tile
- Latest Dynatrace
- 3-min read
- Published Aug 03, 2018
Find out how to install and configure the Dynatrace Service Broker for VMware Tanzu Platform dashboard tile (formerly Pivotal Platform), as well as how to set up application monitoring for the Dynatrace SaaS/Managed service by creating an instance of the service and binding it to an application.
Install the Dynatrace Service Broker tile
Install the Dynatrace Service Broker tile through your Ops Manager Installation Dashboard by performing the following steps:
- Download the product file from Broadcom Support.
- Upload the product file from the Ops Manager Installation Dashboard.
- Select Add next to the uploaded Dynatrace Service Broker tile in the Ops Manager Available Products view to add it to your staging area.
- Select the newly added Dynatrace Service Broker tile to open the configuration options.
- Select Save.
Configure the Dynatrace Service Broker tile
Multiple Dynatrace SaaS/Managed environments can be supported simultaneously.
To configure the Dynatrace Service Broker tile, perform the following steps:
-
In Tanzu Ops Manager, select the Dynatrace Service Broker tile to open its configuration options.
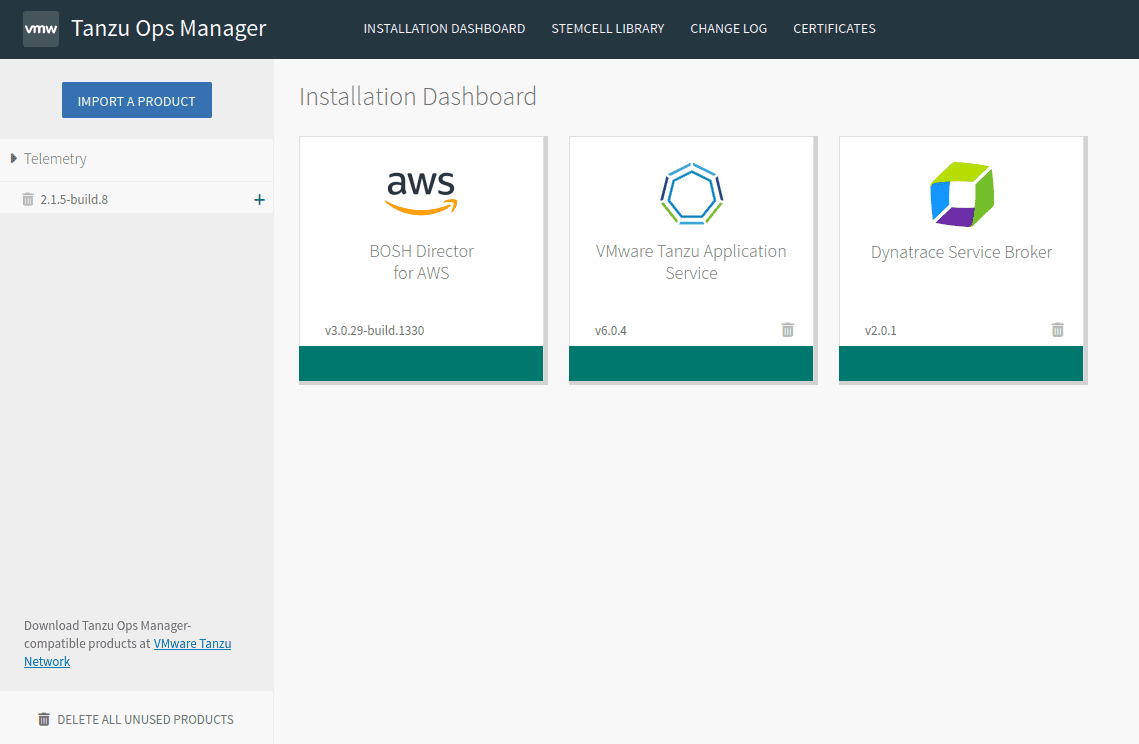 Pivotal 1
 -
Click Assign AZs and Networks to configure the network and availability zones.
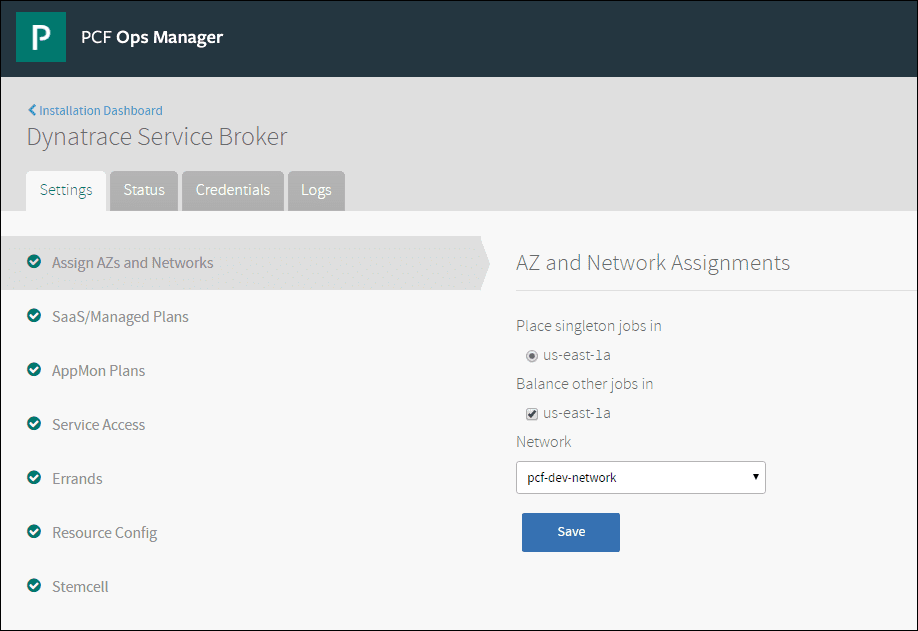 Pivotal 2
 -
Go to SaaS/Managed Plans, and select the Add button at the upper right to add a service plan.
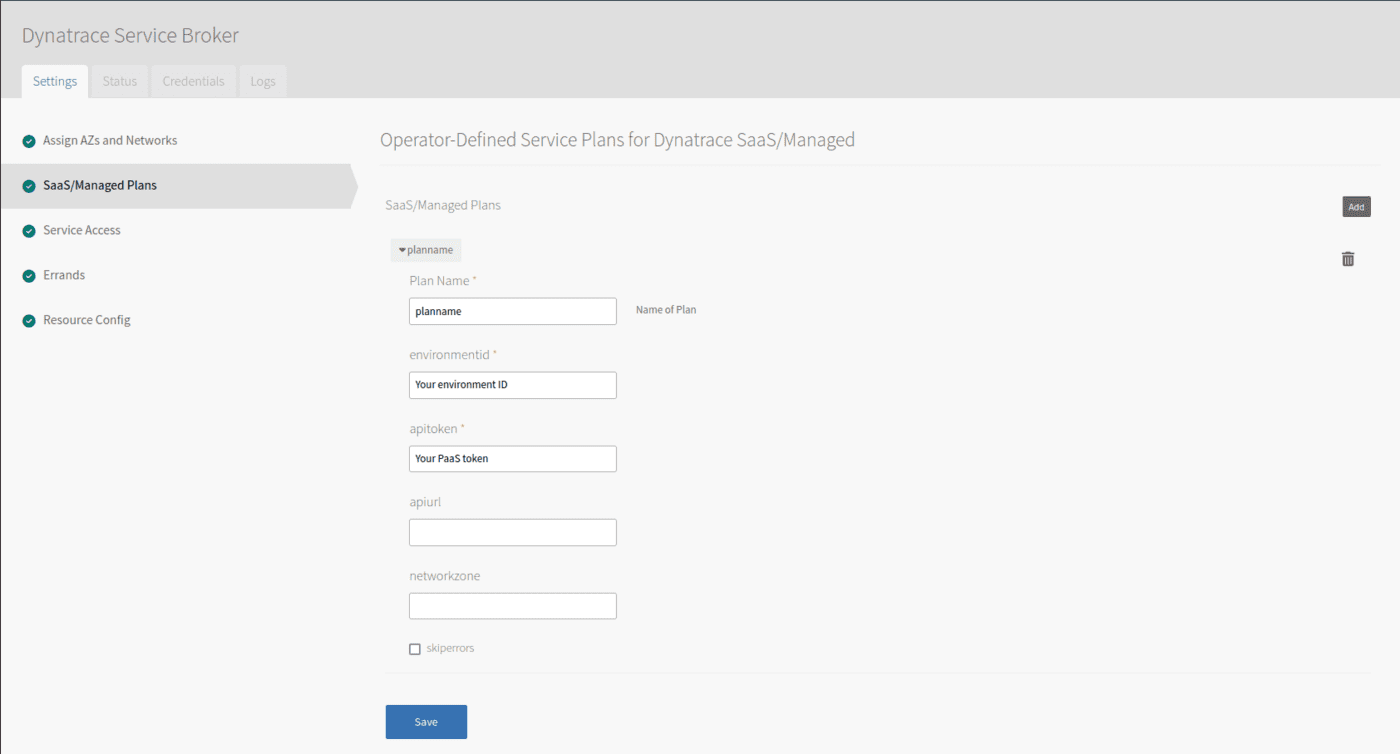 Pivotal 3
Perform the following steps to create and configure each service plan.
- Enter a
Plan Name. - Type your Environment ID and Paas token.
- Type your apiURL.
- Click Save.
Adapt the
apiurlsetting according to your environment:For Dynatrace SaaS, where OneAgent can connect to the internet
Replace the Dynatrace
ENVIRONMENTIDinhttps://ENVIRONMENTID.live.dynatrace.com/apiwith your own environment ID.For Dynatrace SaaS, where OneAgent can't connect to the internet
Use
https://YourActiveGateIP:Port/apiorFQDN:9999/e/<ENVIRONMENTID>/apito download the OneAgent, as well as to communicate OneAgent traffic through the ActiveGate. - Enter a
-
Click Apply Changes.
Set up application monitoring
To set up application monitoring with the Dynatrace SaaS/Managed Service, bind the service to an application in Apps Manager or use the cf CLI. Run the command below to pass the parameters.
-
Create a service instance based on the plan(s) you have configured.
cf create-service SERVICE PLAN SERVICE_INSTANCE- SERVICE needs to be
dynatrace. - PLAN depends on the plans that have been configured in Ops Manager; in the example above, this would be
planname. - SERVICE_INSTANCE is the name of the
cfservice that will be created and which you need to bind to the application.
- SERVICE needs to be
-
Bind the service to an application by using the cf CLI for example.
cf bind-service APP_NAME SERVICE_INSTANCE- APP_NAME: the name of your App.
- SERVICE_INSTANCE: the name of the Service Instance you have created with the command above.
After binding the service to an application, start using Dynatrace SaaS/Managed.