Set up metric events for alerting
- Latest Dynatrace
- How-to guide
- 10-min read
- Published Jan 08, 2021
After setting up Azure Monitor integration, you can start setting up and configuring metric events for alerting.
To configure metric events for alerting, go to Settings > Cloud and virtualization > Azure > Metric events for alerting > Manage alerting rules. On the Metric events for alerting page you can create, enable/disable, and configure recommended alerting rules.
For an overview of all recommended alerting rules for all cloud services, see the list below.
Predefined alerting rules per cloud service
| Name | Alerting rules |
|---|---|
| Azure Spring Apps | Azure Spring Apps system CPU usage (static threshold: above 95%), Azure Spring Apps process CPU usage (static threshold: above 95%). |
| Azure Blockchain Service | Azure Blockchain Service CPU usage percentage (static threshold: above 95%), Azure Blockchain Service memory usage percentage (static threshold: above 95%). |
| Azure Cache for Redis | Azure Redis memory usage % (Static threshold: above 95 %), Azure Redis CPU usage % (Static threshold: above 95 %) |
| Azure Redis (built-in) | Azure Redis CPU usage % (built-in) (Static threshold: above 95 %) |
| Azure Virtual Machine (classic) | Azure Virtual Machine (classic) percentage CPU (static threshold: above 95%). |
| Azure Storage Account (classic) | Azure Storage Account (classic) availability (static threshold: below 95%). |
| Azure Storage Blob Services (classic) | Azure Storage (classic) Blob Services availability (static threshold: below 95%). |
| Azure Storage File Services (classic) | Azure Storage (classic) File Services availability (static threshold: below 95%). |
| Azure Storage Queue Services (classic) | Azure Storage (classic) Queue Services availability (static threshold: below 95%). |
| Azure Storage Table Services (classic) | Azure Storage (classic) Table Services availability (static threshold: below 95%). |
| Azure Data Factory v2 | Azure Data Factory integration runtime CPU utilization (static threshold: above 95%). |
| Azure DB for MariaDB | Azure DB for MariaDB CPU percent (static threshold: above 95%), Azure DB for MariaDB memory percent (static threshold: above 95%), Azure DB for MariaDB IO percent (static threshold: above 95%), Azure DB for MariaDB server log storage percent (static threshold: above 95%), Azure DB for MariaDB storage percent (static threshold: above 95%). |
| Azure DB for MySQL | Azure DB for MySQL CPU percent (static threshold: above 95%), Azure DB for MySQL memory percent (static threshold: above 95%), Azure DB for MySQL IO percent (static threshold: above 95%), Azure DB for MySQL server log storage percent (static threshold: above 95%), Azure DB for MySQL storage percent (static threshold: above 95%). |
| Azure DB for PostgreSQL - Flexible Server | Azure DB for PostgreSQL (Flexible) CPU percent (Static threshold: above 95 %), Azure DB for PostgreSQL (Flexible) memory percent (Static threshold: above 95 %), Azure DB for PostgreSQL (Flexible) storage percent (Static threshold: above 95 %) |
| Azure DB for PostgreSQL - Server | Azure DB for PostgreSQL CPU percent (static threshold: above 95%), Azure DB for PostgreSQL memory percent (static threshold: above 95%), Azure DB for PostgreSQL IO percent (static threshold: above 95%), Azure DB for PostgreSQL server log storage percent (static threshold: above 95%), Azure DB for PostgreSQL storage percent (static threshold: above 95%). |
| Azure DB for PostgreSQL - Hyperscale | Azure DB for PostgreSQL CPU percent (static threshold: above 95%), Azure DB for PostgreSQL memory percent (static threshold: above 95%), Azure DB for PostgreSQL storage percent (static threshold: above 95%). |
| Azure Event Hubs Cluster | Azure Event Hubs CPU usage (static threshold: above 95%), Azure Event Hubs available memory (static threshold: below 5%). |
| Azure Application Insights | Azure Application Insights availability (static threshold: below 95%), Azure Application Insights process CPU (static threshold: above 95%), Azure Application Insights processor time (static threshold: above 95%). |
| Azure Key Vault | Azure Key Vault availability (static threshold: below 95%), Azure Key Vault saturation (static threshold: above 95%). |
| Azure Data Explorer Cluster | Azure Data Explorer Cluster cache utilization (static threshold: above 95%), Azure Data Explorer Cluster ingestion utilization (static threshold: above 95%), Azure Data Explorer Cluster CPU (static threshold: above 95%), Azure Data Explorer Cluster Export utilization (static threshold: above 95%). |
| Azure Integration Service Environment | Azure ISE run failure percentage (static threshold: above 5%), Azure ISE workflow processor usage (static threshold: above 95%), Azure ISE workflow memory usage (static threshold: above 95%). |
| Azure Logic Apps | Azure Logic Apps run failure percentage (static threshold: above 5%). |
| Azure Machine Learning Workspace | Azure Machine Learning CPU utilization (static threshold: above 95%), Azure Machine Learning GPU utilization (static threshold: above 95%), Azure Machine Learning quota utilization percentage (static threshold: above 95%). |
| Azure Maps Account | Azure Maps Account availability (static threshold: below 95%). |
| Azure Application Gateway (built-in) | Azure Application Gateway unhealthy hosts (built-in) (Static threshold: above 0 ), Azure Application Gateway failed requests (built-in) (Auto-adaptive baseline) |
| Azure Application Gateway | Azure Application Gateway unhealthy hosts count (Static threshold: above 0 ), Azure Application Gateway failed requests (Auto-adaptive baseline) |
| Azure Firewall | Azure Firewall health state (static threshold: below 95%), Azure Firewall SNAT port utilization (static threshold: above 95%). |
| Azure ExpressRoute Circuit | Azure ExpressRoute Circuit BGP availability (static threshold: below 95%), Azure ExpressRoute Circuit ARP availability (static threshold: below 95%). |
| Azure Front Door | Azure Front Door backend health percentage (static threshold: below 95%). |
| Azure Connection Monitors | Azure NetworkWatchers probes failed percent (static threshold: above 5%). |
| Azure Connection Monitors Preview | Azure NetworkWatchers probes failed percent (static threshold: above 5%), Azure NetworkWatchers checks failed percent (static threshold: above 5%). |
| Azure Public IP Address | Azure Public IP Address data path availability (static threshold: below 95%). |
| Azure Power BI Embedded | Azure Power BI embedded memory thrashing (datasets) (static threshold: above 95%). |
| Azure Search Service | Azure Search Service throttled search queries (static threshold: above 5%). |
| Azure Mesh Application | Azure Mesh Application CPU utilization (static threshold: above 95%), Azure Mesh Application memory utilization (static threshold: above 95%). |
| Azure SignalR | Azure SignalR user errors (static threshold: above 5%), Azure SignalR system errors (static threshold: above 5%). |
| Azure SQL (built-in) | Azure SQL Database CPU usage % (built-in) (Static threshold: above 95 %), Azure SQL Database used data space (built-in) (Static threshold: above 95 %) |
| Azure SQL Managed Instance | Azure SQL Managed Instance CPU usage (static threshold: above 95%). |
| Azure SQL Data Warehouse (legacy) | Azure SQL Data Warehouse CPU usage percentage (static threshold: above 95%), Azure SQL Data Warehouse memory percentage (static threshold: above 95%), Azure SQL Data Warehouse Data IO percentage (static threshold: above 95%), Azure SQL Data Warehouse DWU percentage (static threshold: above 95%). |
| Azure SQL Database (DTU) | Azure SQL Database CPU usage % (Static threshold: above 95 %), Azure SQL Database used data space (Static threshold: above 95 %) |
| Azure SQL Database - Hyperscale | Azure SQL Hyperscale Database CPU usage percentage (static threshold: above 95%), Azure SQL Hyperscale server process core percent (static threshold: above 95%), Azure SQL Hyperscale server process memory percent (static threshold: above 95%), Azure SQL Hyperscale Database Sessions percentage (static threshold: above 95%), Azure SQL Hyperscale Database Data IO percentage (static threshold: above 95%), Azure SQL Hyperscale Database Log IO percentage (static threshold: above 95%), Azure SQL Hyperscale Database In - memory OLTP storage percent (static threshold: above 95%), Azure SQL Hyperscale Database Workers percentage (static threshold: above 95%). |
| Azure SQL Database (vCore) | Azure SQL Database CPU usage % (Static threshold: above 95 %), Azure SQL Database used data space (Static threshold: above 95 %) |
| Azure Stream Analytics Job | Azure Stream Analytics job resource utilization (static threshold: above 95%). |
| Azure SQL Pool | Azure Analytics Services DWU used percentage (static threshold: above 95%), Azure Analytics Services Local tempdb used percentage (static threshold: above 95%), Azure Analytics Services memory used percentage (static threshold: above 95%), Azure Analytics Services workload group allocation by system percent (static threshold: above 95%), Azure Analytics Services workload group allocation by max resource percent (static threshold: above 95%). |
| Azure App Service Environment v2 | Azure App Service Environment CPU percentage (static threshold: above 95%), Azure App Service Environment memory percentage (static threshold: above 95%) |
| Azure App Service Plan | Azure App Service CPU percentage (static threshold: above 95%), Azure App Service memory percentage (static threshold: above 95%). |
| Azure API Management Service | Api Management capacity (Static threshold: above 95 %) |
| Azure Storage Blob Services | Azure Storage Blob Services availability (Static threshold: below 95%) |
| Azure Storage File Services | Azure Storage File Services availability (Static threshold: below 95%) |
| Azure Storage Queue Services | Azure Storage Queue Services availability (Static threshold: below 95%) |
| Azure Storage Table Services | Azure Storage Table Services availability (Static threshold: below 95%) |
| Azure Storage Account | Azure Storage Account availability (Static threshold: below 95 %) |
Add a service to monitoring
The number of recommended alerting rules depends on the number of your monitored cloud services.
To add recommended alerting rules for a new cloud service, you first need to add the new service to monitoring.
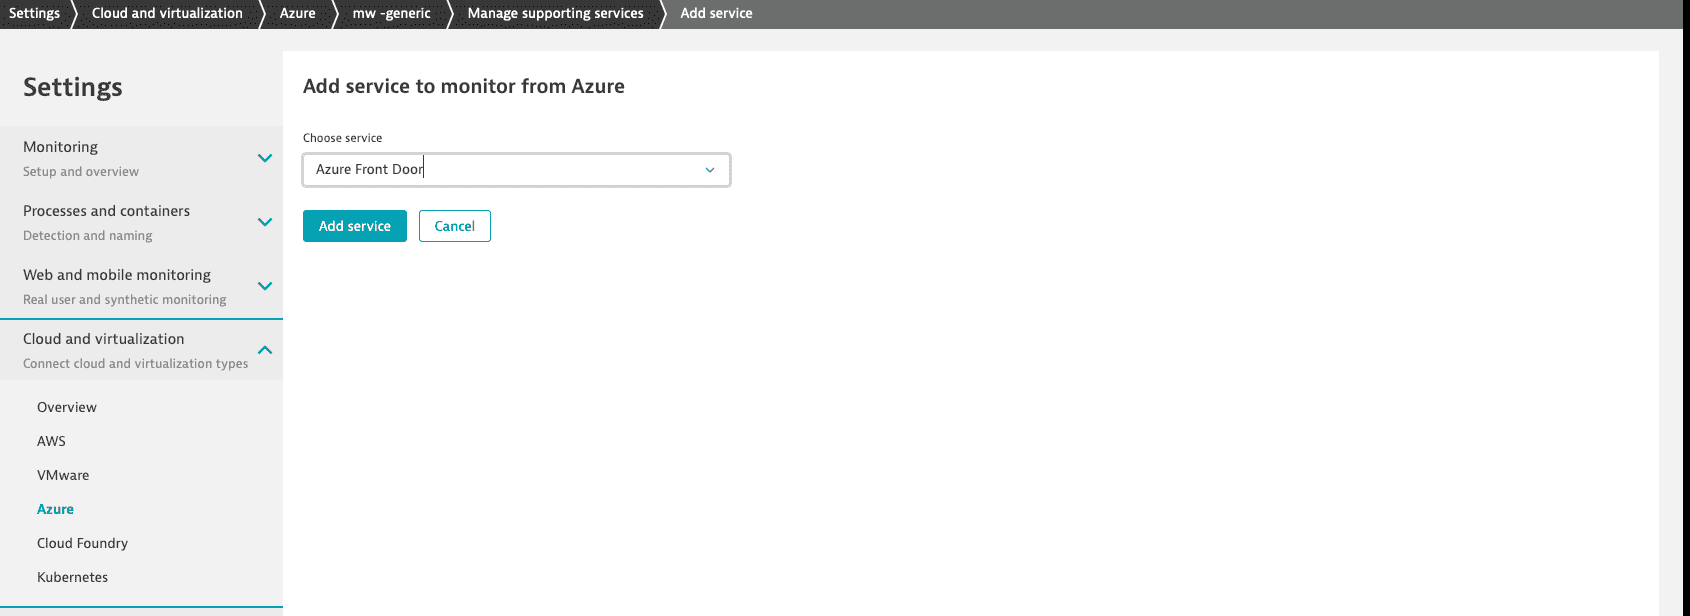
To add a service to monitoring,
- Go to Settings.
- In Cloud and virtualization, select Azure.
- On the Azure overview page, select Edit for the desired Azure instance.
- Go to Services and select Add service, choose the desired service name from the list, and select Add service.
- Select Save changes.
Not all cloud services have their own predefined alerting rules.
Create and enable alerting rules
Not applicable to new Dynatrace environments created after January 26, 2026.
To enable recommended alerting rules, you first need to create them. You can create alerting rules and automatically enable them, or (if you clear Automatically enable created rules) create them and manually enable them after possible configuration changes.
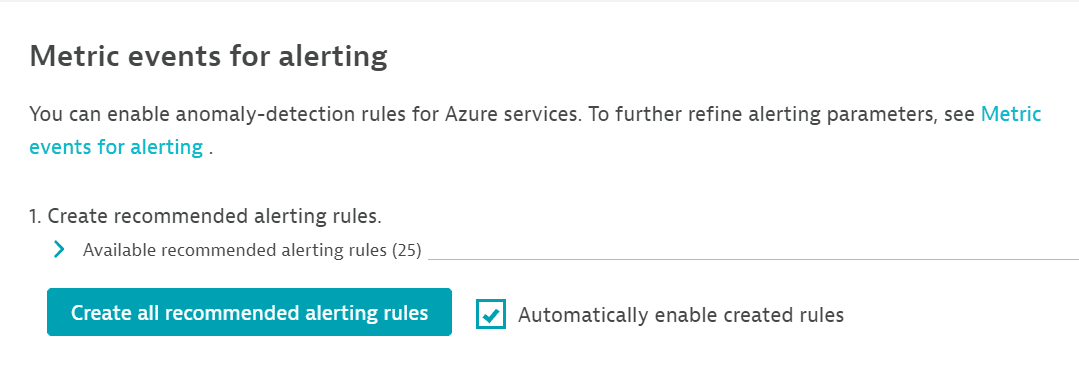
For example, you can create and automatically enable a first batch of alerts. When you start monitoring new services, you can create alerts for these new services without automatically enabling them (because you want to configure them first).
Configure alerting rules
Not applicable to new Dynatrace environments created after January 26, 2026.
How you edit rules depends on whether you chose to automatically enable alerts.
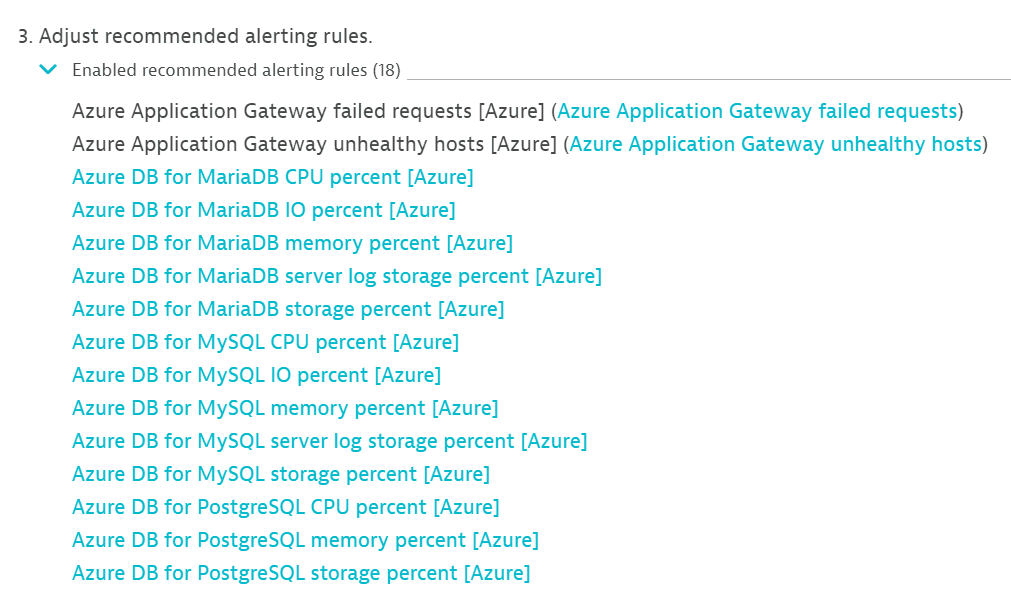
- If you chose to automatically enable alerts when creating them, go to Adjust recommended alerting rules, expand Enabled recommended alerting rules, and select any rule. This takes you to Edit custom event for alerting, where you can change the configuration rules for that specific service.
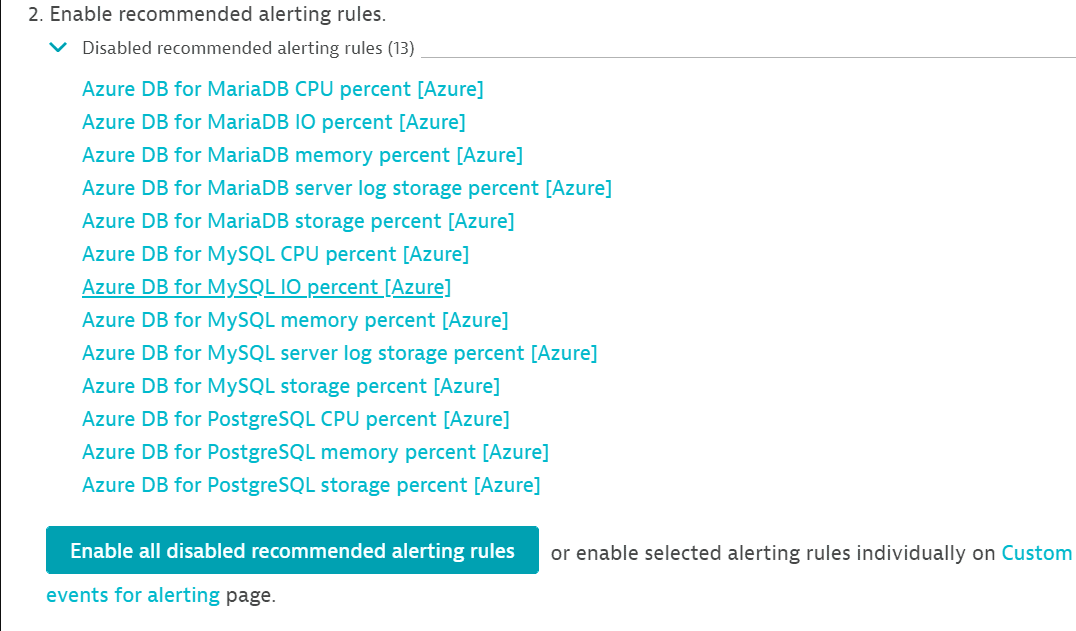
- If you didn't choose to automatically enable alerts when creating them, go to Enable recommended alerting rules, expand Disabled recommended alerting rules, and select any of the disabled rules. This takes you to the same Edit custom event for alerting page.
Disable alerting rules
Not applicable to new Dynatrace environments created after January 26, 2026.
You can disable all alerting rules, or disable or delete them selectively.
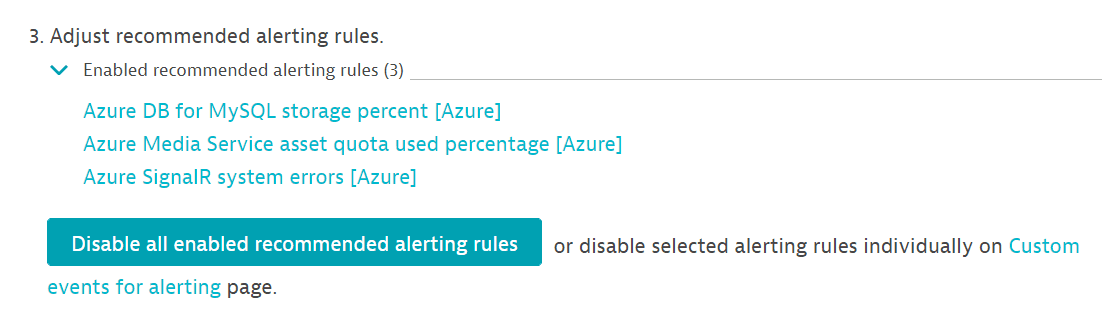
- To disable all alerting rules, go to Adjust recommended alerting rules and select Disable all enabled recommended alerting rules.
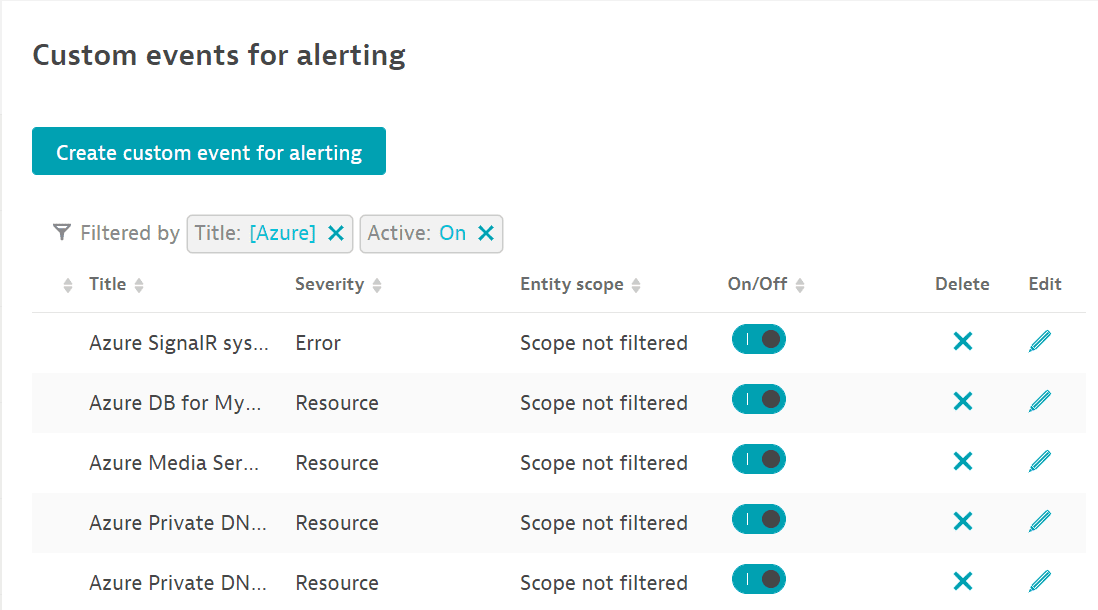
- To disable or delete alerting rules selectively, go to Adjust recommended alerting rules and select Metric events. On the Metric events page, you can disable an alert by turning it off in the On/Off column, or you can delete it by selecting
xin the Delete column.
If you disable any or all of the alerting rules, you can always re-enable them.