Azure AI - All In One monitoring
- Latest Dynatrace
- How-to guide
- 2-min read
- Published Sep 22, 2020
Dynatrace ingests metrics from Azure Metrics API for All In One. You can view metrics for each service instance, split metrics into multiple dimensions, and create custom charts that you can pin to your dashboards.
Prerequisites
- Dynatrace version 1.203+
- Environment ActiveGate version 1.195+
Enable monitoring
To learn how to enable service monitoring, see Enable service monitoring.
View service metrics
You can view the service metrics in your Dynatrace environment either on the custom device overview page or on your Dashboards page.
View metrics on the custom device overview page
To access the custom device overview page
- Go to Technologies & Processes (previous Dynatrace) or
 Technologies & Processes Classic.
 - Filter by service name and select the relevant custom device group.
- Once you select the custom device group, you're on the custom device group overview page.
- The custom device group overview page lists all instances (custom devices) belonging to the group. Select an instance to view the custom device overview page.
View metrics on your dashboard
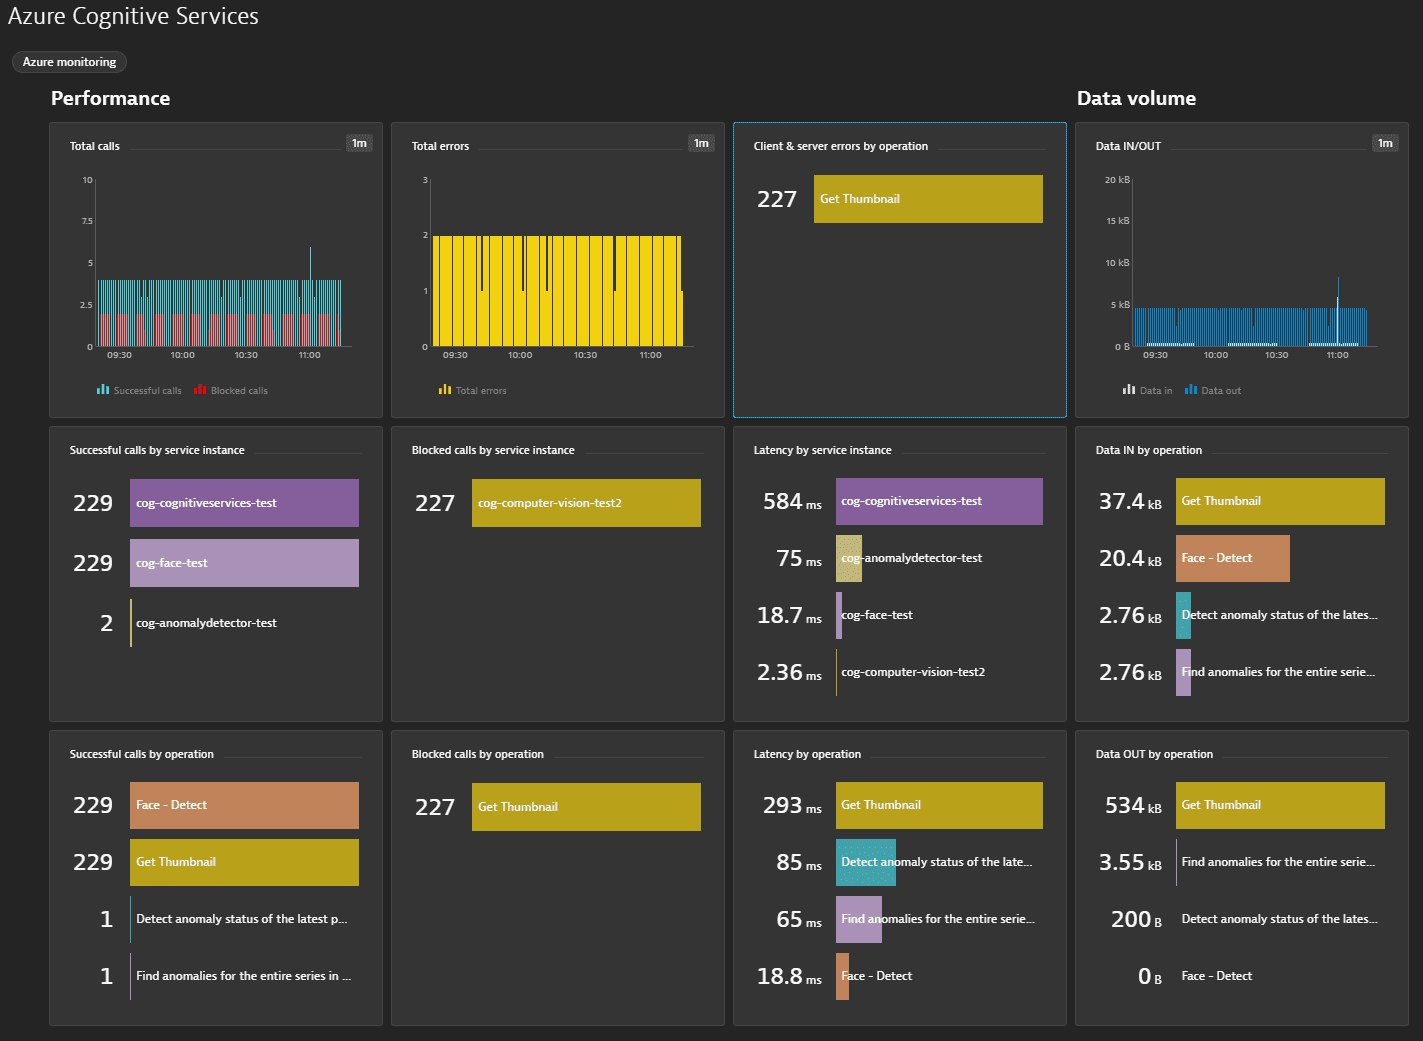
If the service has a preset dashboard, you'll get a preset dashboard for the respective service containing all recommended metrics on your Dashboards page. You can look for specific dashboards by filtering by Preset and then by Name.
For existing monitored services, you might need to resave your credentials for the preset dashboard to appear on the Dashboards page. To resave your credentials, go to Settings > Cloud and virtualization > Azure, select the desired Azure instance, then select Save.
You can't make changes on a preset dashboard directly, but you can clone and edit it. To clone a dashboard, open the browse menu (…) and select Clone.
To remove a dashboard from the dashboards list, you can hide it. To hide a dashboard, open the browse menu (…) and select Hide.
Hiding a dashboard doesn't affect other users.

Available metrics
| Name | Description | Dimensions | Unit | Recommended |
|---|---|---|---|---|
| BlockedCalls | Number of calls that exceeded rate or quota limit | ApiName, OperationName, Region | Count | |
| CharactersTrained | Total number of characters trained | ApiName, OperationName, Region | Count | |
| CharactersTranslated | Total number of characters in incoming text request | ApiName, OperationName, Region | Count | |
| ClientErrors | Number of calls with client side error (HTTP response code 4xx) | ApiName, OperationName, Region | Count | |
| DataIn | Size of incoming data in bytes | ApiName, OperationName, Region | Byte | |
| DataOut | Size of outgoing data in bytes | ApiName, OperationName, Region | Byte | |
| Latency | Latency in milliseconds | ApiName, OperationName, Region | MilliSecond | |
| ServerErrors | Number of calls with service internal error (HTTP response code 5xx) | ApiName, OperationName, Region | Count | |
| SuccessfulCalls | Number of successful calls | ApiName, OperationName, Region | Count | |
| TotalCalls | Total number of calls | ApiName, OperationName, Region | Count | |
| TotalErrors | Total number of calls with error response (HTTP response code 4xx or 5xx) | ApiName, OperationName, Region | Count | |
| TotalTokenCalls | Total number of token calls | ApiName, OperationName, Region | Count | |
| TotalTransactions | Total number of transactions | Count |