Enable Azure Monitor App Service Environment V2 metrics
- Latest Dynatrace
- How-to guide
- 2-min read
- Published Jun 29, 2022
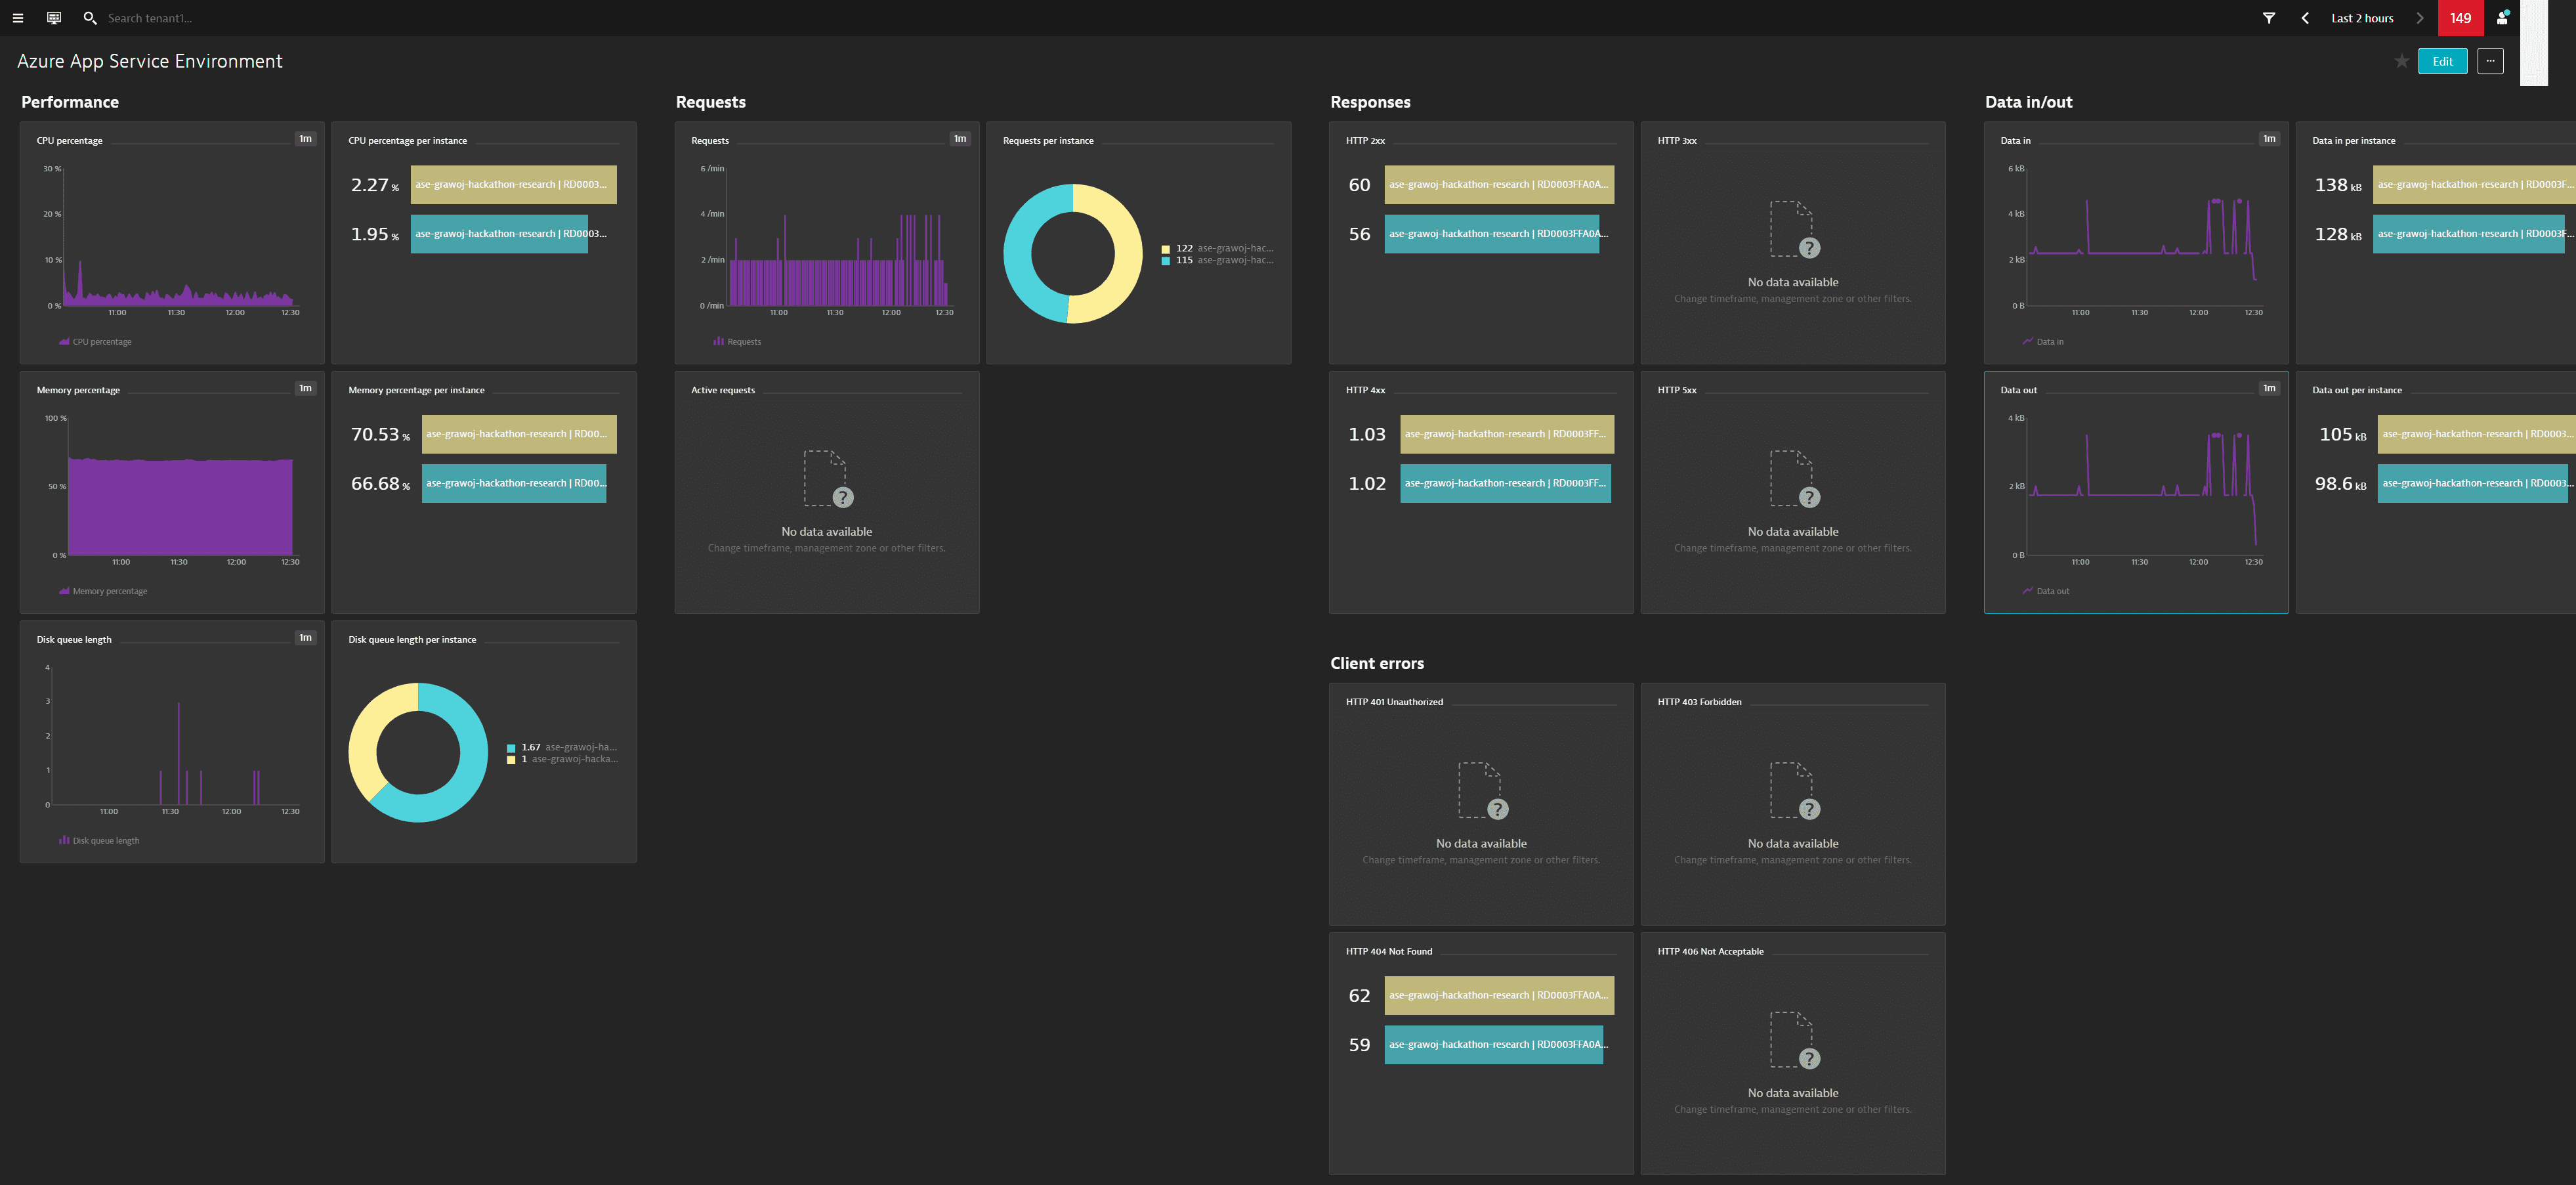
Dynatrace ingests metrics from the Azure Metrics API for Azure App Service Environment v2. You can view metrics for each service instance, split metrics into multiple dimensions, and create custom charts that you can pin to your dashboards.
Prerequisites
- Dynatrace version 1.201+
- Environment ActiveGate version 1.195+
Only App Service Environment v2 can be monitored by Dynatrace.
To monitor App Service Environment v1, contact a Dynatrace product expert via live chat.
Enable monitoring
To learn how to enable service monitoring, see Enable service monitoring.
View service metrics
You can view the service metrics in your Dynatrace environment either on the custom device overview page or on your Dashboards page.
View metrics on the custom device overview page
To access the custom device overview page
- Go to Technologies & Processes (previous Dynatrace) or
 Technologies & Processes Classic.
 - Filter by service name and select the relevant custom device group.
- Once you select the custom device group, you're on the custom device group overview page.
- The custom device group overview page lists all instances (custom devices) belonging to the group. Select an instance to view the custom device overview page.
View metrics on your dashboard
If the service has a preset dashboard, you'll get a preset dashboard for the respective service containing all recommended metrics on your Dashboards page. You can look for specific dashboards by filtering by Preset and then by Name.
For existing monitored services, you might need to resave your credentials for the preset dashboard to appear on the Dashboards page. To resave your credentials, go to Settings > Cloud and virtualization > Azure, select the desired Azure instance, then select Save.
You can't make changes on a preset dashboard directly, but you can clone and edit it. To clone a dashboard, open the browse menu (…) and select Clone.
To remove a dashboard from the dashboards list, you can hide it. To hide a dashboard, open the browse menu (…) and select Hide.
Hiding a dashboard doesn't affect other users.

Available metrics
| Name | Description | Dimensions | Unit | Recommended |
|---|---|---|---|---|
| ActiveRequests | Active requests | Instance | Count | |
| CpuPercentage | CPU percentage | Instance | Percent | |
| BytesReceived | Data in | Instance | Byte | |
| BytesSent | Data out | Instance | Byte | |
| DiskQueueLength | Disk queue length | Instance | Count | |
| Http101 | HTTP 101 | Instance | Count | |
| Http2xx | HTTP 2xx | Instance | Count | |
| Http3xx | HTTP 3xx | Instance | Count | |
| Http401 | HTTP 401 | Instance | Count | |
| Http403 | HTTP 403 | Instance | Count | |
| Http404 | HTTP 404 | Instance | Count | |
| Http406 | HTTP 406 | Instance | Count | |
| Http4xx | HTTP 4xx | Instance | Count | |
| Http5xx | HTTP 5xx | Instance | Count | |
| HttpQueueLength | HTTP queue length | Instance | Count | |
| LargeAppServicePlanInstances | Large app service plan workers | Count | ||
| MediumAppServicePlanInstances | Medium app service plan workers | Count | ||
| MemoryPercentage | Memory percentage | Instance | Percent | |
| Requests | Requests | Instance | Count | |
| SmallAppServicePlanInstances | Small app service plan workers | Count | ||
| TotalFrontEnds | Total frontends | Count |