Azure Integration Service Environment monitoring

Dynatrace ingests metrics for multiple preselected namespaces, including Azure Integration Service Environment. You can view metrics for each service instance, split metrics into multiple dimensions, and create custom charts that you can pin to your dashboards.

Prerequisites

  • Dynatrace version 1.200+
  • Environment ActiveGate version 1.198+

Enable monitoring

To learn how to enable service monitoring, see Enable service monitoring.

View service metrics

You can view the service metrics in your Dynatrace environment either on the custom device overview page or on your Dashboards page.

View metrics on the custom device overview page

To access the custom device overview page

  1. Go to Technologies & Processes or Technologies & Processes Classic (latest Dynatrace).
  2. Filter by service name and select the relevant custom device group.
  3. Once you select the custom device group, you're on the custom device group overview page.
  4. The custom device group overview page lists all instances (custom devices) belonging to the group. Select an instance to view the custom device overview page.

View metrics on your dashboard

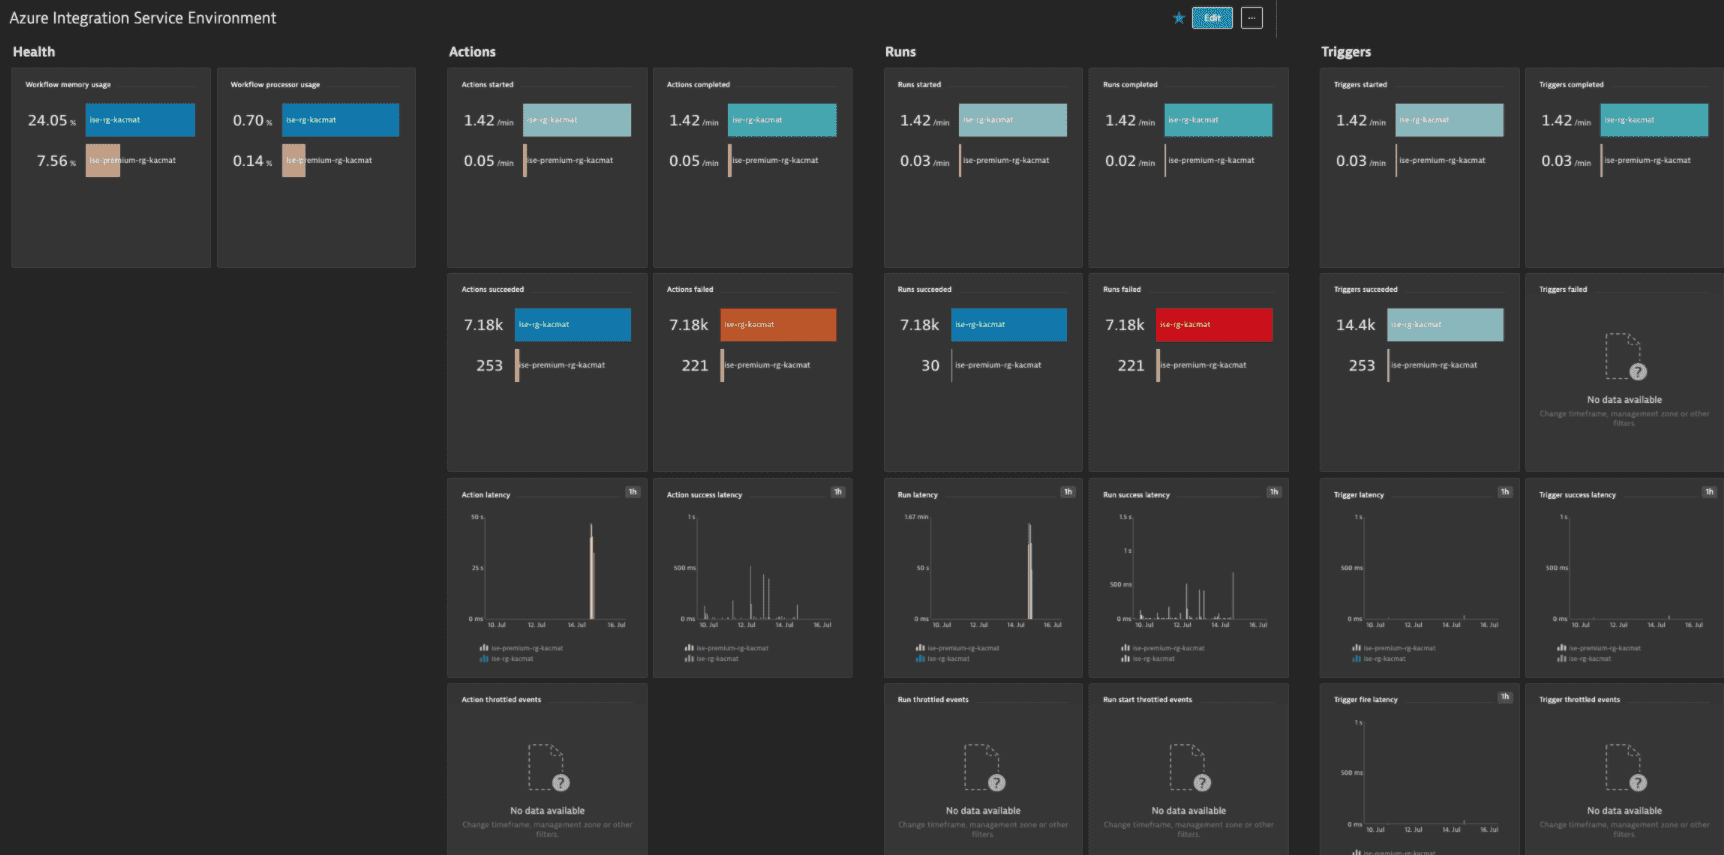
Once you add a service to monitoring, a preset dashboard for the respective service containing all recommended metrics is automatically created on your Dashboards page. You can look for specific dashboards by filtering by Preset and then by Name.

For existing monitored services, you might need to resave your credentials for the preset dashboard to appear on the Dashboards page. To resave your credentials, go to Settings > Cloud and virtualization > Azure, select the desired Azure instance, then select Save.

You can't make changes on a preset dashboard directly, but you can clone and edit it. To clone a dashboard, open the browse menu () and select Clone.
To remove a dashboard from the dashboards list, you can hide it. To hide a dashboard, open the browse menu () and select Hide.

Hiding a dashboard doesn't affect other users.

Clone hide azure

Azure Integration Service Environment

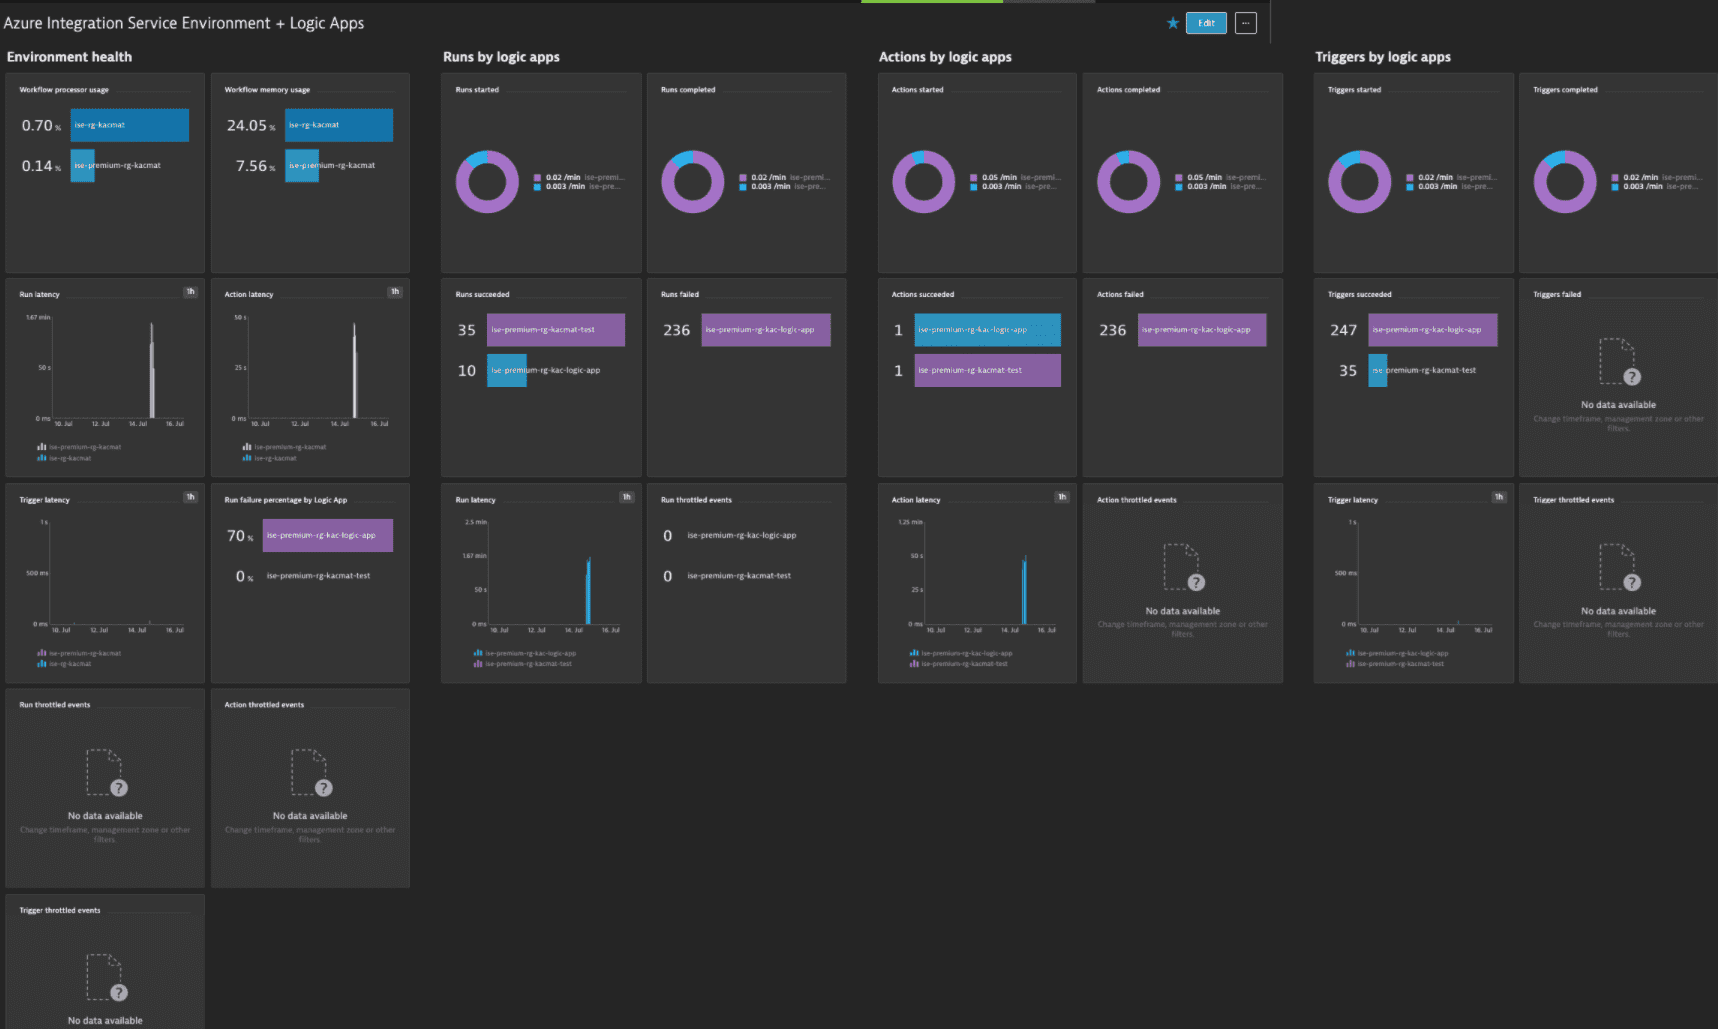
Azure Integration Service Environment can be connected with Azure Logic Apps. For more information, see Connect to Azure virtual networks from Azure Logic Apps by using an integration service environment.

Dashboard for Azure Integration Service Environment with Azure Logic Apps

Azure Integration Service Environment + Logic Apps

Available metrics

Name
Description
Unit
Recommended
ActionLatency
Latency of completed workflow actions
Second
Applicable
ActionSuccessLatency
Latency of succeeded workflow actions
Second
Applicable
ActionThrottledEvents
Number of workflow action throttled events
Count
Applicable
ActionsCompleted
Number of workflow actions completed
Count
Applicable
ActionsFailed
Number of workflow actions failed
Count
Applicable
ActionsSkipped
Number of workflow actions skipped
Count
Applicable
ActionsStarted
Number of workflow actions started
Count
Applicable
ActionsSucceeded
Number of workflow actions succeeded
Count
Applicable
IntegrationServiceEnvironmentWorkflowMemoryUsage
Workflow memory usage for integration service environment
Percent
Applicable
IntegrationServiceEnvironmentWorkflowProcessorUsage
Workflow processor usage for integration service environment
Percent
Applicable
RunFailurePercentage
Percentage of workflow runs failed
Percent
RunLatency
Latency of completed workflow runs
Second
Applicable
RunStartThrottledEvents
Number of workflow run start throttled events
Count
Applicable
RunSuccessLatency
Latency of succeeded workflow runs
Second
Applicable
RunThrottledEvents
Number of workflow action or trigger throttled events
Count
Applicable
RunsCancelled
Number of workflow runs cancelled
Count
Applicable
RunsCompleted
Number of workflow runs completed
Count
Applicable
RunsFailed
Number of workflow runs failed
Count
Applicable
RunsStarted
Number of workflow runs started
Count
Applicable
RunsSucceeded
Number of workflow runs succeeded
Count
Applicable
TriggerFireLatency
Latency of fired workflow triggers
Second
Applicable
TriggerLatency
Latency of completed workflow triggers
Second
Applicable
TriggerSuccessLatency
Latency of succeeded workflow triggers
Second
Applicable
TriggerThrottledEvents
Number of workflow trigger throttled events
Count
Applicable
TriggersCompleted
Number of workflow triggers completed
Count
Applicable
TriggersFailed
Number of workflow triggers failed
Count
Applicable
TriggersFired
Number of workflow triggers fired
Count
Applicable
TriggersSkipped
Number of workflow triggers skipped
Count
Applicable
TriggersStarted
Number of workflow triggers started
Count
Applicable
TriggersSucceeded
Number of workflow triggers succeeded
Count
Applicable