Azure HDInsight monitoring
Dynatrace ingests metrics from Azure Metrics API for Azure HDInsight. You can view metrics for each service instance, split metrics into multiple dimensions, and create custom charts that you can pin to your dashboards.
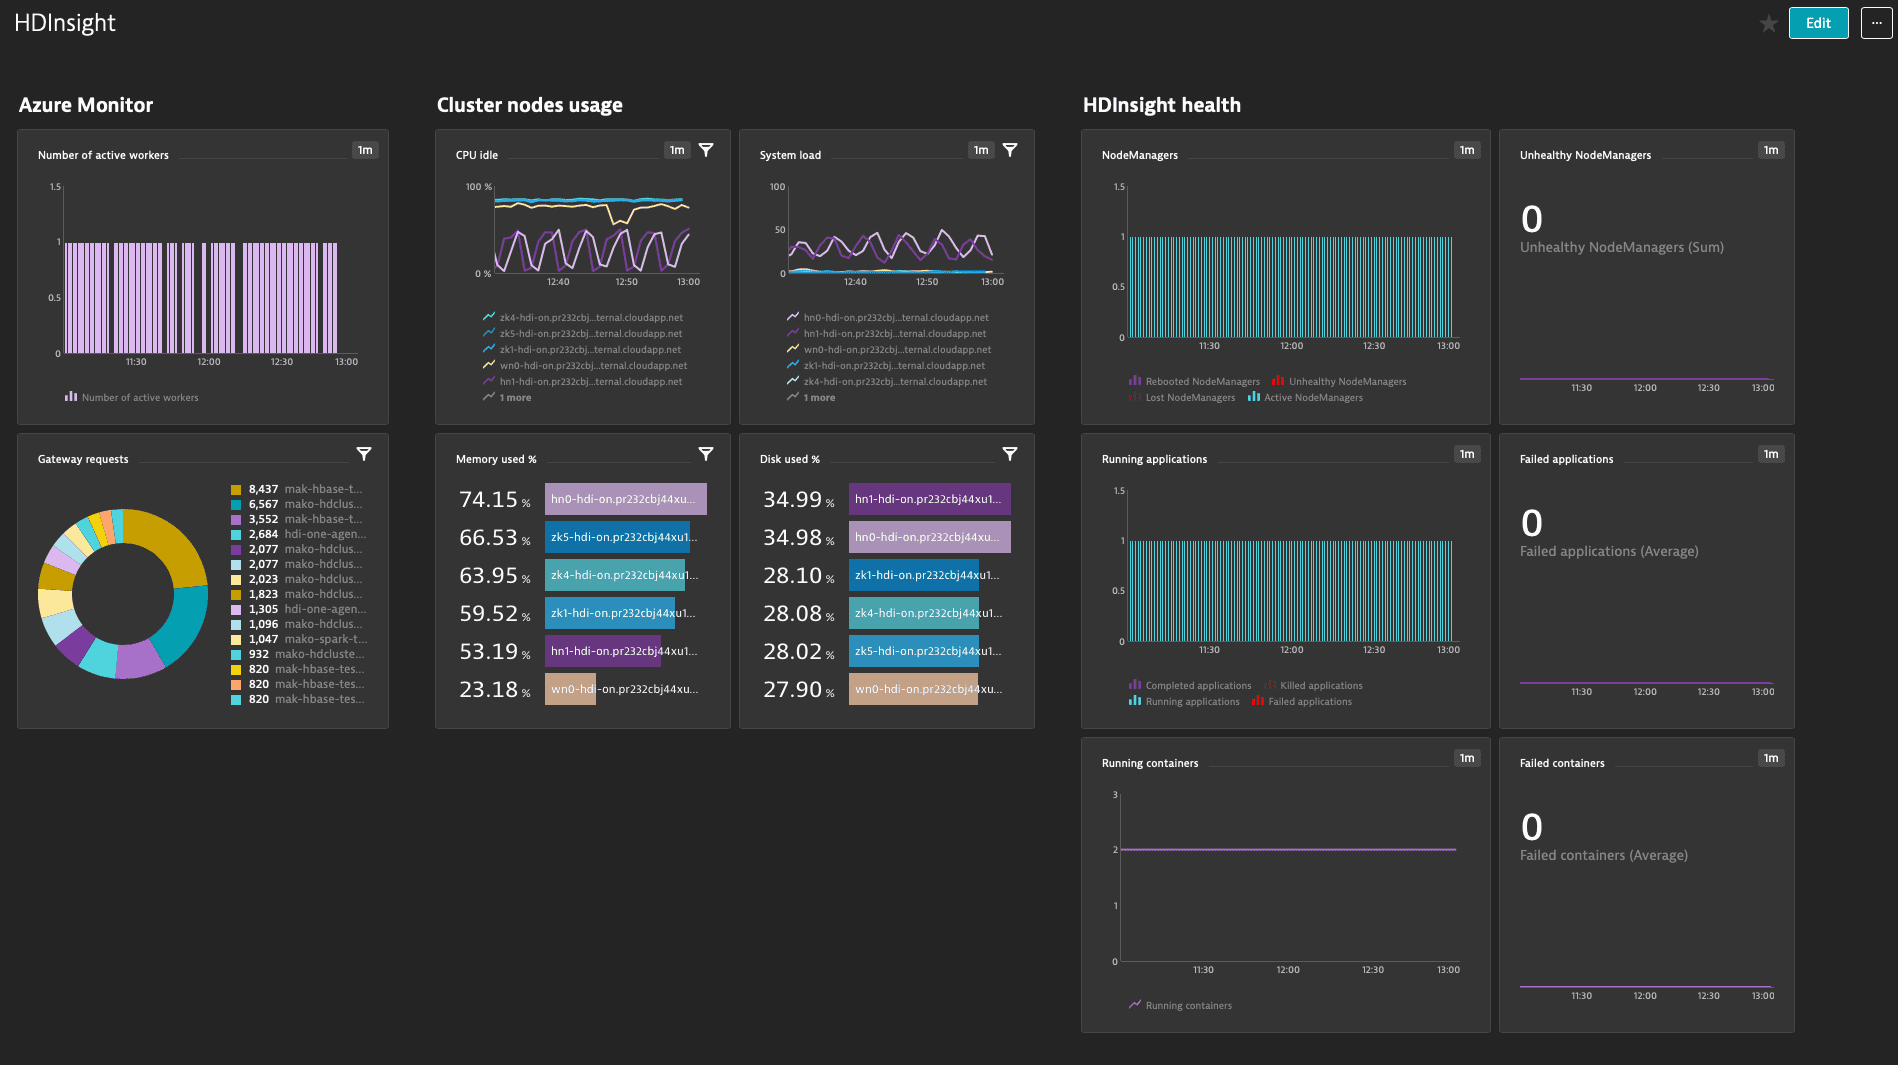
On the Azure HDInsights dashboard, you get holistic insights into your Hadoop, Spark, and Kafka resources and can cover all angles of your big data monitoring in one place.
Prerequisites
- Dynatrace version 1.196+
- Environment ActiveGate version 1.195+
Enable monitoring
To learn how to enable service monitoring, see Enable service monitoring.
Install OneAgent optional
For additional Hadoop, Spark, and Kafka insights, you can install OneAgent on Azure HDInsight cluster nodes.
Follow the steps below to install OneAgent on Azure HDInsight cluster (Linux).
 Create an install script
- In Dynatrace Hub, select OneAgent.
- Select Set up > Linux.
- On the Install Dynatrace OneAgent on your Linux hosts page, copy the command below Use this command on the target host and the command below And run the installer with root rights into a plain text document called
installdynatrace.sh, and save it to your local machine.
Example of install script
wget -O Dynatrace-OneAgent-Linux-1.137.163.sh "https://YOURTENANT.live.dynatrace.com/api/v1/deployment/installer/agent/unix/default/latest?Api-Token=YOURAPITOKEN&arch=x86&flavor=default"/bin/sh Dynatrace-OneAgent-Linux-1.137.163.sh --set-app-log-content-access=1
- Go to Microsoft Azure Storage Explorer and upload the Dynatrace installation file
installdynatrace.shto an accessible Blob Storage Container. - Click right on
installdynatrace.shand select Set public access level. In the pop-up window, set the access level to Public read access for container and blobs, and click Apply. - On the top menu of the Microsoft Azure Storage Explorer window, click on "Copy URL" and save it locally for later access.
 Create an HDInsight cluster
- Login to Microsoft Azure portal and select HDInsight clusters on the left-side menu.
- Select Create hdinsight cluster.
- Select Custom installation.
- Follow the creating wizard to configure basic settings, set storage settings, applications and cluster size.
- In the Advanced settings menu, select Script Actions.
- Select Submit new.
- In the Submit script action menu, enter Custom for the script type, choose a name, for instance Install Dynatrace, and paste the URL of the script you copied previously in the Bash script URI field. If you want to install Dynatrace OneAgent on all the nodes, select all node types (Head, Worker, Zookeeper).
- Select Create to save the changes and create the HDInsight cluster.
 Restart the processes
Once the installation is completed, make sure to restart the processes.
- Select your newly created cluster on the MicrosoftAzure portal. On the Overview menu, click on your cluster URL.
- For each node where you chose to install Dynatrace, go to Service Actions and select Restart All.
As soon as processes are restarted, Dynatrace will start collecting metrics.
View service metrics
You can view the service metrics in your Dynatrace environment either on the custom device overview page or on your Dashboards page.
View metrics on the custom device overview page
To access the custom device overview page
- Go to Technologies & Processes or Technologies & Processes Classic (latest Dynatrace).
- Filter by service name and select the relevant custom device group.
- Once you select the custom device group, you're on the custom device group overview page.
- The custom device group overview page lists all instances (custom devices) belonging to the group. Select an instance to view the custom device overview page.
View metrics on your dashboard
Once you add a service to monitoring, a preset dashboard for the respective service containing all recommended metrics is automatically created on your Dashboards page. You can look for specific dashboards by filtering by Preset and then by Name.
For existing monitored services, you might need to resave your credentials for the preset dashboard to appear on the Dashboards page. To resave your credentials, go to Settings > Cloud and virtualization > Azure, select the desired Azure instance, then select Save.
You can't make changes on a preset dashboard directly, but you can clone and edit it. To clone a dashboard, open the browse menu (…) and select Clone.
To remove a dashboard from the dashboards list, you can hide it. To hide a dashboard, open the browse menu (…) and select Hide.
Hiding a dashboard doesn't affect other users.

Set up a management zone
To import a dashboard for Azure HDInsight, you need to set up a management zone to limit the entities displayed on the dashboard to cluster nodes only and exclude other hosts not relevant to the service.
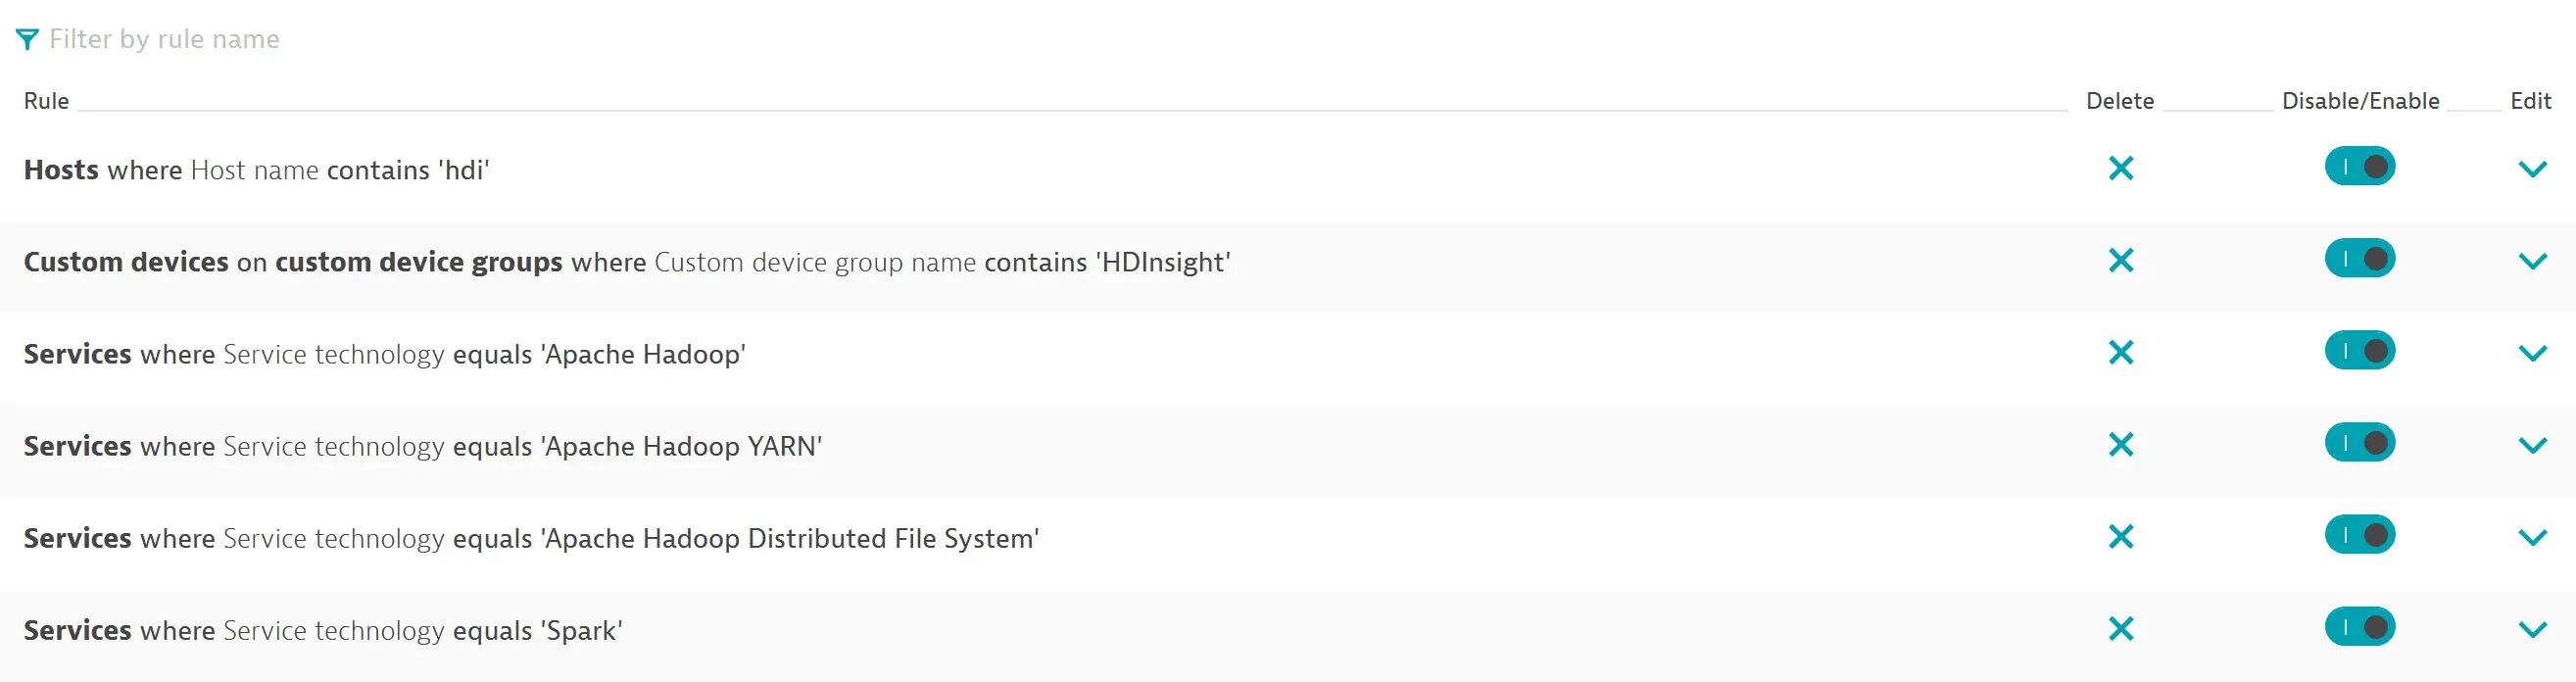
When you create a management zone for this dashboard:
- Create a rule that identifies hosts based on a common property:
- Host name contains the
hdistring
- Host name contains the
- Create a rule that identifies custom devices based on a common property:
- Custom device group contains the
HDInsightstring.
- Custom device group contains the
- Create a rule that identifies services based on a common property:
- Service technology:
Apache Hadoop - Service technology:
Apache Hadoop Distributed File System - Service technology:
Spark
- Service technology:
After you create the management zone, assign it to your dashboard (from the dashboard, select Edit > Settings > Default management zone). For more information, see Dashboard timeframe and management zone.