Self-monitoring for the Dynatrace GCP integration
Self-monitoring allows quick diagnosis to determine if a self-monitoring function is properly processing and sending logs to Dynatrace
Enable self-monitoring
Follow the steps below according to your deployment scenario.
Enable self-monitoring for the GKE deployment
-
Connect to the Kubernetes cluster where the GCP Monitor deployment is running.
-
Edit the configmap.
kubectl -n dynatrace edit configmaps dynatrace-gcp-monitor-config -
Change the value of the
SELF_MONITORING_ENABLEDparameter totrue. -
Restart the GKE GCP Monitor.
kubectl -n dynatrace rollout restart deployment dynatrace-gcp-monitor
Enable self-monitoring for the GCP Monitor deployment
- In the Google Cloud console, go to Cloud Functions.
- Select dynatrace-gcp-monitor.
- Select Edit.
- Under Runtime, build and connection settings, change the value of the
SELF_MONITORING_ENABLEDruntime environment variable totrue. - Select Next, and then select Deploy to apply the new settings.
Self-monitoring metrics
The Dynatrace GCP Monitor deployment reports self-monitoring metrics as Google Cloud metrics. See below the list of self-monitoring metrics for metric/log ingest.
Self-monitoring metrics for the GKE deployment
Metric ingestion
1 = OK) between the monitoring function and Dynatrace. Connectivity can be broken due to an incorrect Dynatrace URL, an incorrect API token, or network connectivity issues.Log ingestion
Self-monitoring metrics for the GCP Monitor deployment
Metric ingestion
1 = OK) between the monitoring function and Dynatrace. Connectivity can be broken due to an incorrect Dynatrace URL, an incorrect API token, or network connectivity issues.View self-monitoring metrics
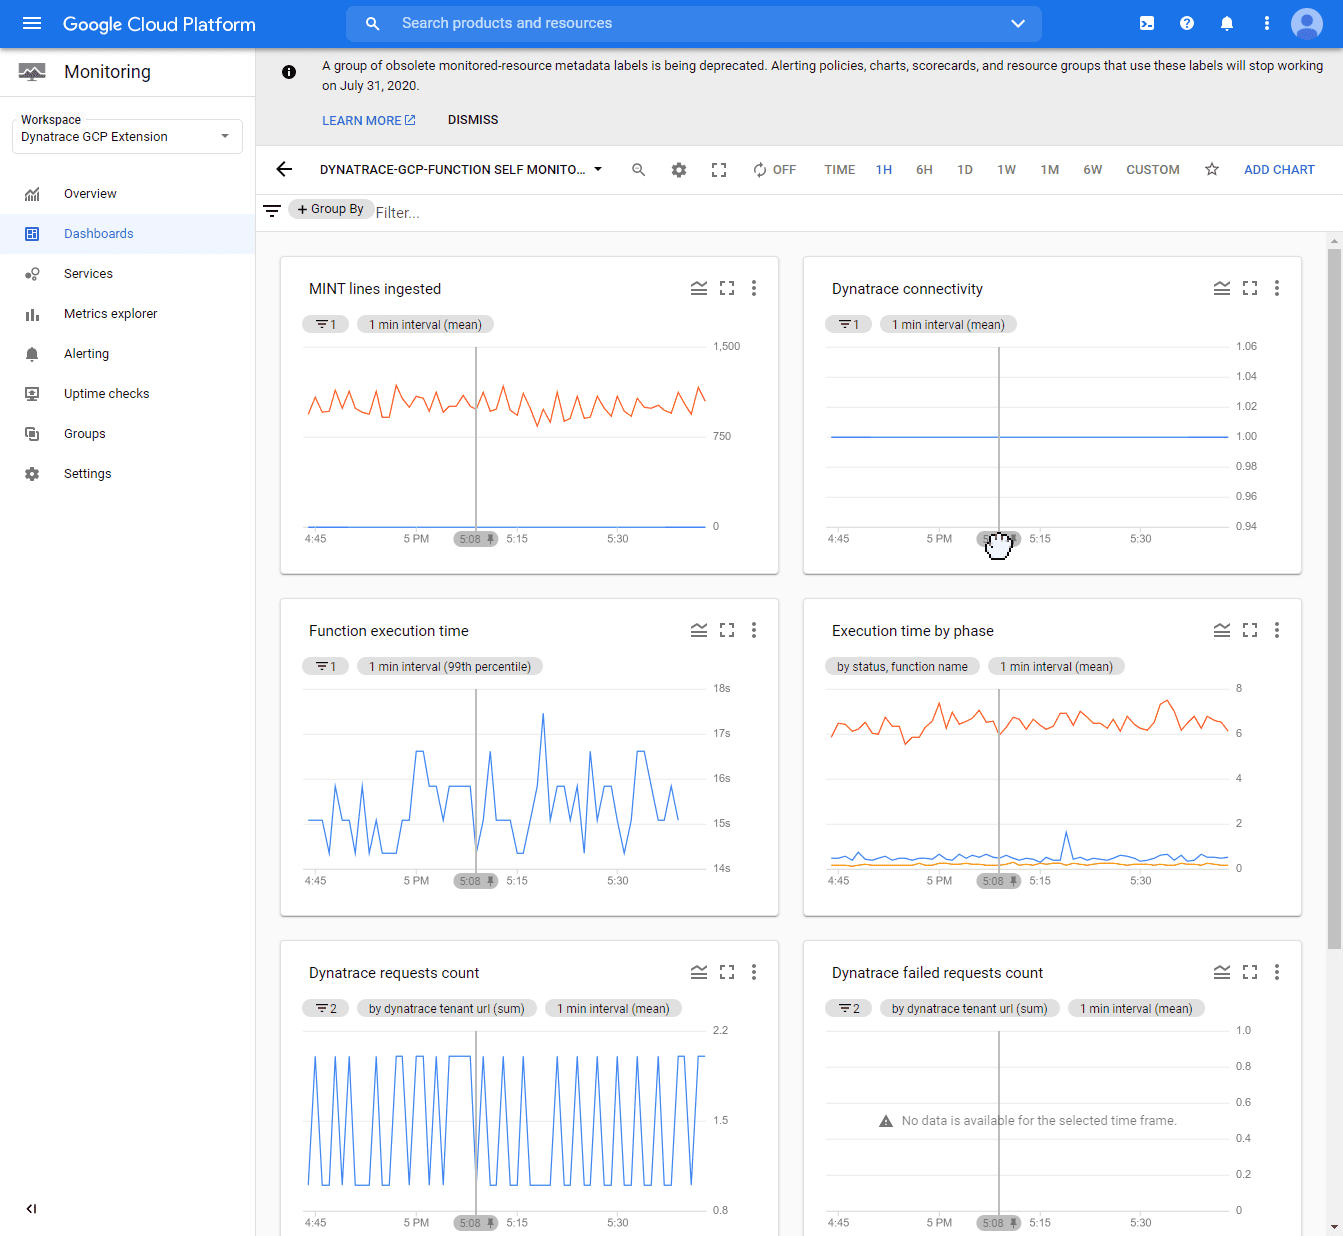
The self-monitoring dashboards present multiple metrics related to Dynatrace connectivity status, the amount of data processed, and execution times.
To view the dashboards with self-monitoring metrics
- In your GCP console, go to the GCP Monitoring service.
- Select Dashboards.
- Depending on the type of deployment selected, search for
- The
dynatrace-gcp-monitor log self monitoringdashboard (for logs) - The
dynatrace-gcp-monitor self monitoringdashboard (for metrics)
- The
Example dashboard: