Monitor LPARs and regions
- Latest Dynatrace
- 4-min read
IBM Z mainframes are equipped with a variety of configuration options, including different processor types for special purposes. The most important processor types are the general-purpose central processor (GCP) and the System z Integrated Information Processor (zIIP). You can optimize your expenses by moving workloads from GPUs to zIIPs, because the latter are not subject to license costs and maintenance fees.
Dynatrace can help you to achieve such a cost-effective IBM Z configuration by providing infrastructure metrics for LPARs (represented as Hosts) and regions (represented as Processes).
All metrics listed below are provided by the zDC subsystem as builtin metrics.
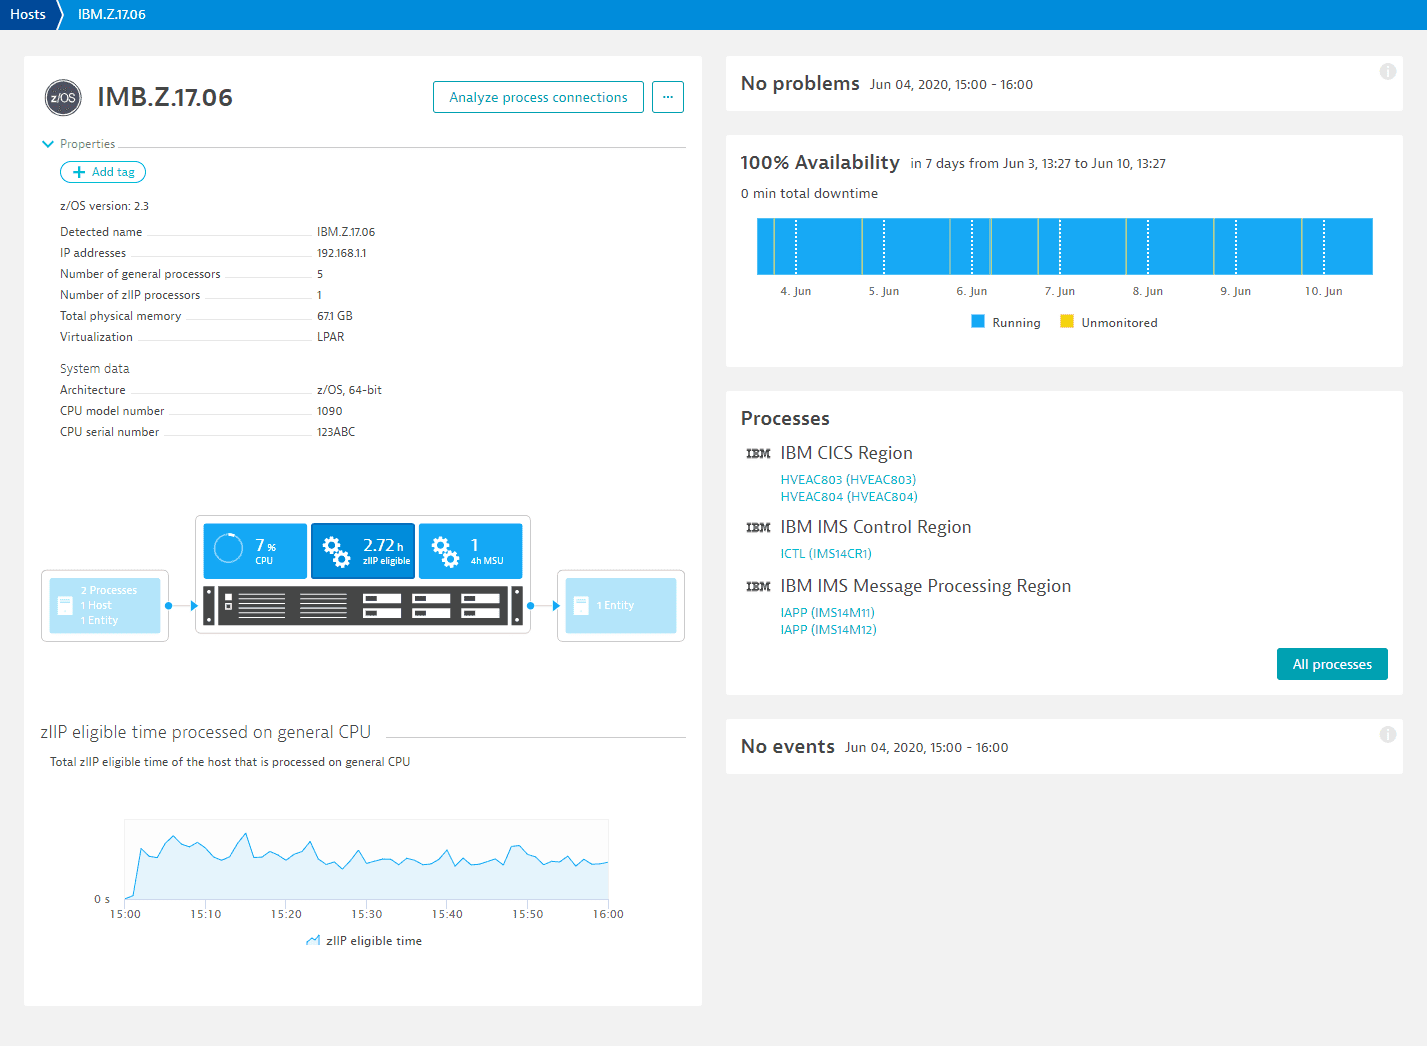
LPAR metrics
On the host level, Dynatrace provides you with the following metrics:
Metric name
Metric description
Metric source
GCP usage
Actively used GCP time of the LPAR as a percentage of available GCPU time. It indicates if GCPs are running at full capacity or are capped. In this case, capping means that GCPs could have processed more workload, but were limited to a certain capacity to control license costs.
System Control Blocks
zIIP eligible time processed on GCP
If zIIP eligible time is available, workloads can be offloaded to less expensive zIIPs, but currently they don't have enough resources. In such a case, you can change your system configuration and add more zIIPs to reduce costs.
System Control Blocks
Rolling 4-hour average MSU value
The peak rolling 4-hour average MSU value determines the chargeable MSU in the IBM sub-capacity licensing model. If you're using this licensing model, you should try to balance and distribute your workloads as much as possible.
System Control Blocks
Consumed MSU hours
The number of consumed MSUs per hour on this LPAR.
SMF70EDT
MSU capacity
The MSU capacity of your mainframe as outlined in the IBM Large Systems Programming Reference.
System Control Blocks
GCP time
Total GCP time consumed per minute on this LPAR.
System Control Blocks
zIIP usage
Actively used zIIP time of the LPAR as a percentage of available zIIP time.
System Control Blocks
zIIP time
Total zIIP time consumed per minute on this LPAR.
System Control Blocks
Additionally, Dynatrace provides you with the following system data:
- CPU model and serial number
- Number of GCPs and zIIPs
- Total physical memory
The number of processors provides you an overview of the current system configuration, while the CPU model and serial number help you to identify the correct "replacement part" if something is broken.
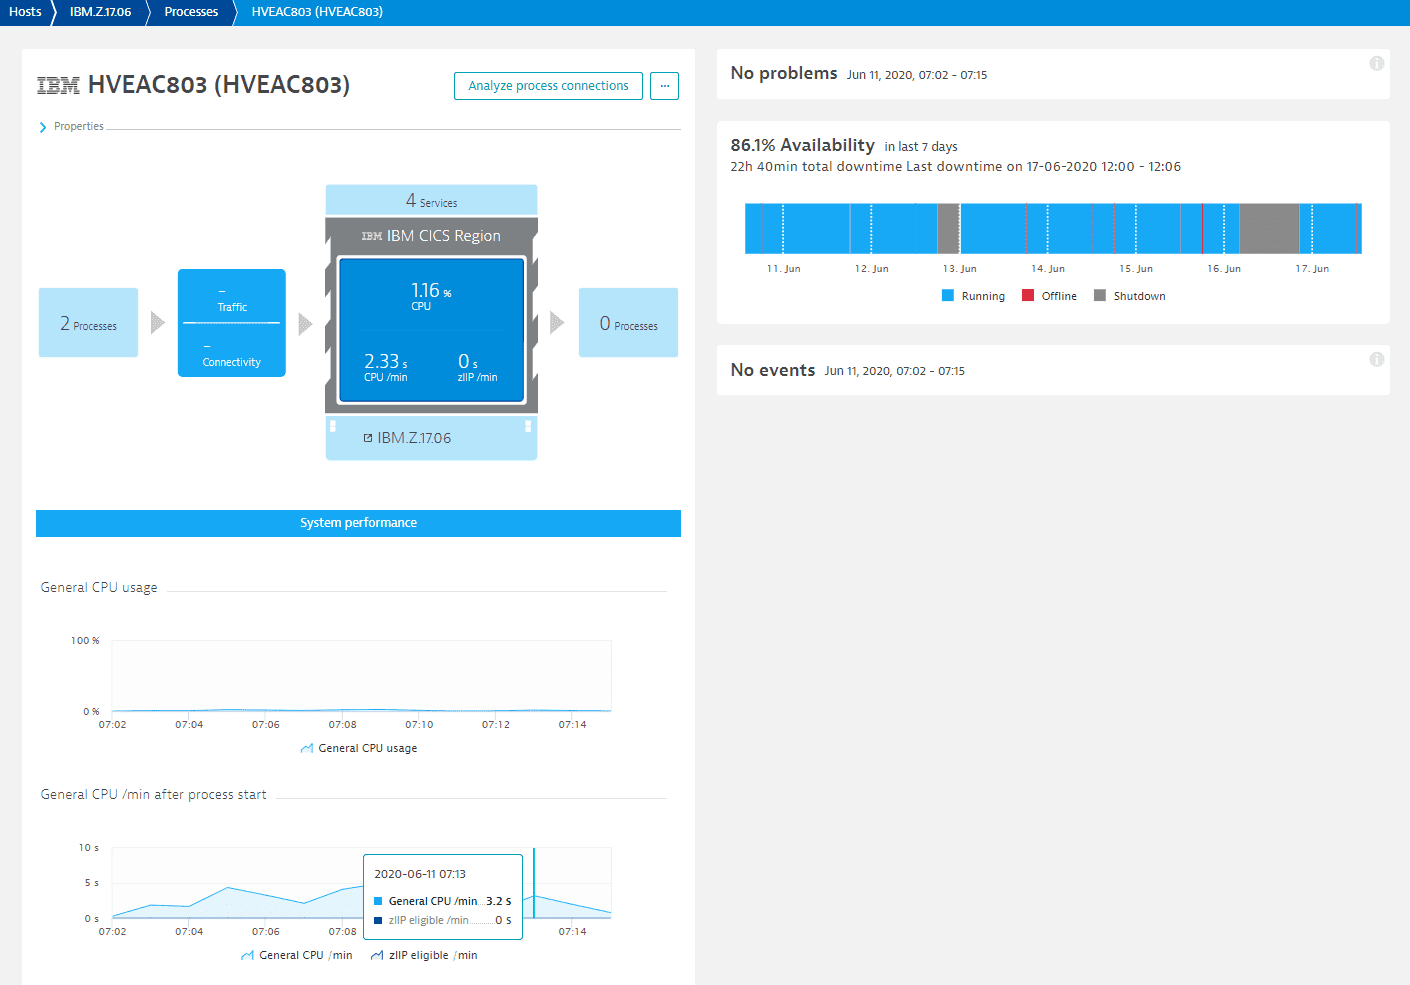
Region metrics
On the process level, Dynatrace provides you with the following metrics:
Metric name
Metric description
Metric source
GCP usage
Actively used GCP time of the process as a percentage of the overall used GCP time.
System Control Blocks
GCP time
GCP time per minute consumed after process start.
System Control Blocks
zIIP eligible time processed on GCP
If zIIP eligible time is available, workloads can be offloaded to less expensive zIIPs, but currently they don't have enough resources. In such a case, you can change your system configuration and add more zIIPs to reduce costs.
System Control Blocks
zIIP time
zIIP time per minute consumed after process start. This indicates the workload already running on zIIPs.
System Control Blocks
Consumed Service Units
The calculated number of consumed Service Units per minute.
System Control Blocks