Set up metric events for alerting
- Latest Dynatrace
- How-to guide
- 16-min read
- Published Jan 19, 2024
To configure metric events for alerting
- Go to Settings > Cloud and virtualization > AWS.
- Under Metric events for alerting, select Manage alerting rules.
- On the Metric events for alerting page, you can create, enable/disable, and configure recommended alerting rules.
For an overview of all recommended alerting rules for all supporting services, see the list below.
List of predefined alerting rules per supporting service
| Name | Alerting rules |
|---|---|
| Amazon MQ | Amazon MQ store percent usage (Static threshold: above 95 %), Amazon MQ temp percent usage (Static threshold: above 95 %), Amazon MQ memory usage (by topic) (Static threshold: above 95 %), Amazon MQ memory usage (by queue) (Static threshold: above 95 %), Amazon MQ CPU utilization (Static threshold: above 95 %), Amazon MQ heap usage (Static threshold: above 95 %), Amazon MQ job scheduler store percent usage (Static threshold: above 95 %), Amazon RabbitMQ CPU utilization (Static threshold: above 95 %) |
| AWS App Runner | AWS App Runner CPU utilization (by instance/service ID) (Static threshold: above 95 %) |
| Amazon AppStream | Amazon AppStream capacity utilization (Static threshold: above 95 %) |
| Amazon Aurora | Amazon Aurora CPU utilization (average, by region) (Static threshold: above 95 %), Amazon Aurora CPU utilization (average, by region/engine) (Static threshold: above 95 %), Amazon Aurora CPU utilization (average, by region/database class) (Static threshold: above 95 %), Amazon Aurora CPU utilization (average) (Static threshold: above 95 %), Amazon Aurora CPU utilization (average, by role) (Static threshold: above 95 %), Amazon Aurora CPU utilization (maximum, by region) (Static threshold: above 95 %), Amazon Aurora CPU utilization (maximum, by region/engine) (Static threshold: above 95 %), Amazon Aurora CPU utilization (maximum, by region/database class) (Static threshold: above 95 %), Amazon Aurora CPU utilization (maximum) (Static threshold: above 95 %), Amazon Aurora CPU utilization (maximum, by role) (Static threshold: above 95 %) |
| Amazon Keyspaces | Amazon Keyspaces account provisioned read capacity utilization (by region) (Static threshold: above 95 %), Amazon Keyspaces account provisioned write capacity utilization (by region) (Static threshold: above 95 %), Amazon Keyspaces max provisioned table read capacity utilization (by region) (Static threshold: above 95 %), Amazon Keyspaces max provisioned table write capacity utilization (by region) (Static threshold: above 95 %) |
| Amazon CloudFront | Amazon CloudFront total error rate (by region) (Static threshold: above 5 %), Amazon CloudFront 4xx error rate (by region) (Static threshold: above 5 %), Amazon CloudFront 5xx error rate (by region) (Static threshold: above 5 %) |
| Amazon CloudSearch | Amazon CloudSearch index utilization (Static threshold: above 95 %) |
| AWS CodeBuild | AWS CodeBuild CPU utilized percent (Static threshold: above 95 %), AWS CodeBuild CPU utilized percent (by build id/build number) (Static threshold: above 95 %), AWS CodeBuild memory utilized percent (Static threshold: above 95 %), AWS CodeBuild memory utilized percent (by build id/build number) (Static threshold: above 95 %) |
| Amazon Connect | Amazon Connect the percentage of the concurrent calls service quota (by metric group) (Static threshold: above 95 %) |
| Amazon Elastic Kubernetes Service (EKS) | Amazon EKS Node CPU utilization (by instance id/node name) (Static threshold: above 95 %), Amazon EKS Node memory utilization (by instance id/node name) (Static threshold: above 95 %), Amazon EKS Pod CPU utilization over pod limit (by namespace) (Static threshold: above 95 %), Amazon EKS Pod CPU utilization over pod limit (by namespace/pod name) (Static threshold: above 95 %), Amazon EKS Pod CPU utilization over pod limit (Static threshold: above 95 %), Amazon EKS Node filesystem utilization (by instance id/node name) (Static threshold: above 95 %), Amazon EKS Pod memory utilization (by namespace) (Static threshold: above 95 %), Amazon EKS Pod memory utilization (by namespace/pod name) (Static threshold: above 95 %), Amazon EKS Service Pod memory utilization (Static threshold: above 95 %), Amazon EKS Pod CPU utilization (by namespace) (Static threshold: above 95 %), Amazon EKS Pod CPU utilization (by namespace/pod name) (Static threshold: above 95 %), Amazon EKS Pod CPU utilization (Static threshold: above 95 %), Amazon EKS Pod CPU reserved capacity (by namespace/pod name) (Static threshold: above 95 %), Amazon EKS Pod CPU reserved capacity (Static threshold: above 95 %), Amazon EKS Pod memory utilization over pod limit (by namespace) (Static threshold: above 95 %), Amazon EKS Pod memory utilization over pod limit (by namespace/pod name) (Static threshold: above 95 %), Amazon EKS Pod memory utilization over pod limit (Static threshold: above 95 %), Amazon EKS Pod memory reserved capacity (by namespace/pod name) (Static threshold: above 95 %), Amazon EKS Pod memory reserved capacity (Static threshold: above 95 %), Amazon EKS Node CPU reserved capacity (by instance id/node name) (Static threshold: above 95 %), Amazon EKS Node CPU reserved capacity (Static threshold: above 95 %), Amazon EKS Node memory reserved capacity (by instance id/node name) (Static threshold: above 95 %), Amazon EKS Node memory reserved capacity (Static threshold: above 95 %), Amazon EKS Node CPU utilization (Static threshold: above 95 %), Amazon EKS Node memory utilization (Static threshold: above 95 %), Amazon EKS Node filesystem utilization (Static threshold: above 95 %) |
| Amazon DynamoDB Accelerator (DAX) | Amazon DynamoDB Accelerator CPU utilization (Static threshold: above 95 %), Amazon DynamoDB Accelerator CPU utilization (by node id) (Static threshold: above 95 %), Amazon DynamoDB Accelerator CPU utilization (by region) (Static threshold: above 95 %) |
| AWS Database Migration Service | AWS Database Migration Service CPU utilization (by replication task identifier) (Static threshold: above 95 %), AWS Database Migration Service CPU utilization (Static threshold: above 95 %), AWS Database Migration Service CPU utilization (by replication instance/external resource id) (Static threshold: above 95 %), AWS Database Migration Service CPU utilization (by region) (Static threshold: above 95 %), AWS Database Migration Service CPU utilization (by region/instance class) (Static threshold: above 95 %) |
| Amazon DocumentDB | Amazon DocumentDB CPU utilization (by region/DB instance identifier) (Static threshold: above 95 %), Amazon DocumentDB CPU utilization (by role) (Static threshold: above 95 %), Amazon DocumentDB CPU utilization (Static threshold: above 95 %) |
| Amazon Elastic Container Service (ECS) | Amazon ECS CPU reservation (Static threshold: above 95 %), Amazon ECS CPU utilization (Static threshold: above 95 %), Amazon ECS CPU utilization (by service name) (Static threshold: above 95 %), Amazon ECS Memory reservation (Static threshold: above 95 %), Amazon ECS Memory utilization (Static threshold: above 95 %), Amazon ECS Memory utilization (by service name) (Static threshold: above 95 %) |
| Amazon ECS ContainerInsights | Amazon ECS ContainerInsights instance memory utilization (by container instance id/instance id) (Static threshold: above 95 %), Amazon ECS ContainerInsights instance memory utilization (Static threshold: above 95 %), Amazon ECS ContainerInsights instance memory reserved capacity (by container instance id/instance id) (Static threshold: above 95 %), Amazon ECS ContainerInsights instance memory reserved capacity (Static threshold: above 95 %), Amazon ECS ContainerInsights instance CPU utilization (by container instance id/instance id) (Static threshold: above 95 %), Amazon ECS ContainerInsights instance CPU utilization (Static threshold: above 95 %), Amazon ECS ContainerInsights instance filesystem utilization (by container instance id/instance id) (Static threshold: above 95 %), Amazon ECS ContainerInsights instance filesystem utilization (Static threshold: above 95 %), Amazon ECS ContainerInsights instance CPU reserved capacity (by container instance id/instance id) (Static threshold: above 95 %), Amazon ECS ContainerInsights instance CPU reserved capacity (Static threshold: above 95 %) |
| Amazon ElastiCache (EC) | Amazon ElastiCache CPU utilization (Static threshold: above 95 %), Amazon ElastiCache CPU utilization (by cache/node id) (Static threshold: above 95 %), Amazon ElastiCache engine CPU utilization (Static threshold: above 95 %), Amazon ElastiCache engine CPU utilization (by cache/node id) (Static threshold: above 95 %) |
| AWS Elastic Beanstalk | AWS Elastic Beanstalk root filesystem util (by instance id) (Static threshold: above 95 %), AWS Elastic Beanstalk root filesystem util (Static threshold: above 95 %), AWS Elastic Beanstalk load average 1min (by instance id) (Static threshold: above 95 %), AWS Elastic Beanstalk load average 5min (by instance id) (Static threshold: above 95 %), AWS Elastic Beanstalk CPU user (by instance id) (Static threshold: above 95 %), AWS Elastic Beanstalk CPU nice (by instance id) (Static threshold: above 95 %), AWS Elastic Beanstalk CPU idle (by instance id) (Static threshold: below 5 %), AWS Elastic Beanstalk CPU IO wait (by instance id) (Static threshold: above 95 %), AWS Elastic Beanstalk CPU irq (by instance id) (Static threshold: above 95 %), AWS Elastic Beanstalk CPU softirq (by instance id) (Static threshold: above 95 %), AWS Elastic Beanstalk CPU system (by instance id) (Static threshold: above 95 %), AWS Elastic Beanstalk CPU privileged (by instance id) (Static threshold: above 95 %) |
| Amazon Elastic File System (EFS) | Amazon EFS percent IO limit (Static threshold: above 95 %) |
| Amazon Elastic Inference | Amazon Elastic Inference accelerator utilization (by Elastic Inference accelerator id) (Static threshold: above 95 %) |
| Amazon Elastic Map Reduce (EMR) | Amazon Elastic MapReduce YARN memory available percentage (Static threshold: below 5 %), Amazon Elastic MapReduce YARN memory available percentage (by job id) (Static threshold: below 5 %), Amazon Elastic MapReduce HDFS utilization (Static threshold: above 95 %), Amazon Elastic MapReduce HDFS utilization (by job id) (Static threshold: above 95 %) |
| Amazon Elasticsearch Service (ES) | Amazon Elasticsearch Service CPU utilization (maximum, by client id) (Static threshold: above 95 %), Amazon Elasticsearch Service CPU utilization (by client id) (Static threshold: above 95 %), Amazon Elasticsearch Service JVM memory pressure (high, by client id) (Static threshold: above 75 %), Amazon Elasticsearch Service JVM memory pressure (critical, by client id) (Static threshold: above 90 %), Amazon Elasticsearch Service master CPU utilization (by client id) (Static threshold: above 95 %), Amazon Elasticsearch Service master JVM memory pressure (high) (Static threshold: above 75 %), Amazon Elasticsearch Service master JVM memory pressure (critical) (Static threshold: above 90 %) |
| Amazon GameLift | Amazon GameLift percent idle instances (Static threshold: below 5 %), Amazon GameLift percent idle instances (by region/metric groups) (Static threshold: below 5 %), Amazon GameLift percent healthy server processes (Static threshold: below 95 %), Amazon GameLift Percent healthy server processes (by region/metric groups) (Static threshold: below 95 %), Amazon GameLift percent available game sessions (Static threshold: below 5 %), Amazon GameLift percent available game sessions (by region/metric groups) (Static threshold: below 5 %) |
| AWS Glue | AWS Glue driver JVM heap usage (by job run id/type) (Static threshold: above 95 %), AWS Glue ALL JVM heap usage (by job run id/type) (Static threshold: above 95 %), AWS Glue driver CPU system load (by job run id/type) (Static threshold: above 95 %), AWS Glue ALL CPU system load (by job run id/type) (Static threshold: above 95 %) |
| Amazon Managed Streaming for Kafka | Amazon Managed Streaming for Kafka root disk used (by broker id) (Static threshold: above 95 %), Amazon Managed Streaming for Kafka network processor avg idle percent (by broker id) (Static threshold: below 5 %), Amazon Managed Streaming for Kafka request handler avg idle percent (by broker id) (Static threshold: below 5 %), Amazon Managed Streaming for Kafka app logs disk used (by broker id) (Static threshold: above 95 %), Amazon Managed Streaming for Kafka data logs disk used (by broker id) (Static threshold: above 95 %), Amazon Managed Streaming for Kafka the percentage of CPU in user space (by broker id) (Static threshold: above 95 %), Amazon Managed Streaming for Kafka the percentage of CPU idle time (by broker id) (Static threshold: below 5 %), Amazon Managed Streaming for Kafka the percentage of CPU in kernel space (by broker id) (Static threshold: above 95 %) |
| AWS Lambda | AWS Lambda error rate (based on errorsSum and invocationsSum) (Static threshold: above 5 %) |
| AWS Elemental MediaConnect | AWS Elemental MediaConnect source packet loss percent (Static threshold: above 5 %), AWS Elemental MediaConnect packet loss percent (by region) (Static threshold: above 5 %), AWS Elemental MediaConnect packet loss percent (by region/availability zone) (Static threshold: above 5 %), AWS Elemental MediaConnect source packet loss percent (by region) (Static threshold: above 5 %), AWS Elemental MediaConnect source packet loss percent (by region/availability zone) (Static threshold: above 5 %), AWS Elemental MediaConnect source packet loss percent (by region/source arn) (Static threshold: above 5 %), AWS Elemental MediaConnect packet loss percent (Static threshold: above 5 %) |
| Amazon Neptune | Amazon Neptune CPU utilization (Static threshold: above 95 %), Amazon Neptune CPU utilization (by role) (Static threshold: above 95 %), Amazon Neptune CPU utilization (by region) (Static threshold: above 95 %), Amazon Neptune CPU utilization (by region/DB instance identifier) (Static threshold: above 95 %), Amazon Neptune CPU utilization (by region/database class) (Static threshold: above 95 %), Amazon Neptune CPU utilization (by region/engine name) (Static threshold: above 95 %) |
| AWS OpsWorks | AWS OpsWorks CPU system (Static threshold: above 95 %), AWS OpsWorks CPU user (Static threshold: above 95 %), AWS OpsWorks CPU nice (Static threshold: above 95 %), AWS OpsWorks CPU IO wait (Static threshold: above 95 %), AWS OpsWorks CPU steal (Static threshold: above 95 %), AWS OpsWorks CPU idle (Static threshold: below 5 %), AWS OpsWorks CPU system (by region/instance id) (Static threshold: above 95 %), AWS OpsWorks CPU system (by region/layer id) (Static threshold: above 95 %), AWS OpsWorks CPU user (by region/instance id) (Static threshold: above 95 %), AWS OpsWorks CPU user (by region/layer id) (Static threshold: above 95 %), AWS OpsWorks CPU nice (by region/instance id) (Static threshold: above 95 %), AWS OpsWorks CPU nice (by region/layer id) (Static threshold: above 95 %), AWS OpsWorks CPU IO wait (by region/instance id) (Static threshold: above 95 %), AWS OpsWorks CPU IO wait (by region/layer id) (Static threshold: above 95 %), AWS OpsWorks CPU steal (by region/instance id) (Static threshold: above 95 %), AWS OpsWorks CPU steal (by region/layer id) (Static threshold: above 95 %), AWS OpsWorks CPU idle (by region/instance id) (Static threshold: below 5 %), AWS OpsWorks CPU idle (by region/layer id) (Static threshold: below 5 %) |
| Amazon Redshift | Amazon Redshift CPU utilization (Static threshold: above 95 %), Amazon Redshift CPU utilization (by node id) (Static threshold: above 95 %), Amazon Redshift percentage disk space used (Static threshold: above 95 %), Amazon Redshift percentage disk space used (by node id) (Static threshold: above 95 %) |
| Amazon Route 53 | Amazon Route 53 percentage healthy (by region/health check id) (Static threshold: below 95 %) |
| Amazon SageMaker Batch Transform Jobs | Amazon SageMaker Batch Transform Jobs CPU utilization (by region/host) (Static threshold: above 95 %), Amazon SageMaker Batch Transform Jobs memory utilization (by region/host) (Static threshold: above 95 %), Amazon SageMaker Batch Transform Jobs GPU utilization (by region/host) (Static threshold: above 95 %), Amazon SageMaker Batch Transform Jobs GPU memory utilization (by region/host) (Static threshold: above 95 %) |
| Amazon SageMaker Endpoint Instances | Amazon SageMaker Endpoint Instances CPU utilization (by variant name) (Static threshold: above 95 %), Amazon SageMaker Endpoint Instances memory utilization (by variant name) (Static threshold: above 95 %), Amazon SageMaker Endpoint Instances GPU utilization (by variant name) (Static threshold: above 95 %), Amazon SageMaker Endpoint Instances GPU memory utilization (by variant name) (Static threshold: above 95 %), Amazon SageMaker Endpoint Instances disk utilization (by variant name) (Static threshold: above 95 %) |
| Amazon SageMaker Processing Jobs | Amazon SageMaker Processing Jobs CPU utilization (by region/host) (Static threshold: above 95 %), Amazon SageMaker Processing Jobs memory utilization (by region/host) (Static threshold: above 95 %), Amazon SageMaker Processing Jobs GPU utilization (by region/host) (Static threshold: above 95 %), Amazon SageMaker Processing Jobs GPU memory utilization (by region/host) (Static threshold: above 95 %), Amazon SageMaker Processing Jobs disk utilization (by region/host) (Static threshold: above 95 %) |
| Amazon SageMaker Training Jobs | Amazon SageMaker Training Jobs CPU utilization (by region/host) (Static threshold: above 95 %), Amazon SageMaker Training Jobs memory utilization (by region/host) (Static threshold: above 95 %), Amazon SageMaker Training Jobs GPU utilization (by region/host) (Static threshold: above 95 %), Amazon SageMaker Training Jobs GPU memory utilization (by region/host) (Static threshold: above 95 %), Amazon SageMaker Training Jobs disk utilization (by region/host) (Static threshold: above 95 %) |
| Amazon Simple Email Service (SES) | Amazon SES reputation bounce rate (by region) (Static threshold: above 5 %), Amazon SES reputation complaint rate (by region) (Static threshold: above 0.1 %) |
| AWS Storage Gateway | AWS Storage Gateway cache percent dirty (by region/share id) (Static threshold: above 80 %), AWS Storage Gateway cache percent dirty (by region/volume id) (Static threshold: above 80 %), AWS Storage Gateway cache percent dirty (by gateway id) (Static threshold: above 80 %), AWS Storage Gateway user CPU percent (Static threshold: above 95 %), AWS Storage Gateway IO wait percent (Static threshold: above 20 %), AWS Storage Gateway upload buffer percent used (by gateway id) (Static threshold: above 95 %), AWS Storage Gateway working storage percent used (by gateway id) (Static threshold: above 95 %) |
| AWS Trusted Advisor | AWS Trusted Advisor service limit usage (by region/service limit/service name) (Static threshold: above 95 %) |
The number of recommended alerting rules depends on the number of your monitored supporting services.
To add recommended alerting rules for a new supporting service, you first need to add the new service to monitoring.
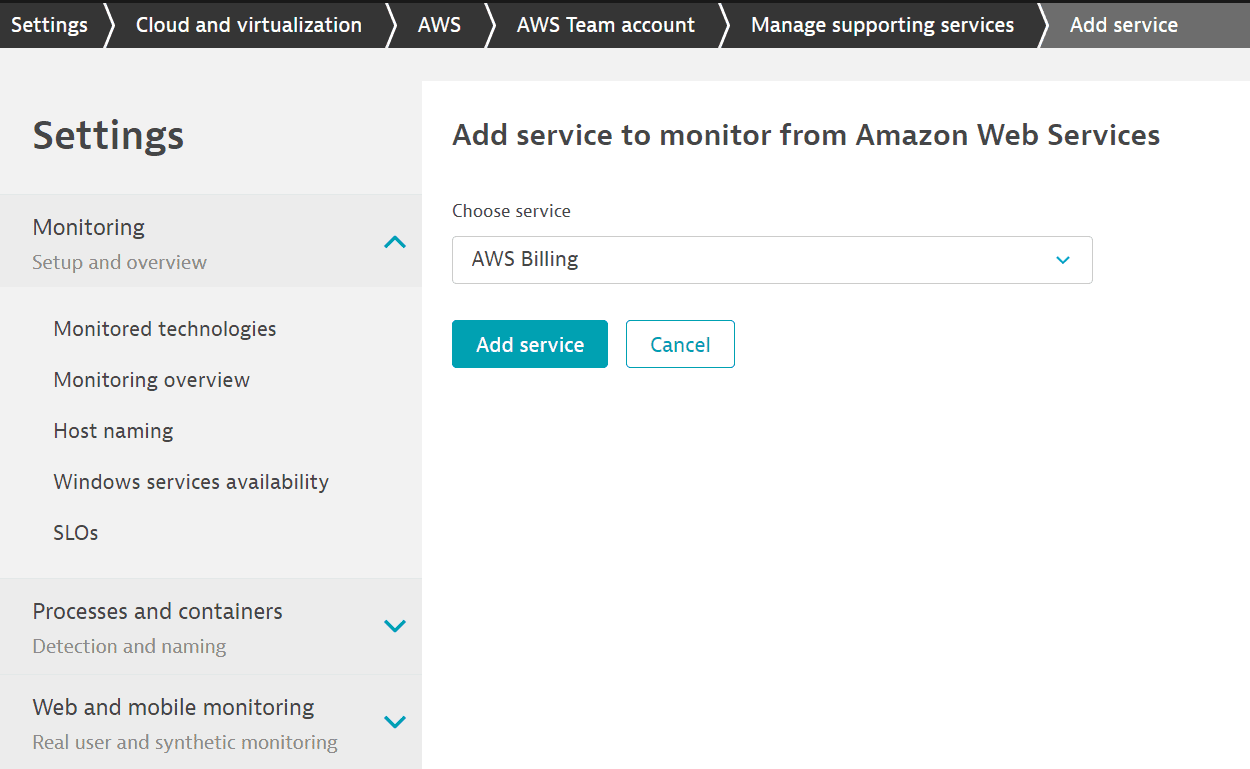
How to add a service to monitoring
- Go to Settings > Cloud and virtualization > AWS.
- On the AWS overview page, select the edit button (pencil icon) for the AWS instance you want to edit.
- Select Manage services and Add service, choose the service name from the list, and select Add service.
- Select Save changes.
Note that not all supporting services have their own predefined alerting rules.
-
Create and enable alerting rules.
To enable recommended alerting rules, you first need to create them. You can create alerting rules and automatically enable them, or (if you clear Automatically enable created rules) create them and manually enable them after possible configuration changes.

For example, you can create and automatically enable a first batch of alerts. When you start monitoring new services, you can create alerts for these new services without automatically enabling them (because you want to configure them first).
-
Configure alerting rules. How you edit rules depends on whether you chose to automatically enable alerts.
-
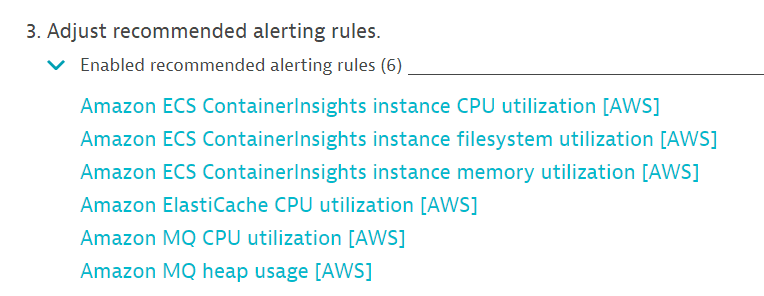
If you chose to automatically enable alerts when creating them, go to Adjust recommended alerting rules, expand Enabled recommended alerting rules, and select any rule. This takes you to Edit custom event for alerting, where you can change the configuration rules for that specific service.
-
If you didn't choose to automatically enable alerts when creating them, go to Enable recommended alerting rules, expand Disabled recommended alerting rules, and select any of the disabled rules. This takes you to the same Edit custom event for alerting page.

-
-
Disable alerting rules.
-
You can disable all alerting rules, or disable or delete them selectively.
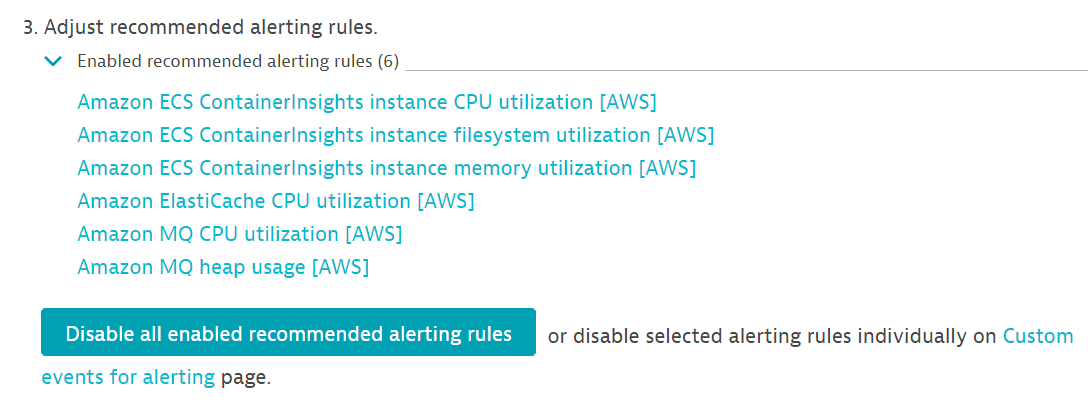
- To disable all alerting rules, go to Adjust recommended alerting rules and select Disable all enabled recommended alerting rules.
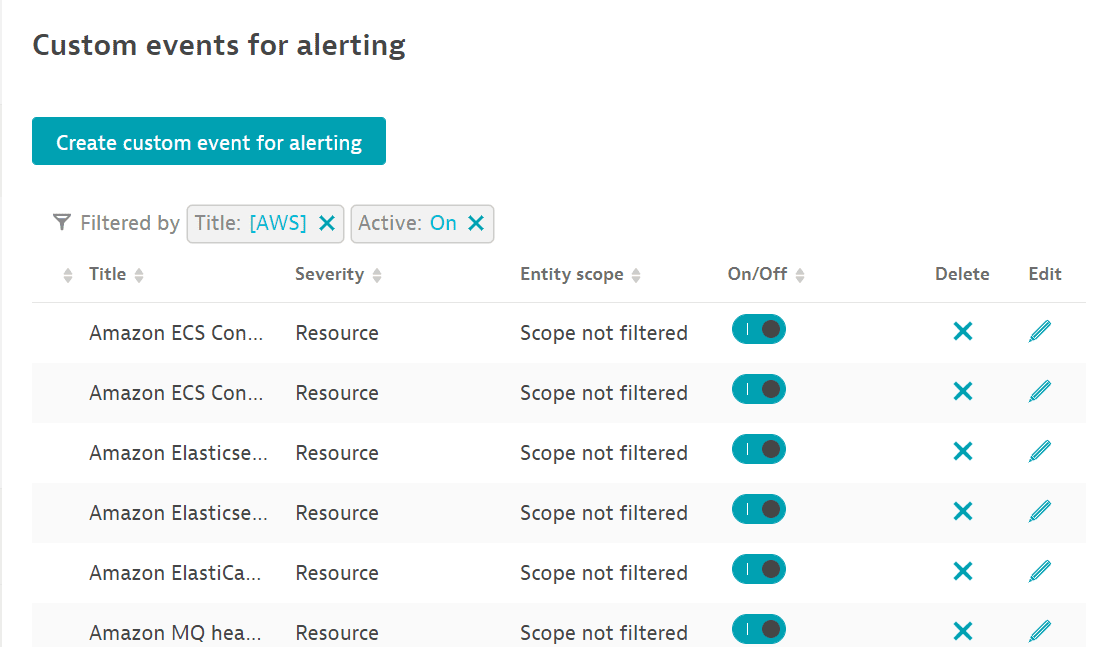
- To disable or delete alerting rules selectively, go to Adjust recommended alerting rules and select Metric events. On the Metric events page, you can disable an alert by turning it off in the On/Off column, or you can delete it by selecting
xin the Delete column.
If you disable any or all of the alerting rules, you can always re-enable them.