OpenTelemetry interoperability in Node.js
- How-to guide
- 9-min read
OneAgent version 1.229+
OpenTelemetry interoperability connects the Dynatrace AWS Lambda extension to the OpenTelemetry Node.js instrumentation to use the instrumentation packages and extensions. You can then monitor technologies like databases or messaging frameworks that aren't supported by Dynatrace AWS Lambda extension out of the box.
Before you start
-
Ensure that OpenTelemetry interoperability is enabled.
-
Verify that the installed JavaScript OpenTelemetry API is compatible with the Dynatrace AWS Lambda extension. The following table lists the compatible versions:
OneAgent version Maximum OpenTelemetry API version 1.229+ 1.0.x 1.241+ 1.1.x 1.257+ 1.2.x 1.259+ 1.3.x 1.261+ 1.4.x 1.279+ 1.6.x 1.283+ 1.7.x 1.289+ 1.8.x 1.297+ 1.9.x
Use OpenTelemetry Node.js instrumentation
When using an OpenTelemetry Node.js instrumentation, the configuration of all necessary OpenTelemetry SDK components and the registration of a TracerProvider are automatically handled by the Dynatrace AWS Lambda extension, so you don't need to register another TracerProvider.
Instrumentation packages for JavaScript can be found in the OpenTelemetry JavaScript contributions repository. Note that
- Some instrumentations might interfere with the Dynatrace HTTP and Lambda instrumentations and are automatically suppressed. These include @opentelemetry/instrumentation-http and @opentelemetry/instrumentation-aws-lambda.
- @opentelemetry/auto-instrumentations-node use is discouraged, as it includes many different instrumentations.
- If
opentelemetry/instrumentation-aws-sdk is used to instrument AWS SDK V3, provided by the Node.js v18 and v20 Lambda runtimes, it will work for instrumentation version 0.36.0+.
The following code example shows how to instrument PostgreSQL calls in your Node.js Lambda function by using the opentelemetry-instrumentation-pg instrumentation package.
const { registerInstrumentations } = require('@opentelemetry/instrumentation');const { PgInstrumentation } = require('@opentelemetry/instrumentation-pg');// You must create the PgInstrumentation (and other instrumentations)// before loading any corresponding modules, such as `require('pg')`.registerInstrumentations({instrumentations: [new PgInstrumentation(),],});const { Client } = require('pg');exports.handler = async function myHandler(event, context) {let client;try {client = new Client(/* DB connection information */);await client.connect();const result = await client.query('SELECT * FROM users;');return result.rows;} finally {client?.end();}}
To instrument the AWS SDK for JavaScript, OpenTelemetry provides the opentelemetry/instrumentation-aws-sdk instrumentation package.
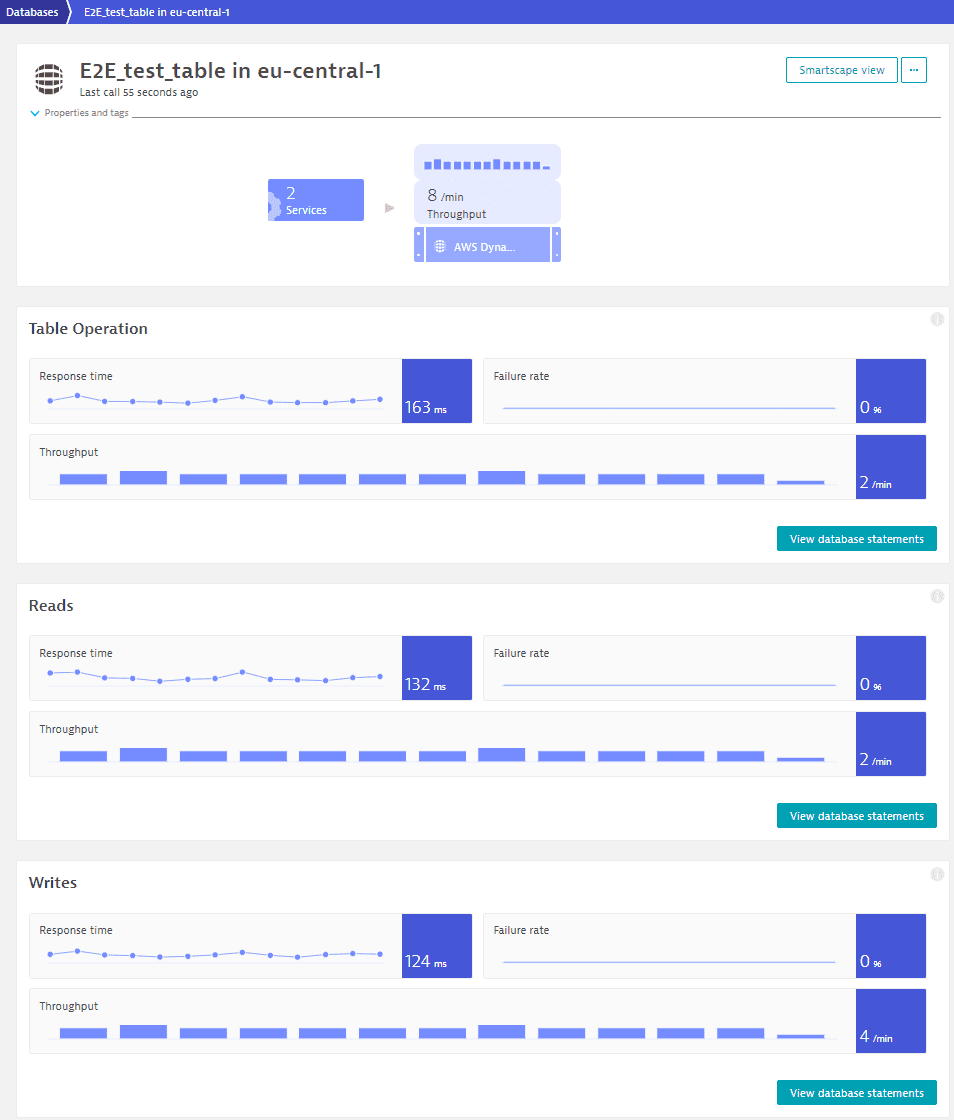
The following code example shows how the opentelemetry/instrumentation-aws-sdk instrumentation package can be used to add observability for calls to a DynamoDB database (Dynatrace version 1.244+).
const AWS = require('aws-sdk');const { registerInstrumentations } = require('@opentelemetry/instrumentation');const { AwsInstrumentation } = require('@opentelemetry/instrumentation-aws-sdk');registerInstrumentations({instrumentations: [new AwsInstrumentation()]});exports.handler = function(event, context) {const ddb = new AWS.DynamoDB();const dbParamsGetDelete = {TableName: 'E2E_test_table',Key: {'svnr': { N: '1234'}}};ddb.getItem(dbParamsGetDelete, function(err, data) {if (err) {console.error('Error', err);} else {console.log('Success', data.Item);}});};
After running the above code snippet, the DynamoDB service page looks as follows.
Use OpenTelemetry Node.js API
OpenTelemetry JavaScript can be used in an SDK-like approach to trace additional operations that aren't covered by an instrumentation package.
const opentelemetry = require('@opentelemetry/api');const tracer = opentelemetry.trace.getTracer('my-package-name');exports.handler = function(event, context) {// create a span using the OTel APIconst span = tracer.startSpan('do some work');span.setAttribute('foo', 'bar');span.end();// ...const response = {statusCode: 200,body: JSON.stringify('Hello from Node.js'),};return response;};
Trace AWS SQS and SNS messages with Node.js
OneAgent version 1.253+ for SQS OneAgent version 1.257+ for SNS
You can use @opentelemetry/instrumentation-aws-sdk package to trace AWS SQS and SNS messages and collect the traces via Dynatrace AWS Lambda extension.

 Install the required dependencies
npm install @opentelemetry/api @opentelemetry/instrumentation-aws-sdk @opentelemetry/instrumentation aws-sdk
 Set up tracing
Use the following code to set up tracing for sending SQS messages to an SQS queue from a Dynatrace-monitored Node.js application:
const { AwsInstrumentation } = require('@opentelemetry/instrumentation-aws-sdk');const { registerInstrumentations } = require('@opentelemetry/instrumentation');// The instrumentation must be registered before importing the aws-sdk module!registerInstrumentations({instrumentations: [new AwsInstrumentation()]});// You can now import the aws-sdk module if needed:const AWS = require('aws-sdk');
 Send an SQS/SNS message
-
Via Node.js HTTP server:
When you make a request to the HTTP server, a message is sent to an SQS queue or SNS topic. If you send a message before the trace root span exists, make sure to create the trace root span manually. For details on the span manual creation with OpenTelemetry, see OpenTelemetry traces with OneAgent.
In this code example, a trace root span for the incoming HTTP request is created by the tracer.
const http = require("http");const AWS = require('aws-sdk');const sqs = new AWS.SQS();const sns = new AWS.SNS();const server = http.createServer((req, res) => {const messageSendCallback = function (err, message) {if (err) {console.log("failed to send a message: " + err);res.writeHead(500);res.end("failure");} else {console.log("Success", message.MessageId);res.writeHead(200);res.end("success");}}if (req.url === "/send-sqs-message") {const params = {DelaySeconds: 10,MessageBody: "[your payload]",QueueUrl: "[your SQS-queue URL]"};sqs.sendMessage(params, messageSendCallback);} else if (req.url === "/send-sns-message") {const params = {Message: "[your payload]",TopicArn: "[your SNS-topic ARN]"};sns.publish(params, messageSendCallback);} else {res.writeHead(404);res.end("not found");}});server.on("close", () => { console.log("Closing server") });server.listen(8004, () => {console.log("server started!");});A request to the
/send-sqs-messagepath should produce traces as shown below.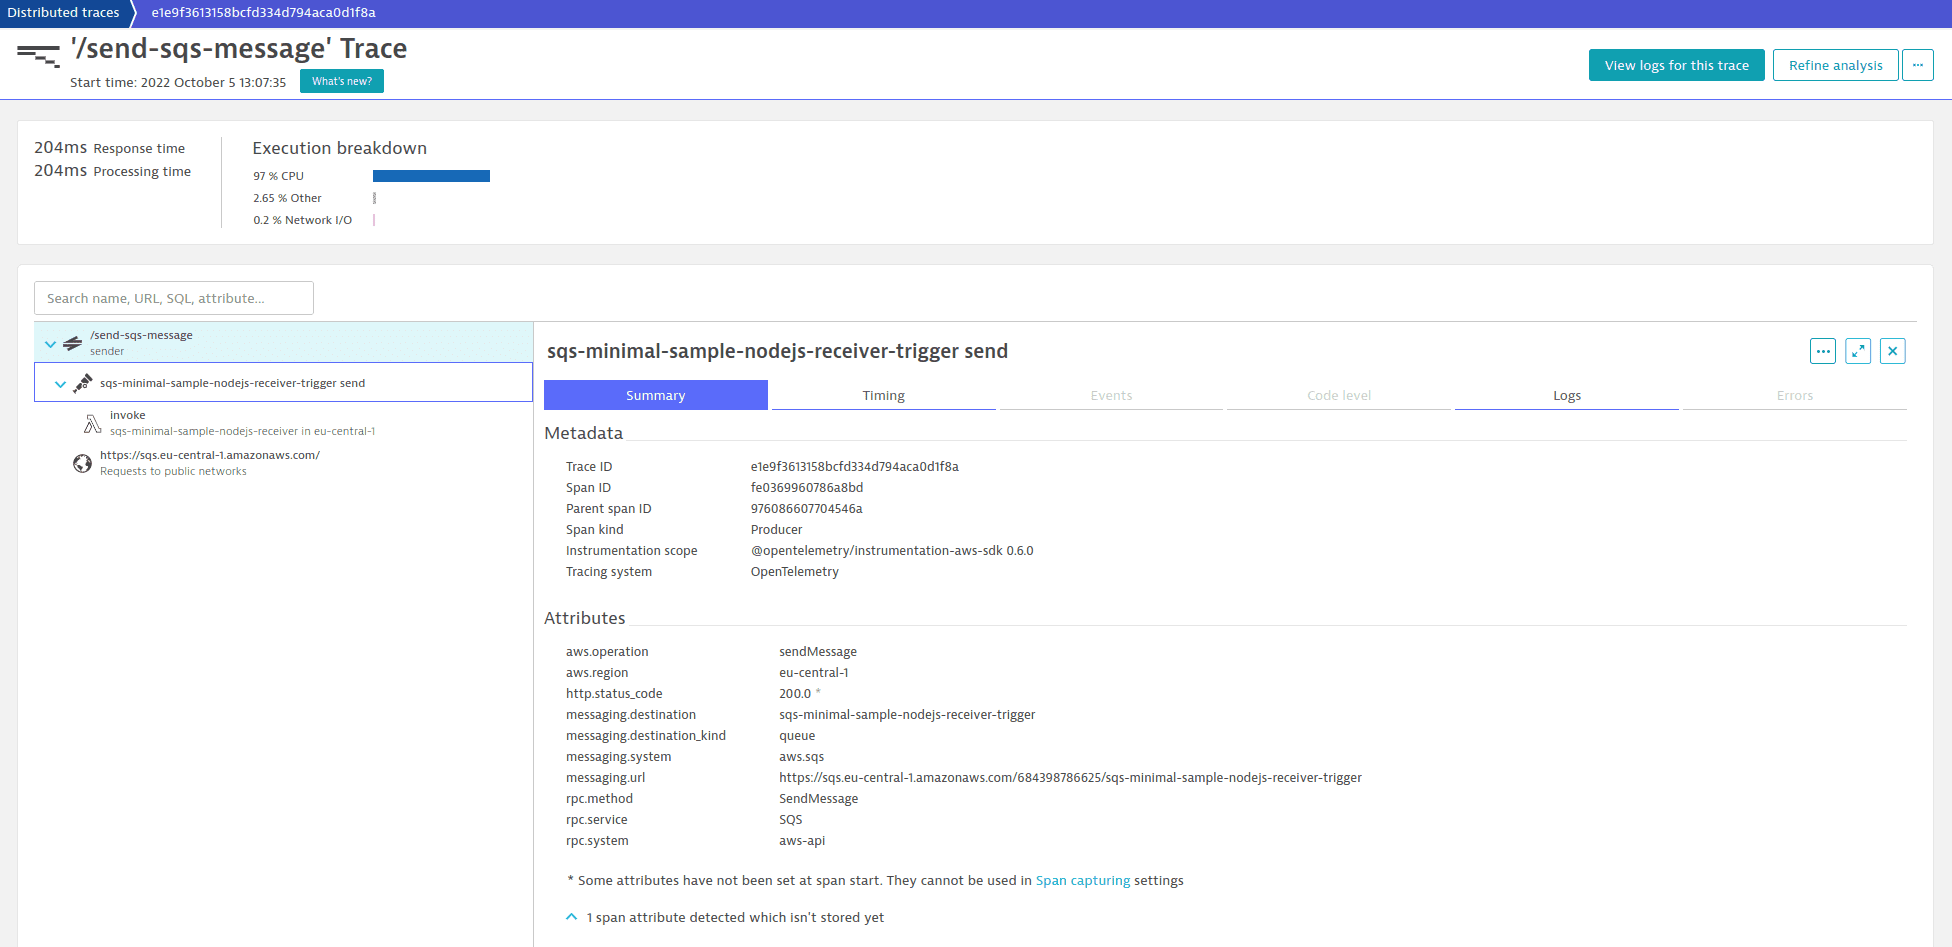
The second node in the distributed trace named
sqs-minimal-sample-nodejs-receiver-trigger sendrepresents the sent SQS message and is generated by the aws-sdk instrumentation.Because
aws-sdkpackage uses HTTP requests to send SQS messages, there is a call toRequests to public networks, which are captured by the OneAgent HTTP instrumentation. The callinvokecomes from the AWS Lambda function subscribed to the SQS queue, which is monitored by the Dynatrace AWS Lambda extension. -
Via AWS Lambda function
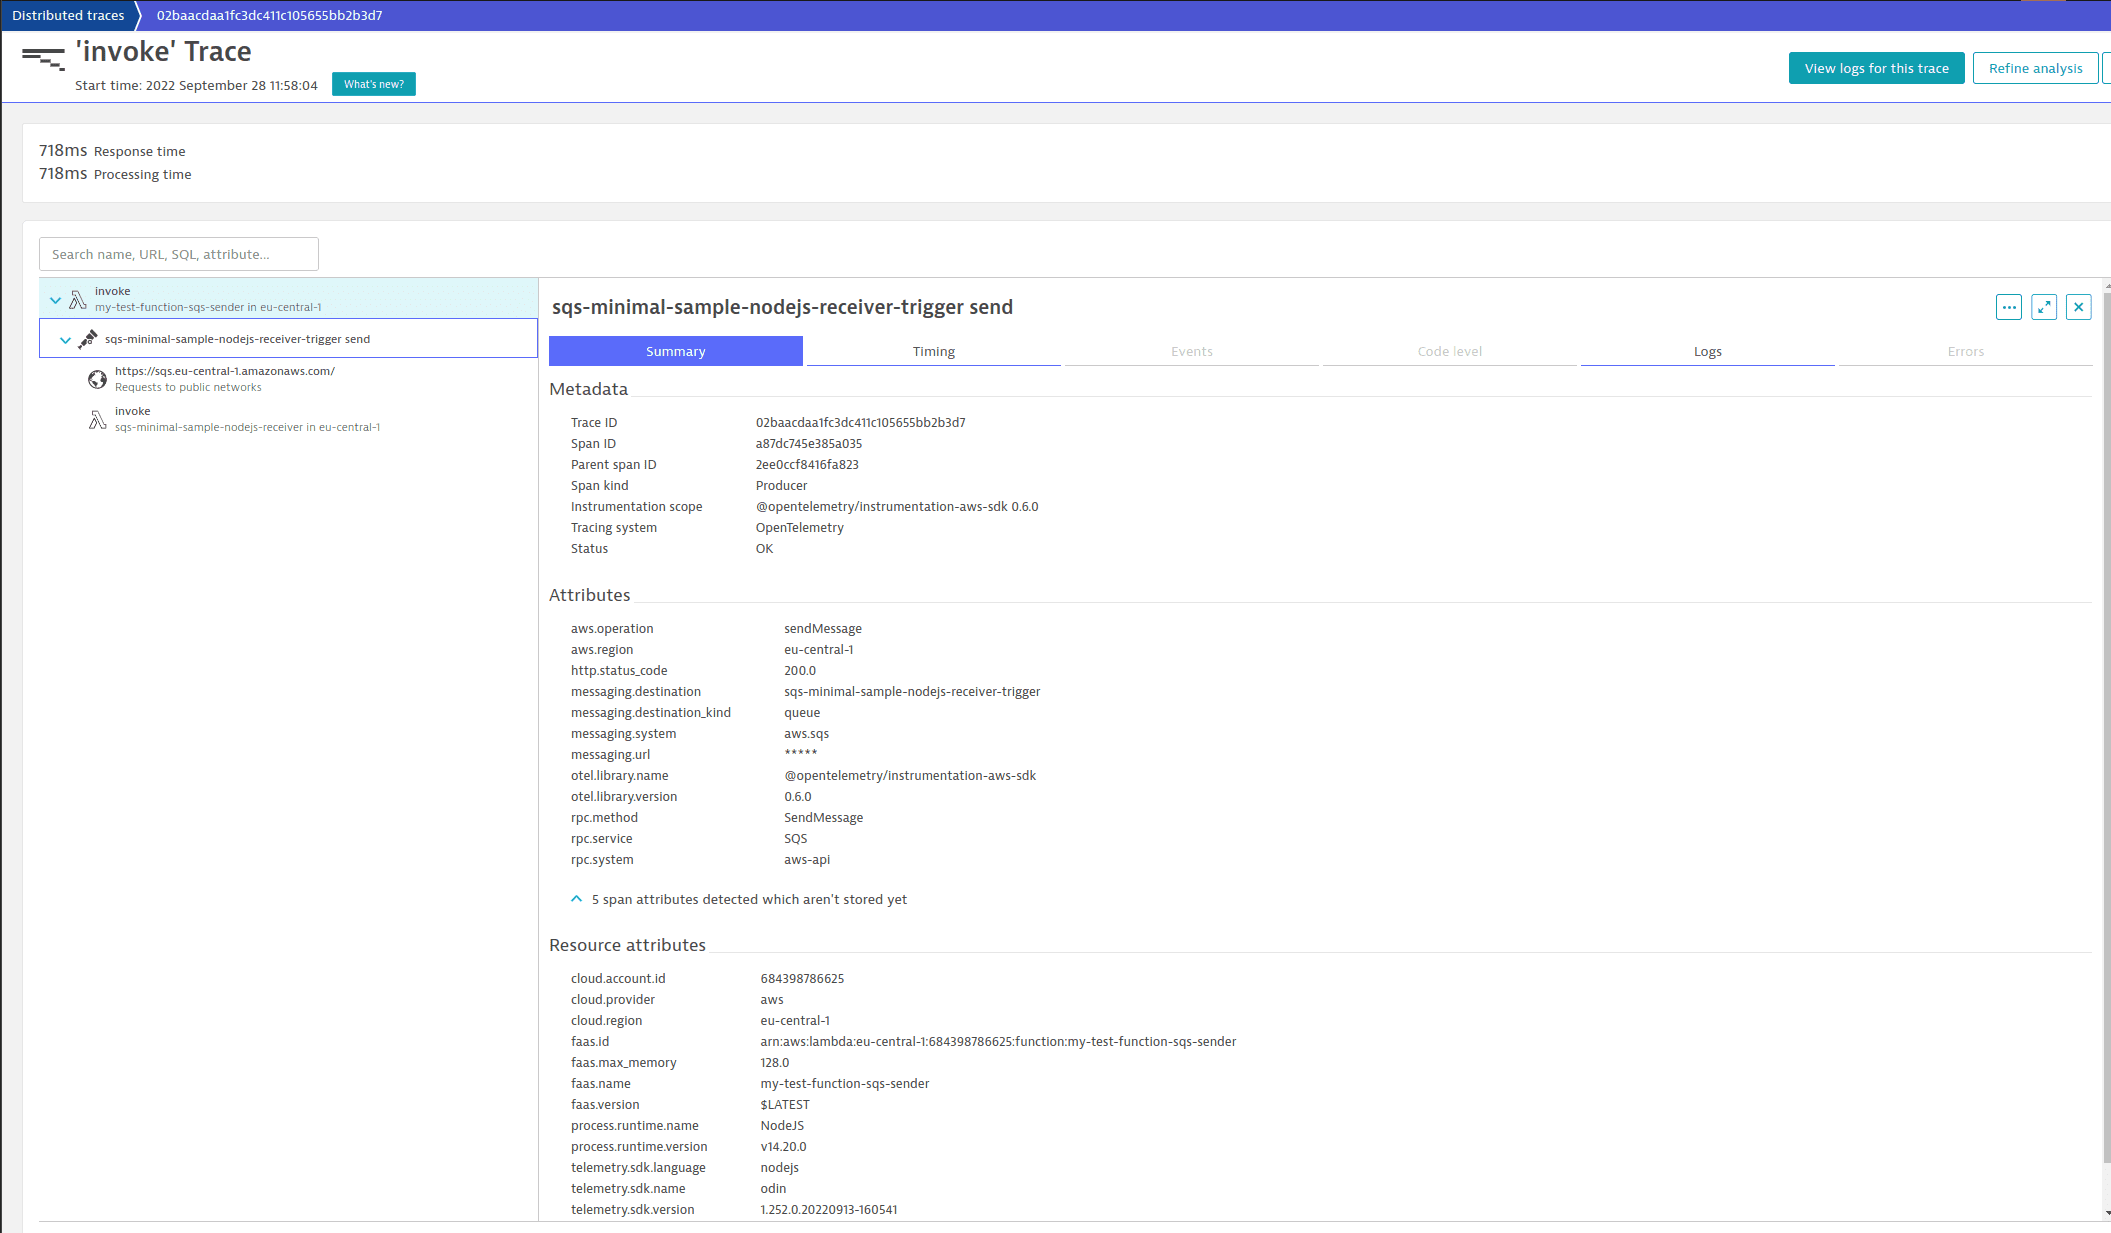
You can send an SQS or SNS message from an AWS Lambda function monitored by the Dynatrace AWS Lambda extension.
const AWS = require('aws-sdk');exports.handler = function (event, context, callback) {const sqs = new AWS.SQS();const params = {DelaySeconds: 10,MessageBody: "[your payload]",QueueUrl: "[your SQS-queue URL]"};sqs.sendMessage(params, function (err, data) {if (err) {context.succeed({statusCode: 500,body: err,});} else {console.log("SQS-Success", data.MessageId);context.succeed({statusCode: 200,body: "SQS-Success",});}});}The resulting distributed trace is similar to the Node.js application example:
Receive an SQS/SNS message
You can trace SQS messages forwarded from
-
An SQS topic
The Dynatrace AWS Lambda extension automatically extracts the parent and creates a Lambda span when an AWS Lambda function is triggered by AWS SQS. However, when a batch of multiple messages is received, only the last message is considered and used for parent propagation. To propagate parents from the batch of multiple incoming messages you can, for example, manually create spans with the parent from each message.
To configure the Dynatrace AWS Lambda extension to allow setting parent spans manually:
-
For the environment variables configuration method, set the
DT_OPEN_TELEMETRY_ALLOW_EXPLICIT_PARENTenvironment variable totrue:DT_OPEN_TELEMETRY_ALLOW_EXPLICIT_PARENT=true -
For the JSON file configuration method, in
dtconfig.json, set the following field totrue:{...other configuration properties..."OpenTelemetry": {"AllowExplicitParent": "true"}}
Then new spans can be created with the parent span extracted from each received SQS message.
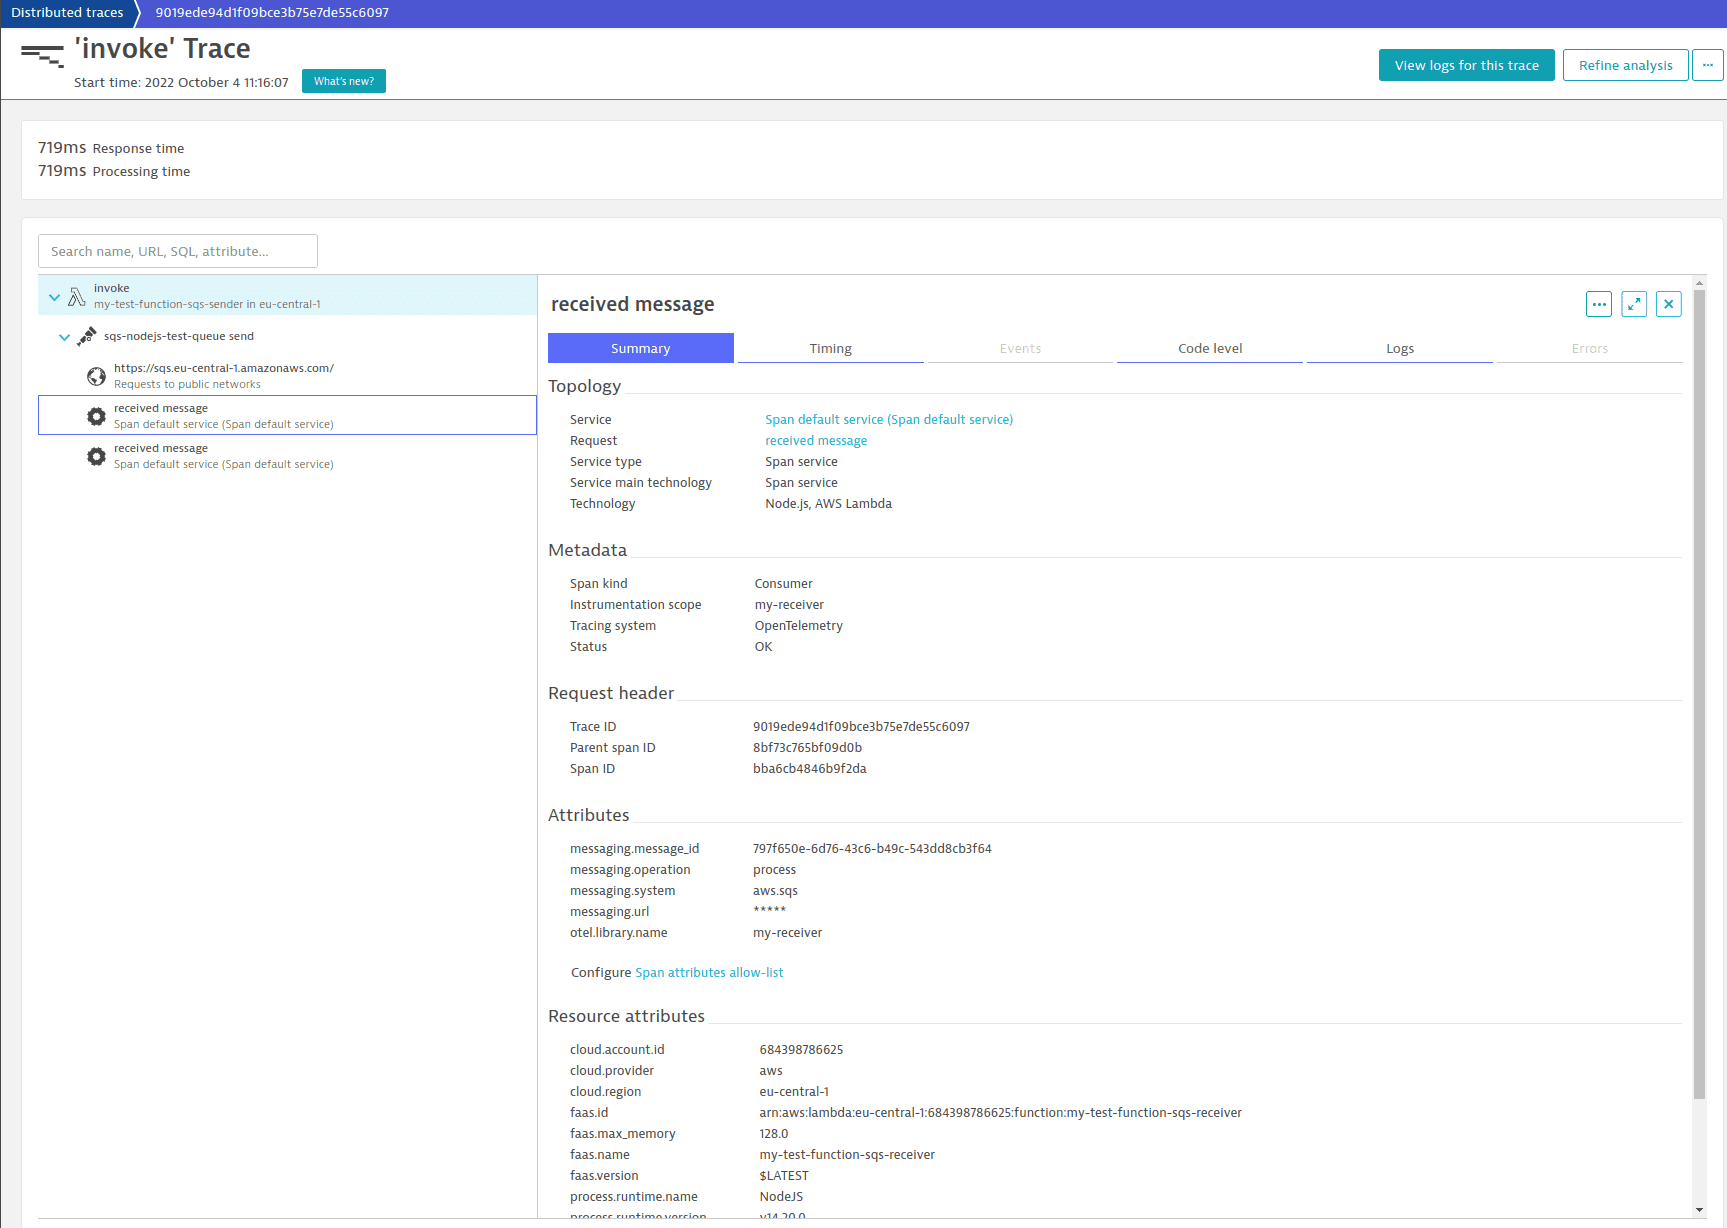
const { propagation, ROOT_CONTEXT, trace, SpanKind } = require("@opentelemetry/api");const { MessagingOperationValues, SemanticAttributes } = require("@opentelemetry/semantic-conventions");const AWS = require("aws-sdk");const queueUrl = "[sqs queue url]";const tracer = trace.getTracer("my-receiver");exports.handler = async (event) => {const sqs = new AWS.SQS();await new Promise((resolve, reject) => {const receiveParams = {MaxNumberOfMessages: 10,QueueUrl: queueUrl,// MessageAttributeNames not needed if @opentelemetry/instrumentation-aws-sdk is usedMessageAttributeNames: propagation.fields()};sqs.receiveMessage(receiveParams, function (err, data) {if (err) {console.log("ERROR: ", err);reject(err);} else if (data.Messages?.length) {data.Messages.forEach((msg) => {console.log("message received:", msg.MessageId)// manual span creationconst ctx = extractParent(msg, /*fromSnsPayload=*/ false);const spanAttributes = {[SemanticAttributes.MESSAGING_MESSAGE_ID]: msg.MessageId,[SemanticAttributes.MESSAGING_URL]: queueUrl,[SemanticAttributes.MESSAGING_SYSTEM]: "aws.sqs",[SemanticAttributes.MESSAGING_OPERATION]: MessagingOperationValues.PROCESS,};const span = tracer.startSpan("received message", { kind: SpanKind.CONSUMER, attributes: spanAttributes }, ctx);// ... Here your actual processing would go...span.end();const deleteParams = {QueueUrl: queueUrl,ReceiptHandle: msg.ReceiptHandle};sqs.deleteMessage(deleteParams, function (err, data) {if (err) {console.log("Delete Error", err);} else {console.log("Message Deleted", data);}});});}resolve();});});};function extractParent(msg, fromSnsPayload=false) {let valueKey = "StringValue"if (fromSnsPayload) {valueKey = "Value";try {msg = JSON.parse(msg.Body)} catch {msg = {}}}const carrier = {};Object.keys(msg.MessageAttributes || {}).forEach((attrKey) => {carrier[attrKey] = msg.MessageAttributes[attrKey]?.[valueKey];});return propagation.extract(ROOT_CONTEXT, carrier)};In the example above,
aws-sdkis used to subscribe and receive messages from an SQS queue. For each incoming message, the parent span is extracted from the message attributes, and a newreceived messagespan with the extracted parent is created. If your SQS queue is subscribed to an SNS topic, the example above might need to be adapted. For details, see Tracing SQS messages forwarded from an SNS topic.The resulting distributed trace with two messages sent to a queue looks as below.
-
-
An SNS topic
For SNS messages that are forwarded to SQS, the message format depends on the raw message delivery configuration on the SNS subscription.
Raw message delivery
Message format
Example
Enabled
The SNS message attributes are converted to SQS message attributes and the parent can be directly extracted from the
MessageAttributesof the SQS message.Disabled
The SNS message and its
MessageAttributesare delivered as a serialized JSON string in the body of the received SQS message. To correctly link the receive span, the parent needs to be extracted from theMessageAttributesof the serialized SNS message.- Receive a batch of multiple messages
Additional configuration is required for this example. When calling the
extractParentmethod, set the value of thefromSnsPayloadparameter totrue.
- Receive a batch of multiple messages
Additional configuration is required for this example. When calling the