Explore findings
- Latest Dynatrace
- How-to guide
The Findings page, accessible by selecting the Findings tab in  Vulnerabilities, consolidates vulnerability findings from Dynatrace and integrated external security tools into a single, actionable view. It helps reduce noise from multiple scanners (network, web app, cloud, container, SAST), providing developers and security teams with a holistic view of vulnerabilities across assets and layers of their environments.
By default, the Findings page displays Dynatrace‑generated results (third‑party and code‑level). To extend it with external findings, set up integrations via OpenPipeline. For the list of supported integrations and setup instructions, see Security events ingest.
Manage results
In the findings table available on the Findings page, you can explore and refine vulnerability finding data:
- Filter and sort findings by severity, product, timeframe, segments, or any available column.
- Format table to switch perspectives between basic and detailed information.
- Show only unique IDs to remove recurring findings.
- Visualize results in a chart.
Filter and sort
You have several options to filter and sort findings:
-
Filter by timeframe: Define the period from which your data is being queried. If you don't specify the timeframe, the default
Last 30 minutesis applied, meaning that the data being fetched is from the last thirty minutes.Show me how
- In the timeframe section, select one of the preset options or select the calendar for customization.
- Select Apply.
-
Filter by segments: Segments provide quick access to predefined logical filters. The segment selector allows you to filter results based on these predefined logical filters.
Show me how
- Open the segment selector .
- In Filter by segments, select a segment.
- Optional To add more segments, select Segments; if available, you can select a value for the selected segment.
- When you're happy with the selection, select Apply.
Selecting one or multiple segments results in fewer findings.
For more information on segments and how they work, see Segments.
-
Filter by expressions: In the filter field, you can use complex filter expressions to select which information is to be displayed, such as:
-
Add multiple filters on the same filter key
-
Use
ANDandORoperators -
Use the wildcard (
*) to search for patterns -
Filter numbers with
>and<
Show me how
To filter by expressions, you have two options:
- Option 1: Manually type the expression in the filter field.
- Option 2: Filter by field values in the results table (hover over a cell and select a filter from the context menu ).
To reset the filters to the default mode, select
 on the right of the filter field.
If the selected filter doesn't show in the table, go to the
 column settings and make sure to add the corresponding column to the table.
 -
-
Sort columns: You can sort the order of columns and of results.
Show me how to sort the order of columns
To select the order of columns, you have two options:
- Option 1: From the column settings (select the column settings , then use the up and down arrows and select Confirm).
- Option 2: From the results table (select a column title, then select Move left or Move right).
Show me how to sort the order of results
To select the order in which results in a column should be displayed:
- Select a column title.
- Select Sort ascending or Sort descending.
If more than 100,000 findings are displayed, sorting isn't available. This limitation prevents performance issues with very large result sets.
To enable sorting, narrow your scope by applying filters. - Option 1: From the column settings (select the column settings
Format table
In the upper-left corner of the table, you can choose between two preset views of the results:
- Select Overview to display basic information about the findings.
- Select Detailed to include more detailed information.
You can easily switch between the two views and customize them (add or remove columns) according to your needs.
Remove duplicates
Many vulnerability findings are cyclical, reappearing in every scan if the environment or feed hasn't changed. This can create noise.
To reduce this noise, Vulnerabilities removes duplicates: only the latest event of a finding with the same ID is displayed.
Two findings are considered duplicates (same finding ID) if all of the following fields match:
object.idvulnerability.idcomponent.namecomponent.versionproduct.nameproduct.vendor
For details on these fields, see the Dynatrace semantic dictionary.
To drill into an issue or specific affected object and observe the full history—even if it contains periodic identical findings—turn off Show unique findings at the top of the table.
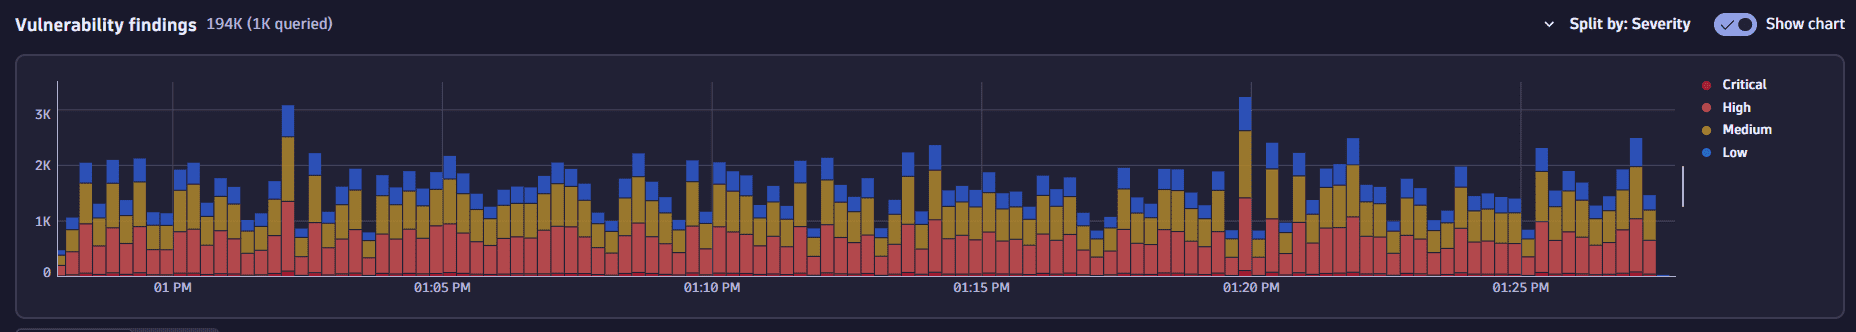
Visualize results
The chart on the Findings page allows you to visualize results based on your selected criteria.
-
The X-axis displays the time when the findings were detected.
-
The Y-axis displays the count of the detected findings.
Select different dimensions using the Split by options in the drop-down list:
-
Severity: Shows the distribution of findings by severity level (for example, Critical, High, Medium, Low).
-
Affected object: Groups findings by the impacted Dynatrace entity (such as process, service, or host).
-
Provider: Separates findings based on the source that reported them (for example, Dynatrace Runtime Vulnerability Analytics or an external security tool).
These options help you quickly identify trends and concentrations across different dimensions, reducing noise and highlighting where attention is most needed.
Gain insights
Selecting a finding in the Findings table opens the overview pane, which provides full context about the vulnerability. This view helps you quickly assess severity, trace affected components, and connect findings to remediation workflows.
The Overview pane includes:
- Details: When the finding was detected, its unique finding and event IDs, and related CVEs and vulnerabilities.
- Severity & score: Severity level, CVSS score, and risk scores (ingested or calculated).
- Affected object: Name, type, and ID of the impacted Dynatrace entity, with links to its page. Select View topology to open
 Smartscape and explore how the affected object relates to other services, processes, and infrastructure components. For details, see View topology.
 - Component: Component name, version, and package URL.
- Finding provider: Which product, vendor, and feature reported the finding (for example, Runtime Vulnerability Analytics).
- Scan: Scan ID and related ingestion details.
Select the Source tab for a complete list of information available from the ingested finding.
Collaborate with other apps
You can extend your analysis beyond Vulnerabilities by sharing or reusing findings in other Dynatrace apps:
- Download findings data as CSV for offline analysis.
- Optional On the Findings page, apply any filters to narrow down the results.
- Select
 to save the current view as a CSV file.
- Open findings in other apps using the menu in the details pane next to the finding name (for example, you can send a finding to the
 Investigations app with a preset DQL query scoped to that event).
 - Open values from the Source tab of a finding's details pane directly in another app for deeper analysis.