Assess coverage
- Latest Dynatrace
- Explanation
- Published Dec 18, 2025
To gain insights into your environment's Runtime Vulnerability Analytics (RVA) coverage and pinpoint areas of exposure, you can use the ready‑made Vulnerability coverage dashboard.
The dashboard currently addresses library vulnerability coverage in runtime. Support for additional types, such as code‑level vulnerabilities, Kubernetes, and runtime coverage, is planned for upcoming releases.
Overview
The Vulnerability coverage dashboard supports your workflows for managing results and prioritizing remediation by providing a clear overview of vulnerability concentration and how coverage evolves over time. It helps you
-
Highlight monitoring gaps by showing processes not monitored, aggregated to the host level.
-
Surface the most affected entities to support prioritization.
-
Track trends in findings and scans over time.
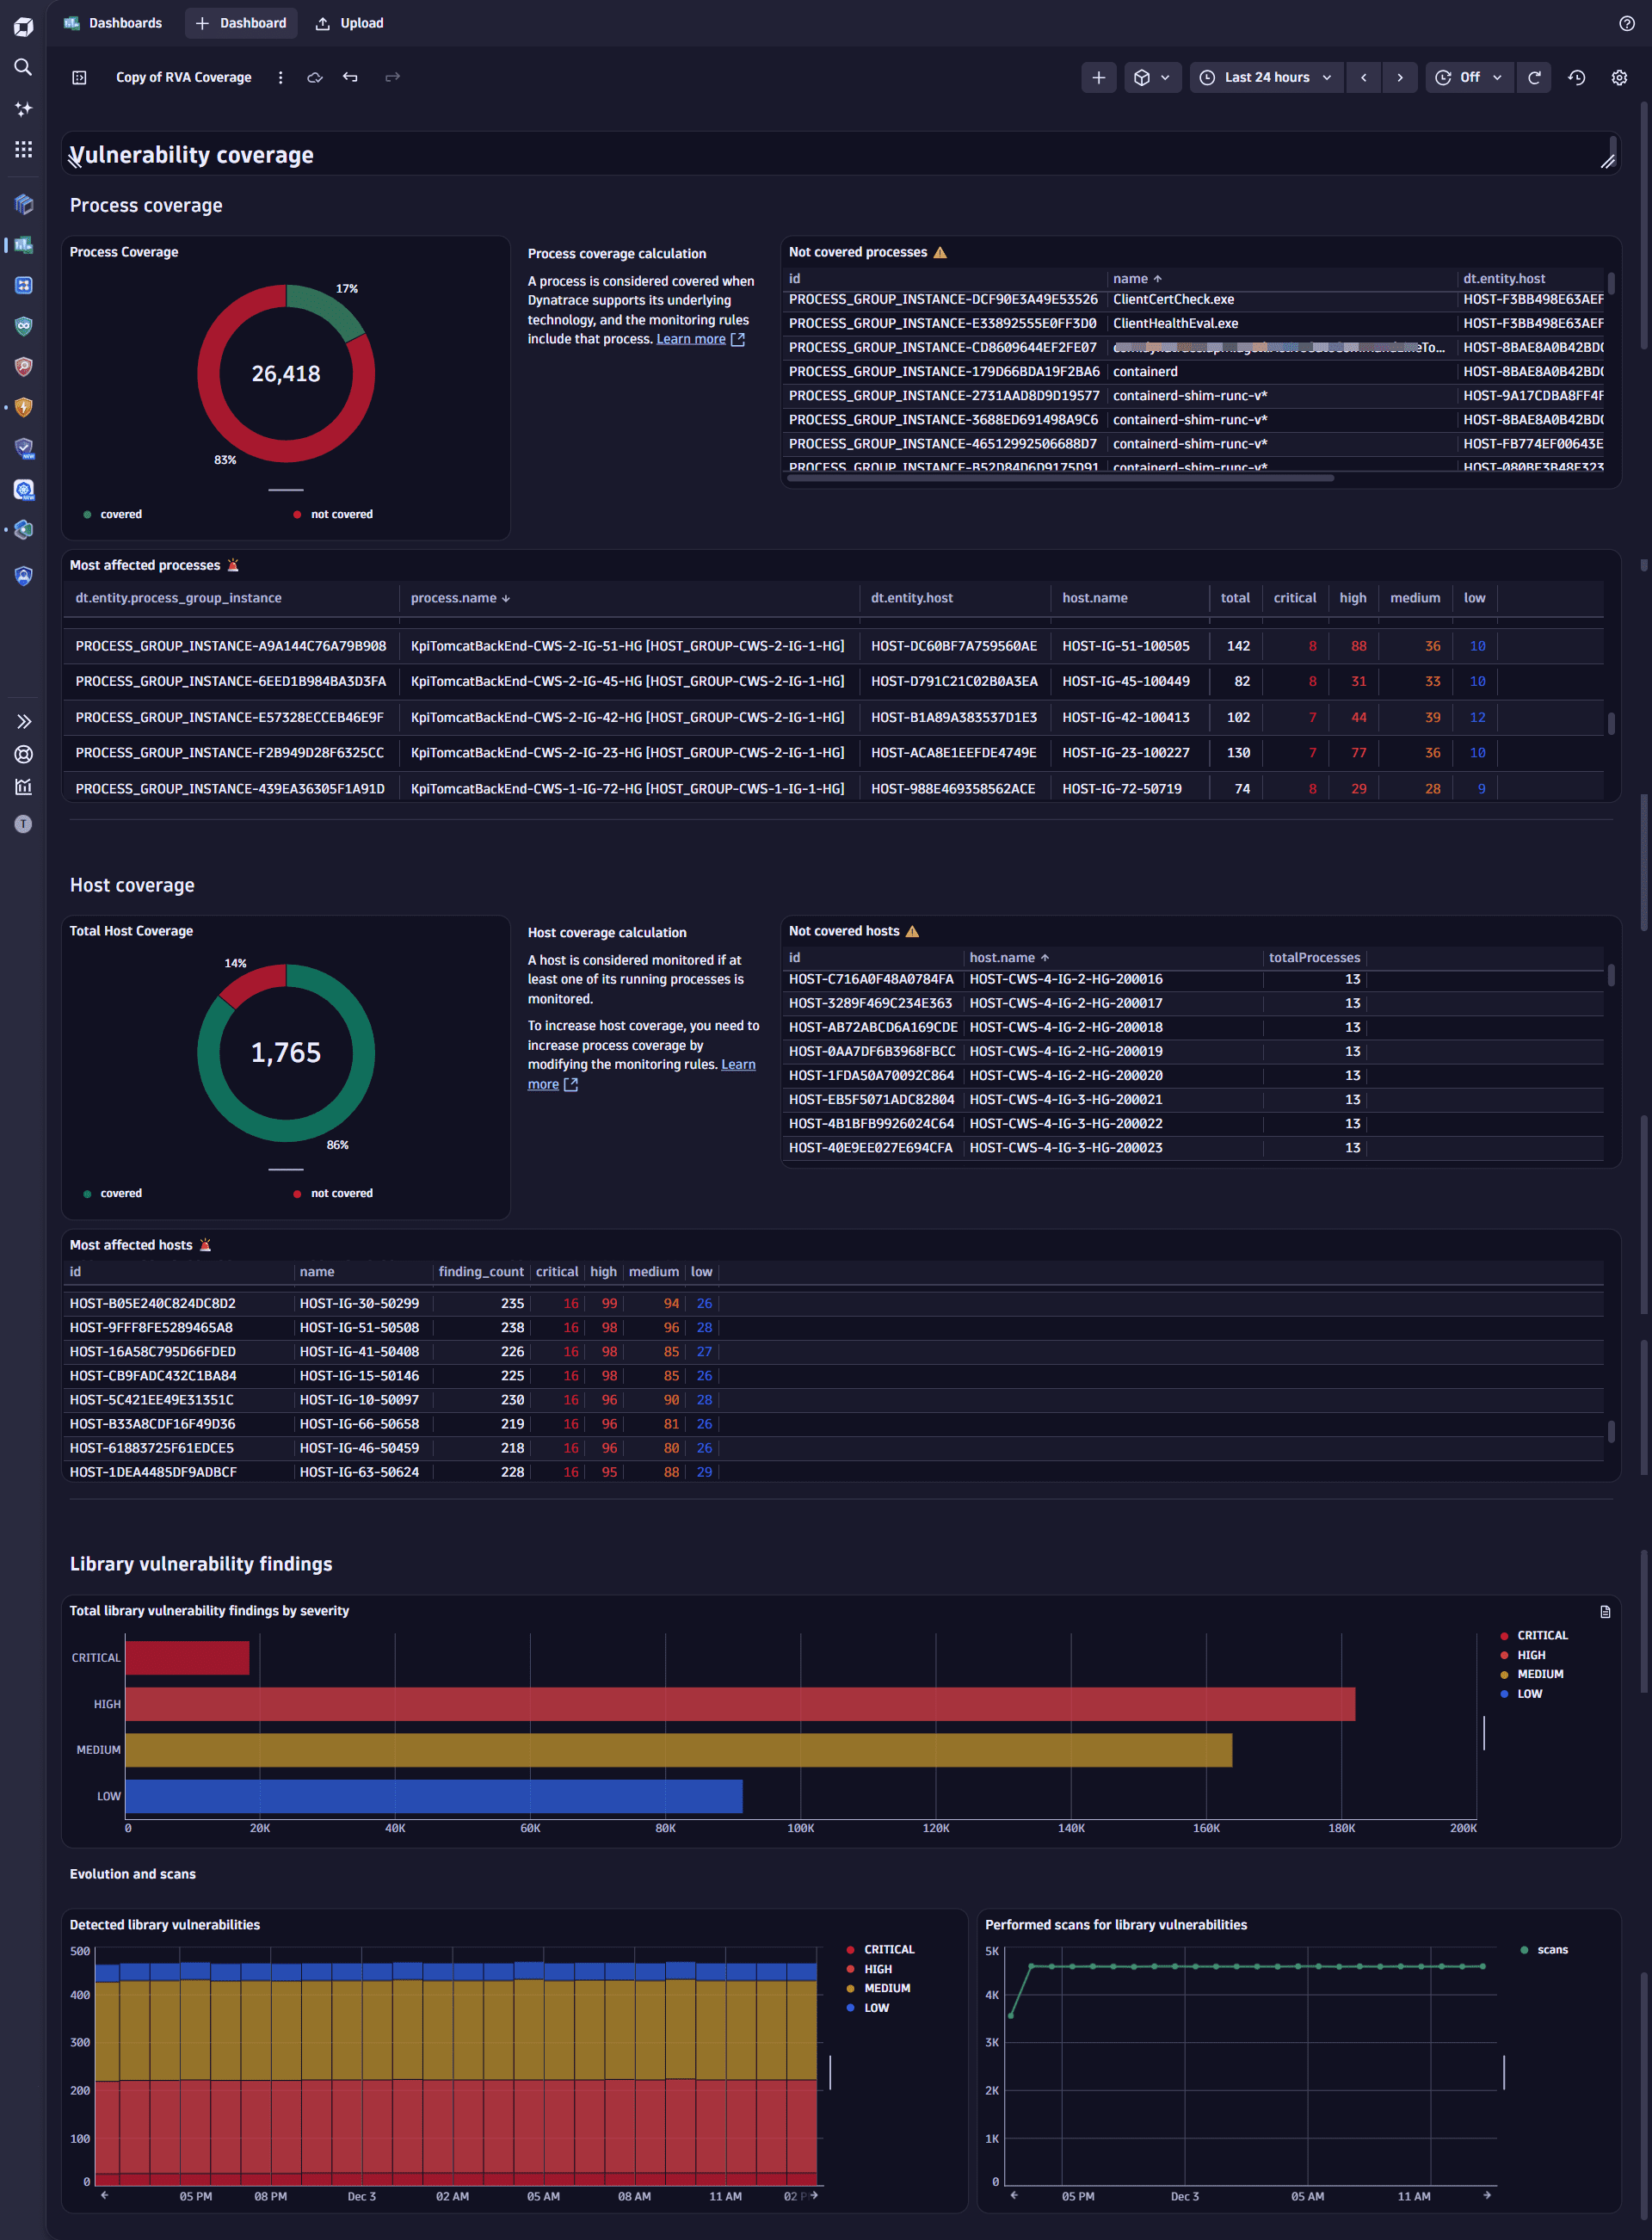
Dashboard example
Prerequisites
Before using the dashboard, ensure the following prerequisites are met:
Access the dashboard
You can open the dashboard either from  Vulnerabilities or
  Dashboards.
-
From
Vulnerabilities:- In the
 help menu on the upper-right of the Prioritization page, select About this app.
 - Go to the Contents tab and select Vulnerability coverage.
- In the
-
From
Dashboards:- On the Dashboards page, select
 Ready-made.
 - Search for and open Vulnerability coverage.
- On the Dashboards page, select
Host coverage calculation
Host coverage is derived from process monitoring. A host is considered covered if at least one of its processes is monitored.
The following explains how host coverage is determined for library vulnerabilities.
- Dynatrace first collects all monitored processes.
- Monitoring rules are applied to processes. If a process is excluded by your monitoring rules, the corresponding host is not considered covered, which decreases overall host coverage.
Improve host coverage
To increase host coverage for third‑party vulnerabilities, focus on ensuring that processes are monitored.
Steps to improve coverage:
- Enable Third-party Vulnerability Analytics globally.
- Enable all the supported technologies you want Dynatrace to monitor. Only hosts running processes on listed and enabled technologies are reflected in coverage.
- Adjust your monitoring rules to include the processes you want monitored. Excluding processes reduces host coverage.
Use cases
With the Vulnerability coverage dashboard, you can accomplish various use cases, such as:
-
Validate monitoring coverage: Ensure critical processes are monitored and reflected at the host level.
-
Support prioritization: Identify the most affected processes and their corresponding hosts before deciding remediation steps.
-
Track exposure trends: Monitor how vulnerability findings evolve and whether scans are keeping pace.
-
Communicate risk: Share high‑level coverage and severity insights with stakeholders.