DevSecOps Lifecycle Coverage with Snyk
Latest Dynatrace
Combining the Dynatrace AI-powered application runtime insights and analytics with the pre-deployment security information from Snyk, DevSecOps Lifecycle Coverage with Snyk provides a holistic view across the DevSecOps lifecycle, enabling you to eliminate blind spots, mitigate security risks, and ensure end-to-end coherent security coverage from development to production.
Capabilities:
- Real-time view and continuous reporting of your container workload coverage, highlighting where containers have slipped into production after bypassing security controls, and enabling you to improve coverage, decrease the number of vulnerable containers, and eliminate unscanned ones.
- A flexible approach, which allows you to drill down into your environment and focus on specific parts that you’re interested in to obtain the exact information you need.
- Container details that cover all levels of your organization’s business-critical applications.
Prerequisites
See below for the Dynatrace and Snyk requirements.
Dynatrace requirements
-
Dynatrace version 1.272+
-
OneAgent version 1.239+
-
Make sure that an outbound connection to Snyk is allowed.
-
Go to Settings > Preferences and select Limit outbound connections.
-
Select Add item and enter
api.snyk.io. -
Select Save changes.
-
-
Make sure the right permissions are enabled.
-
In Dynatrace Hub, select DevSecOps Lifecycle Coverage with Snyk.
-
Select the Technical Information tab.
-
Check the User Permissions section for a list of all the permissions you need to include in the policies bound to user groups that are allowed to use DevSecOps Lifecycle Coverage with Snyk.
For more information, see Manage user permissions with IAM policies and Workflow authorization settings.
-
Snyk requirements
To display container image scan data, you need to set up the connection with Snyk via Workflows.
- Go to DevSecOps Lifecycle Coverage with Snyk.
- On the Overview page, on the Pre-deployment scans are not running section, select Adapt workflow.
- In the Open with dialog, select Create a new workflow with tasks and an optional trigger. This takes you to a preconfigured workflow, with the prefilled values recommended by Dynatrace.
- Below the Time interval trigger node, select Snyk container image coverage ingest.
- In the side panel, select Create a new connection.
- In the Open with dialog, select Open settings.
- On the Snyk connections settings page, select Add item, then enter a name for your connection and your Snyk service account token.
- Select Save changes.
- Go to your workflow and select Run to verify the connection, then select Save to save the workflow.
Global view of security coverage
The Overview page displays a global view of the container workload, container image, and running container coverage in your environment. Container workloads are groups of running containers that together implement an application. Running containers are based on container images, and can belong to different container platforms, such as Kubernetes/OpenShift, Cloud Foundry, Docker, and others.
The following information is displayed.
- N container workloads:

-
A donut chart with the coverage percentage of the container workloads in your environment according to the coverage mode (
Fully covered,Partially covered,Not covered). For details, hover over the donut chart. -
A count of the container workloads detected in your environment, the running containers that form the container workloads, and the container images on which the running containers are based.
-
The coverage of container workloads across the entire DevSecOps lifecycle:
- Fully covered: A container workload is considered fully covered if all its running containers are monitored with Application Security and all the container images on which the running containers are based have been scanned by Snyk.
- Partially covered: A container workload is considered partially covered if only some of its running containers are monitored with Application Security or only some of the container images on which the running containers are based have been scanned by Snyk.
- Not covered: A container workload is considered not covered if none of its running containers are monitored with Application Security and none of the container images on which the running containers are based have been scanned by Snyk.
-
Select View container workloads to navigate to the Container workloads page for detailed information on the coverage of the container workloads in your environment.
For instructions on how to improve workload coverage or troubleshoot coverage issues, see Improve coverage.
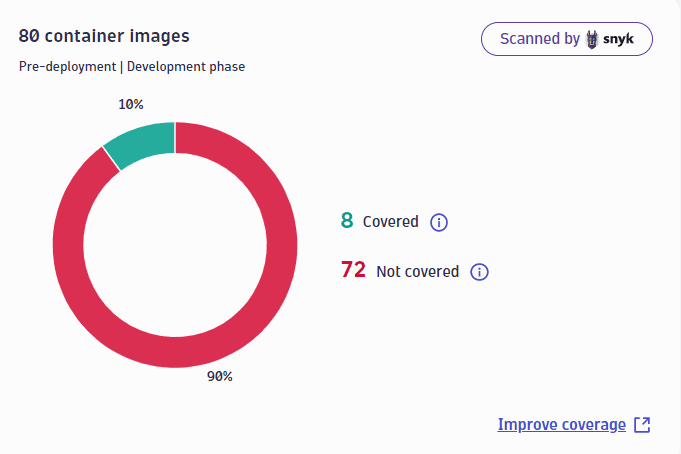
- N container images:

-
A donut chart with the coverage percentage of container images in your environment according to the coverage mode (
Covered,Not covered). For details, hover over the donut chart. -
The coverage of container images in the pre-deployment (development) phase of the DevSecOps lifecycle:
- Covered: A container image is considered covered if it has been scanned by Snyk.
- Not covered: A container image is considered not covered if it hasn't been scanned by Snyk.
-
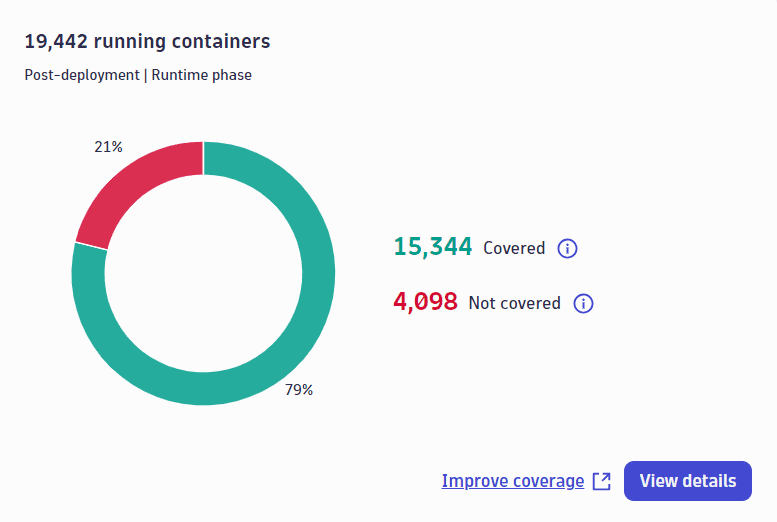
N running containers:

-
A donut chart with the coverage percentage of the running containers in your environment according to the coverage mode (
Covered,Not covered). For details, hover over the donut chart. -
The coverage of running containers in the post-deployment (runtime) phase of the DevSecOps lifecycle:
- Covered: A running container is considered covered if all its processes are monitored with Application Security.
- Not covered: A running container is considered not covered if not all its processes are monitored with Application Security.
-
Select View details to navigate to the Running containers page for detailed information on the running containers coverage.
Drill down into your environment
Apart from the global overview of the security coverage in your environment, you can create different perspectives (or views) that allow you to you examine closely the security coverage in specific parts of your environment. A view corresponds to a part of the environment that you want to drill down into.
To add a view
- On the Overview page, select Add new view.
- Enter a name for your view.
- In the Entity selection field, enter an entity query to define the container workloads that you want to monitor.
A workload is an entity of type CONTAINER_GROUP. Example query: type("CONTAINER_GROUP"), entityName.startsWith("MyWorkload"). For more information on how to write entity selector queries, see Entity selector.
- optional Select Add query to add a new query. You can add as many queries as you want to build your view.
- Select Add view to save your configuration.
Views are displayed in Overview > Your customized views.
A customized view shows security coverage information about your selected container workloads and associated container images and running containers.
A customized view is only visible to the user who creates it.
You can add as many views as you want, and selected partitions can overlap. Selecting a view collapses or expands it.
- Select View container workloads to navigate to the Container workloads page for detailed information on the coverage of the container workloads in your customized view.
- To delete a view, select for the view you want to delete, then select Delete and confirm.
Container workload coverage
The Container workloads page provides detailed information about your container workload devtime and runtime coverage. Two different perspectives are provided, depending on how you navigate to this page:
- To see container workloads in your environment, go to Overview > Global and select View container workloads. This takes you to the global overview of the Container workloads page.
- To see container workloads in a selected customized view, go to Overview > Your customized views and select View container workloads for your desired view. This takes you to the Container workloads page, filtered by your selected customized view.
The following information is displayed.
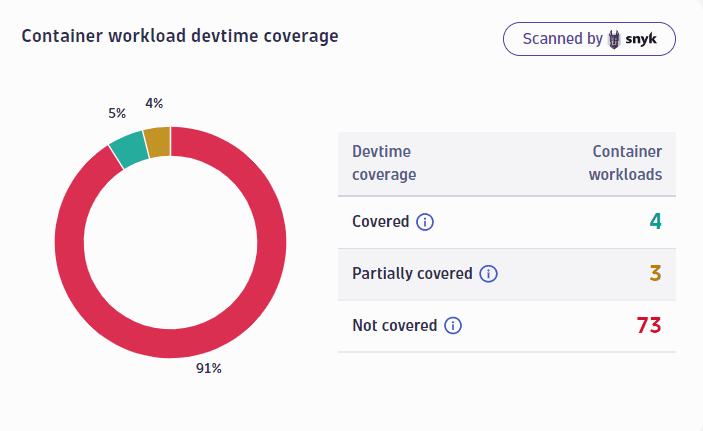
- Container workload devtime coverage:

-
A donut chart with the devtime coverage percentage of the container workloads according to the coverage mode (
Covered,Partially covered,Not covered). For details, hover over the donut chart. -
The coverage of container workloads in the pre-deployment (development) phase of the DevSecOps lifecycle:
- Covered: A container workload is considered covered if all container images of the running containers in that workload have been scanned by Snyk.
- Partially covered: A container workload is considered partially covered if only some container images of the running containers in that workload have been scanned by Snyk.
- Not covered: A container workload is considered not covered if no container image of the running containers in that workload has been scanned by Snyk.
-
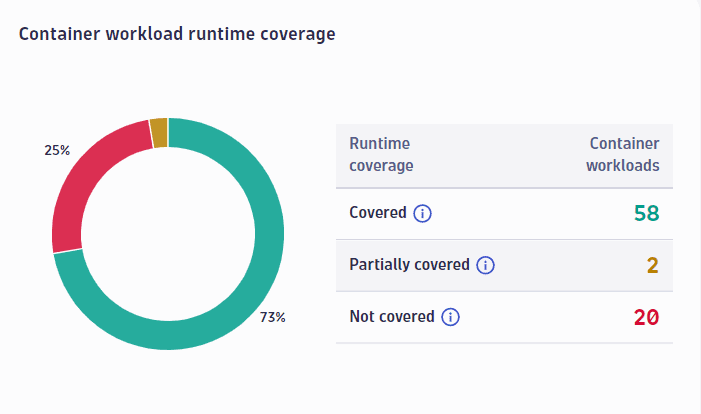
Container workload runtime coverage:

-
A donut chart with the runtime coverage percentage of your container workloads according to the coverage mode (
Covered,Partially covered,Not covered). For details, hover over the donut chart. -
The coverage of container workloads in the post-deployment (runtime) phase of the DevSecOps lifecycle:
- Covered: A container workload is considered covered if all running containers in that workload are monitored with Application Security.
- Partially covered: A container workload is considered partially covered if only some running containers in that workload are monitored with Application Security.
- Not covered: A container workload is considered not covered if no running container in that workload is monitored with Application Security.
Filter container workloads
In the Filter container workloads section, you can filter for container workloads in your whole environment/in your selected customized view by name or coverage mode (Fully covered, Partially covered, Not covered).
- Fully covered: Filters for the container workloads where all running containers are monitored with Application Security and all the container images on which the running containers are based have been scanned by Snyk.
- Partially covered: Filters for the container workloads where only some running containers are monitored with Application Security or only some of the container images on which the running containers are based have been scanned by Snyk.
- Not covered: Filters for the container workloads where no running container is monitored with Application Security and no container image on which the running containers are based has been scanned by Snyk.
Select Open with… > View container group on any container workload to navigate to the overview page of the selected workload.
Running containers coverage
The Running containers page provides detailed information about your running containers coverage. Two different perspectives are provided, depending on how you navigate to this page:
- To see running containers in your environment, go to Overview > Global and, in the Running containers section, select View details. This takes you to the global overview of the Running containers page.
- To see running containers in a selected customized view, go to Overview > Your customized views and, in the Running containers section, select View details for your desired view. This takes you to the Running containers page, filtered by your selected customized view.
Filter running containers
In the Filter running containers section, you can filter for running containers in your whole environment/in your selected customized view by name or coverage mode (Covered, Not covered).
- Covered: Filters for the running containers where all processes are monitored with Application Security.
- Not covered: Filters for the running containers where not all processes are monitored with Application Security.
The list of results includes information about
- The container workload to which the runtime container belongs
- The container image on which the running container is based
Improve coverage
To improve your container workload coverage, you need to improve coverage for both container images and running containers.
Improve coverage for container images
A container image is considered covered when it's scanned by Snyk. To improve coverage for container images
- Make sure your container images are scanned by Snyk.
- Make sure your container images have container IDs, otherwise, they're not matched and excluded.
- In Workflows, check your Snyk connection status or run the workflow manually. For details, see Run a workflow. If the execution fails, edit your connection settings or set up a new Snyk connection.
- Go to Workflows and select
New workflow.
- Set the workflow title (for example,
DevSecOps Lifecycle Coverage with Snyk). - In the side panel, select Time interval trigger and set it to run every
15minutes,every day. - Select
on the trigger node.
- In the side panel, find and select the DevSecOps Lifecycle Coverage with Snyk action.
- Select Create a new connection.
- In the Open with dialog, select Open settings.
- On the Snyk connections settings page, select Add item, then enter a name for your connection and your Snyk service account token.
- Select Save changes.
- Go to your workflow and select Run to verify the connection, then select Save to save the workflow.
Improve coverage for running containers
A running container is considered covered if all its processes are monitored by Dynatrace. To improve coverage for running containers
- Make sure all Dynatrace requirements are met.
- Enable Third-party Vulnerability Analytics globally.
- Enable all the technologies that you want Dynatrace to cover.
- Make sure that your monitoring rules don't exclude any entities.
