Application Security FAQ (Dynatrace Classic)
- Dynatrace Classic
- Troubleshooting
See below for answers to frequently asked questions about Dynatrace Application Security in Dynatrace Classic, including the classic  Third-Party Vulnerabilities app, grouped by topics.
The classic Third-Party Vulnerabilities app is deprecated.
Detection and monitoring
Can I manually start a security scan?
Does Application Security perform a scheduled job? What's the scheduled time interval? Can I manually start a security scan after deploying our changes in the environment?
There are no scheduled scans. Once you enable any Dynatrace Application Security functionality, your environment is automatically monitored for the selected functionality continuously and in real time.
Restrict permissions
How can I give someone view-only access to vulnerabilities?
To restrict specific users to view-only access, so they can view but not manage vulnerabilities, see Customize access.
Resolution
Can a vulnerability be resolved while there are still affected entities?
No. A vulnerability is resolved if there are no longer any affected entities.
Why is my vulnerability still open if there's no affected process group anymore?
A vulnerability is still reported if it's still present in other management zones. To see the affected process groups, select All in the management zone filter.
Why do resolved vulnerabilities show up in every management zone?
Management zone information is not directly attached to a vulnerability. It derives from the vulnerable entities that are affected by the respective vulnerability: a process in a management zone that uses a vulnerable library causes a third-party vulnerability in the respective management zone.
A vulnerability is resolved if there are no vulnerable entities anymore. In the vulnerability list, all resolved vulnerabilities displayed are not filterable by management zone anymore, as that information is not attached to them.
Why am I getting zero resolved process groups for resolved vulnerabilities in my management zone?
For resolved vulnerabilities, I would like to examine resolved process groups to understand which entities were previously affected, but there are zero resolved process groups in my management zone. Why?
On the Vulnerabilities pages, in the Process group overview section, if there are zero resolved process groups displayed for a resolved vulnerability in your management zone, it means that none of the entities that were previously affected and resolved are in that management zone. To find the respective entities, switch the management zone filter to All.
Restart required
Is restart required after enabling or disabling an Application Security feature or functionality?
See below the restart requirements by functionality.
-
Third-party vulnerabilities: An application process restart is required in the following case:
- In Discovery mode, after you enable code-module injection
-
Code-level vulnerabilities: An application process restart is required in the following cases:
- After each step in Enable code-level vulnerability detection:
- Enable Code-level Vulnerability Analytics
- Configure the global code-level vulnerability detection control per technology
- Enable OneAgent monitoring
- After you enable a monitoring rule
- After each step in Enable code-level vulnerability detection:
-
Attacks: An application process restart is required in the following cases:
- After each step in Get started with Runtime Application Protection:
- Enable Runtime Application Protection
- Define the global attack control per technology
- Enable OneAgent monitoring
- After you enable a monitoring rule
- After each step in Get started with Runtime Application Protection:
Why is there a "Restart required" notification on some Application Security pages?
OneAgent version 1.279+
See How can I know if information about vulnerable functions is outdated and what can I do about it?.
Limit monitoring
How can I limit Runtime Vulnerability Analytics monitoring to a specific management zone?
Create a monitoring rule that says Do not monitor if the management zone does not equal <your-management-zone>. After you add, edit, or remove a rule, allow up to 15 minutes for your changes to take effect.
Status updates
What does "last update" on vulnerabilities list pages refer to?
On the third-party vulnerabilities list page, does "Last update" refer to the last time when Dynatrace provided an update? How can I request an update for a vulnerability which was last updated two days ago?
Last update refers to the last time when a vulnerability had a status change. It does not refer to the last time when Dynatrace provided an update. For details, see FAQ: Can I manually start a security scan?.
What are status changes
-
For third-party vulnerabilities, a status change can be when:
- The vulnerability is resolved or reopened
- The vulnerability is muted or unmuted
- The number of affected process groups has decreased or increased
- The risk assessment has changed
- The Dynatrace Security Score has changed
- A new software component is detected
-
For code-level vulnerabilities, a status change can be when:
- The vulnerability is resolved or reopened
- The vulnerability is muted or unmuted
- The risk assessment has changed
- New attacks on the vulnerability have been detected
Different values
Why are there different values on the vulnerabilities page versus Data Explorer?
In Third-Party Vulnerabilities, on the Third-party vulnerabilities list page, when I filter for resolved vulnerabilities over the last seven days, I get 3 vulnerabilities. When I use the metric query (builtin:security.securityProblem.resolved.new.global) in Data Explorer, I get 25. Why are there different values on the vulnerabilities page versus Data Explorer?
The vulnerability list shows the current state (the total count of vulnerabilities that are currently resolved), while using the metric query in Data Explorer shows the change over time.
For example, if two vulnerabilities are open and resolved several times over a period of time, the Data Explorer chart shows only one spike (which is the maximum over the given timeframe) while the vulnerabilities page shows two (because there are currently two resolved vulnerabilities).
To find out how many vulnerabilities were resolved in the given timeframe using the metric query
-
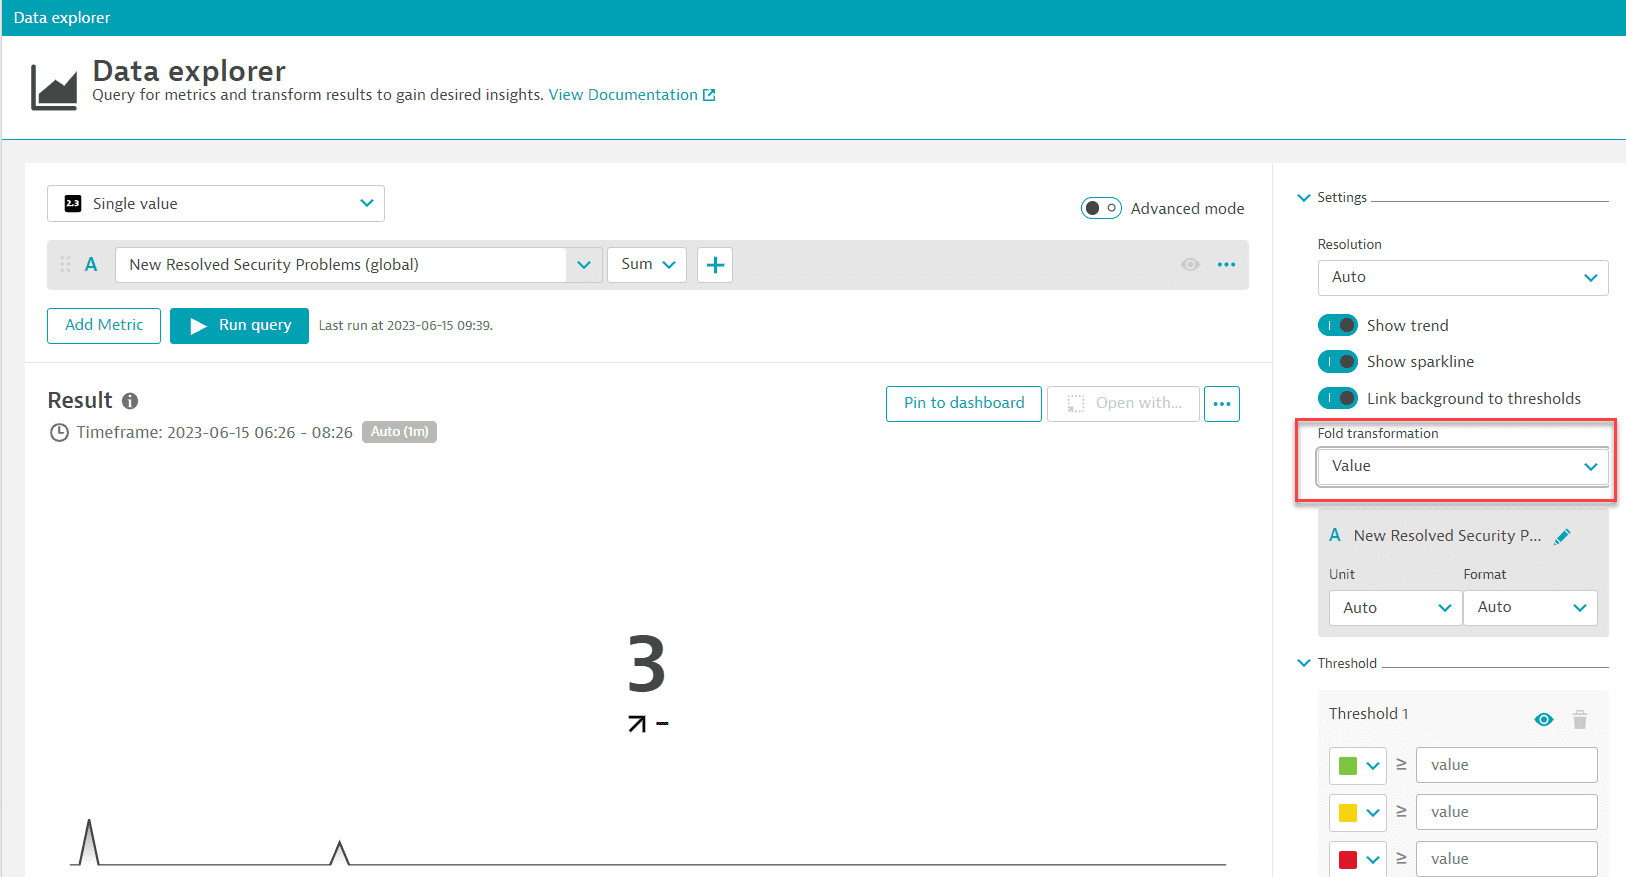
In Data Explorer, set the visualization type to
Single value. -
Expand Settings and set Fold transformation to
Value.This shows how many times the vulnerabilities were resolved during the selected timeframe.
Why are there different values on the Third-party vulnerabilities and vulnerability details pages?
There can be two reasons why values on these pages don't match:
Different number of affected entities
In Third-Party Vulnerabilities, the number of affected entities (process groups or hosts) on the Third-party vulnerabilities page (in the Affected entities column for a specific vulnerability) may differ from the number of affected entities on the vulnerability details page for the following reasons:
-
On the Third-party vulnerabilities page:
-
Affected entities aren't filtered by management zone.
-
Calculations take place every 15 minutes.
-
-
On the vulnerability details page:
-
Affected entities are filtered by management zone.
-
Current data is considered.
-
Different risk factors
In Third-Party Vulnerabilities, the assessment of risk factors (Public exploit, Public internet exposure, Reachable data assets, Vulnerable functions in use) in the infographic on the vulnerability details page and the Davis Security Score column on the Third-party vulnerabilities page may be different from the assessment of risk factors on the vulnerability details page (in the Vulnerability details section) for the following reason:
For the infographic on the vulnerability details page and the Davis Security Score column on the Third-party vulnerabilities page, calculations take place every 15 minutes For the Vulnerability details section on the vulnerability details page, current data is considered.
Why does my vulnerability have a different risk assessment and DSS than its affected entities?
A vulnerability is an aggregation of all its affected entities in your environment; therefore, it can have different values (risk assessment and DSS) than its affected entities. For example, the risk score of an affected entity might be 8.0, while the score of the aggregated vulnerability is 9.0. At the same time, if at least one affected entity is exposed to the internet, the aggregated vulnerability is also exposed to the internet.
Public internet exposure
How is public internet exposure determined?
On Linux hosts, if there's no information, which can happen in different monitoring modes or because something went wrong, public internet exposure is detected via eBPF. Potential states are Public network and Not detected.
To determine public internet exposure, Dynatrace:
- Evaluates all the IP addresses detected in the last hour.
- Discards the private IP ranges.
- Groups the remaining IPs by subnet.
As soon as the respective subnets reach a certain (low) threshold, public internet exposure is triggered.
Vulnerable libraries
Where can I see the origin of a vulnerable library?
On the remediation tracking pages for process groups and processes affected by a vulnerability, you can see where the software component has been loaded from.
This feature is displayed for vulnerable Java, .NET, Node.js, Python, and Go software components.
Note that to display the origin of .NET software components, the minimum OneAgent version required is OneAgent version 1.301+.
Example:
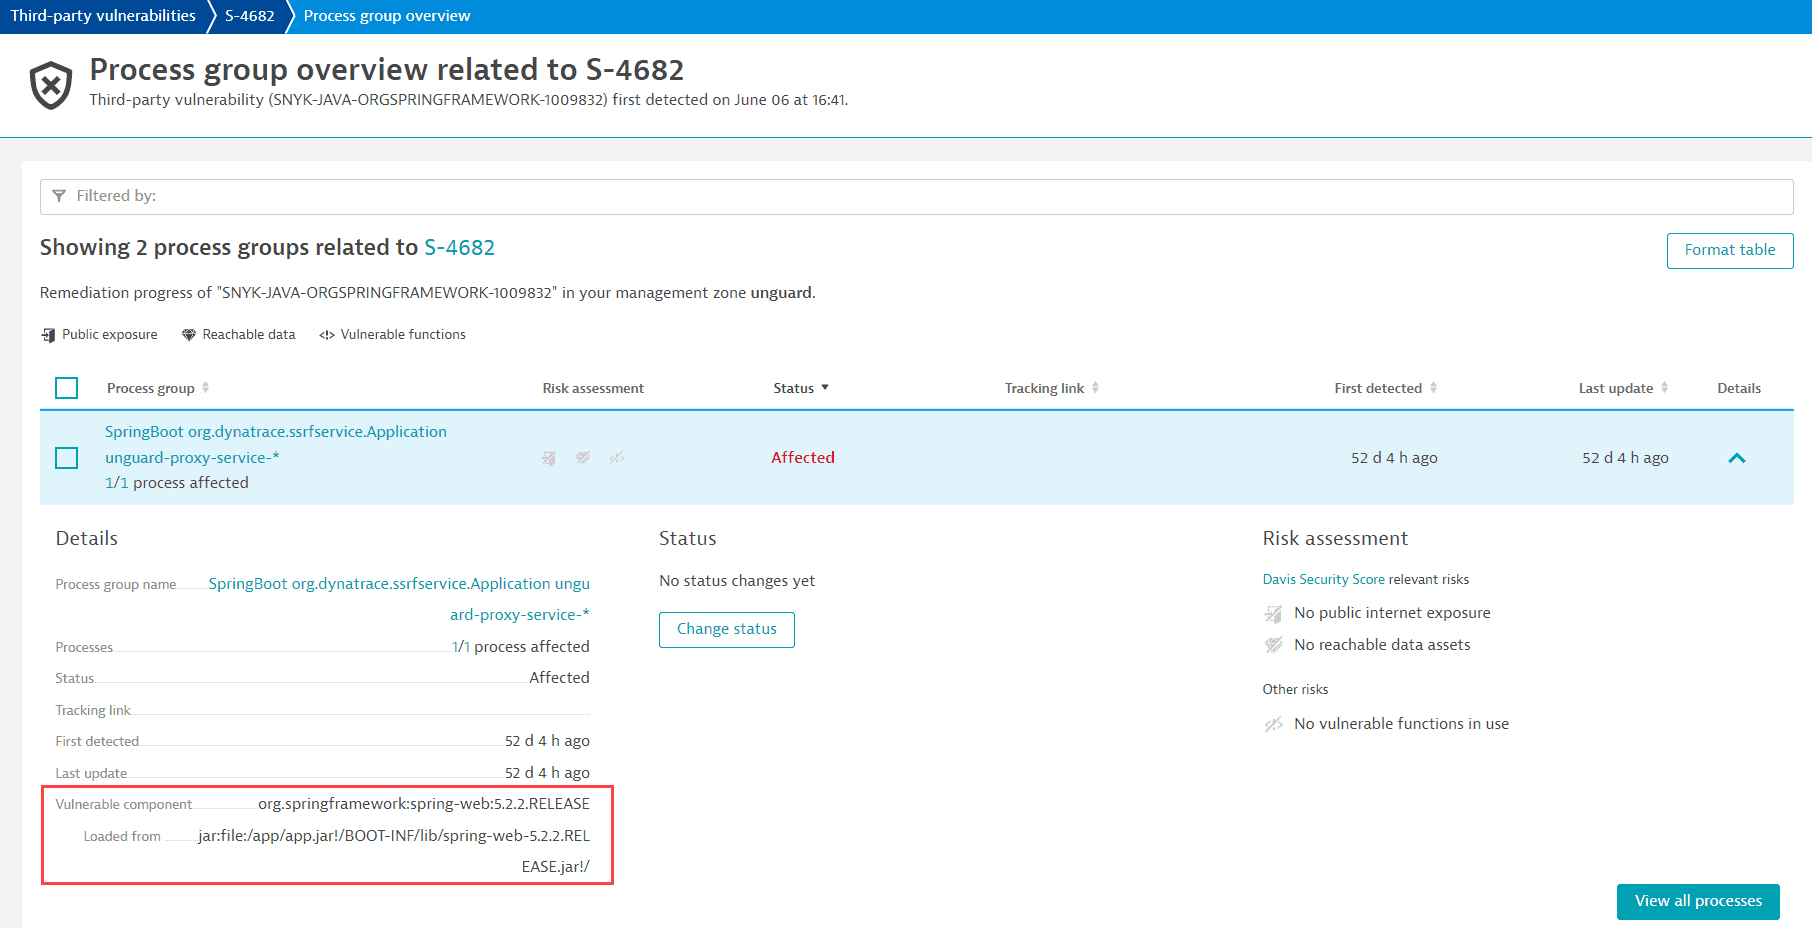
For information on how to navigate there, see Remediation tracking.
Vulnerable functions
How do I know which processes to restart?
If you see the Restart required notification on the details page of a vulnerability, follow the steps below to determine which processes you need to restart:
- On the Process group overview card, select View all process groups.
- Filter by
Vulnerable functions: Restart required. - For each of the resulting process groups, select Details, then select the link provided in the Restart required notification to navigate to the list of processes that require a restart.
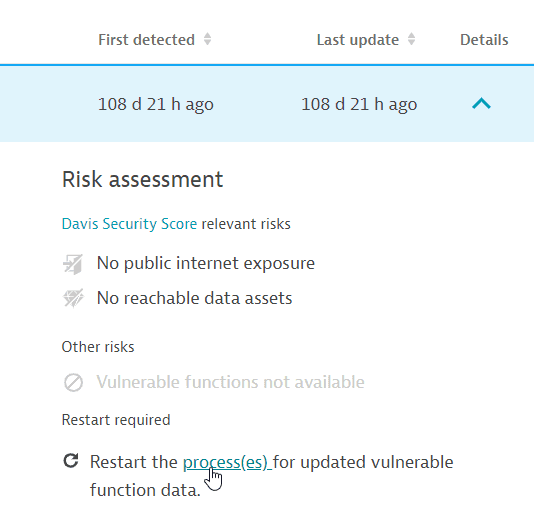
Example result:
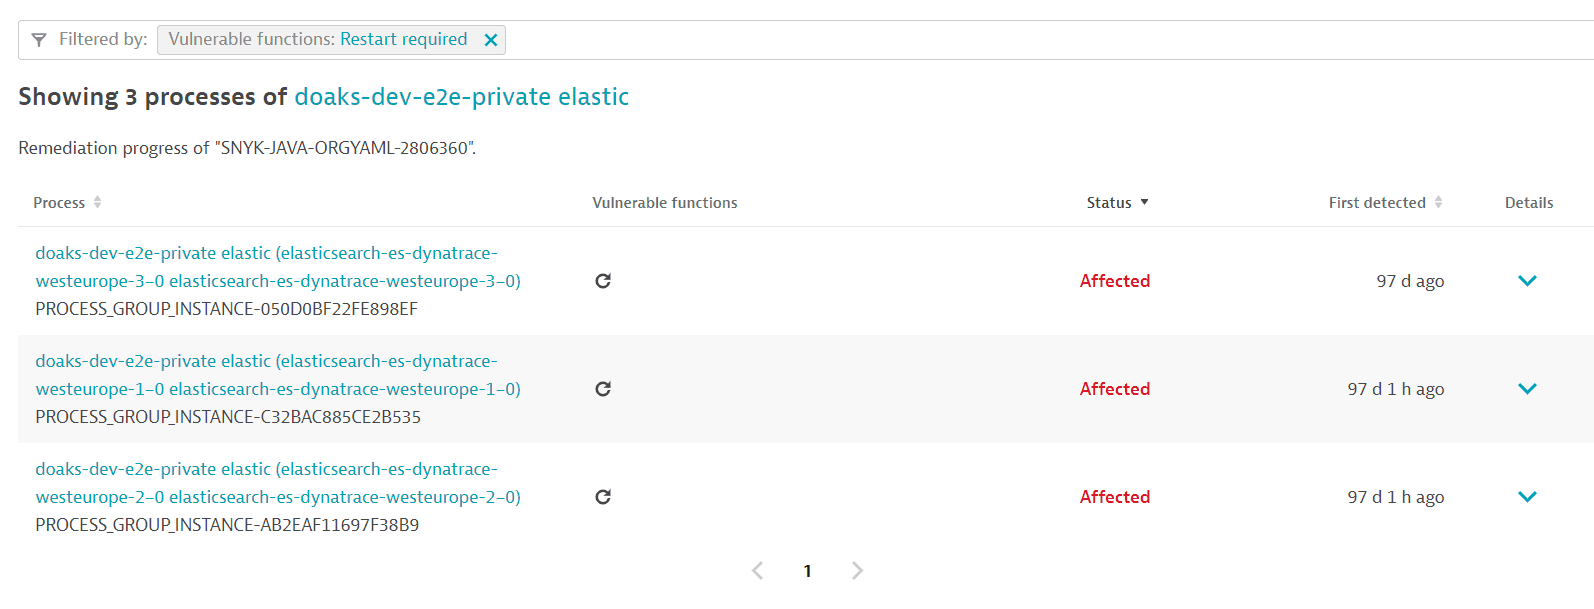
After a process restart, it takes about a minute for the updated information to be displayed.
This feature only works if OneAgent monitoring for Java vulnerable functions is enabled.
Why does my process still need to be restarted after I already restarted it?
If you followed the instructions to identify the process and restarted it, and the process still requires a restart (the same Restart required notification shows up, and the information about vulnerable functions is unchanged), this can happen in Kubernetes deployments if there's no persistent storage.
To fix this issue, add persistent storage by mounting file storage that isn't deleted when restarting your pods.
How can I know if information about vulnerable functions is outdated and what can I do about it?
OneAgent version 1.279+
If new information about a vulnerability's vulnerable functions is available, a process restart is required so that OneAgent can pick up and use the new data. In this case, a Restart required notification or symbol is displayed on
-
A vulnerability's details page (in Vulnerability details > Vulnerable functions)
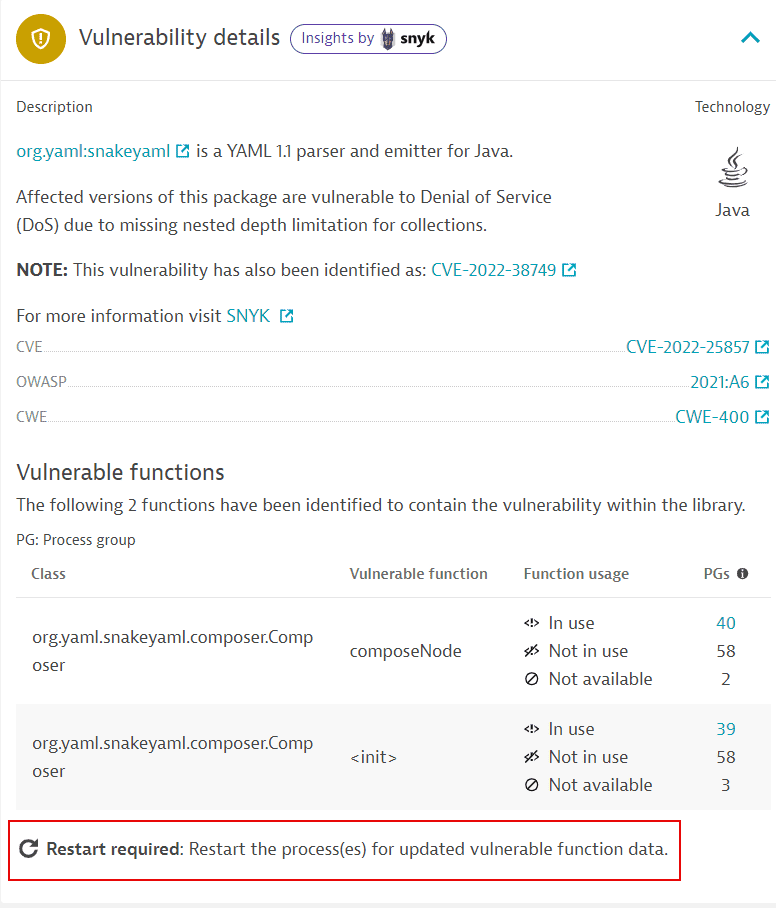 Restart required on a vulnerability details page
-
The process groups overview related to a vulnerability (in Details > Risk assessment)
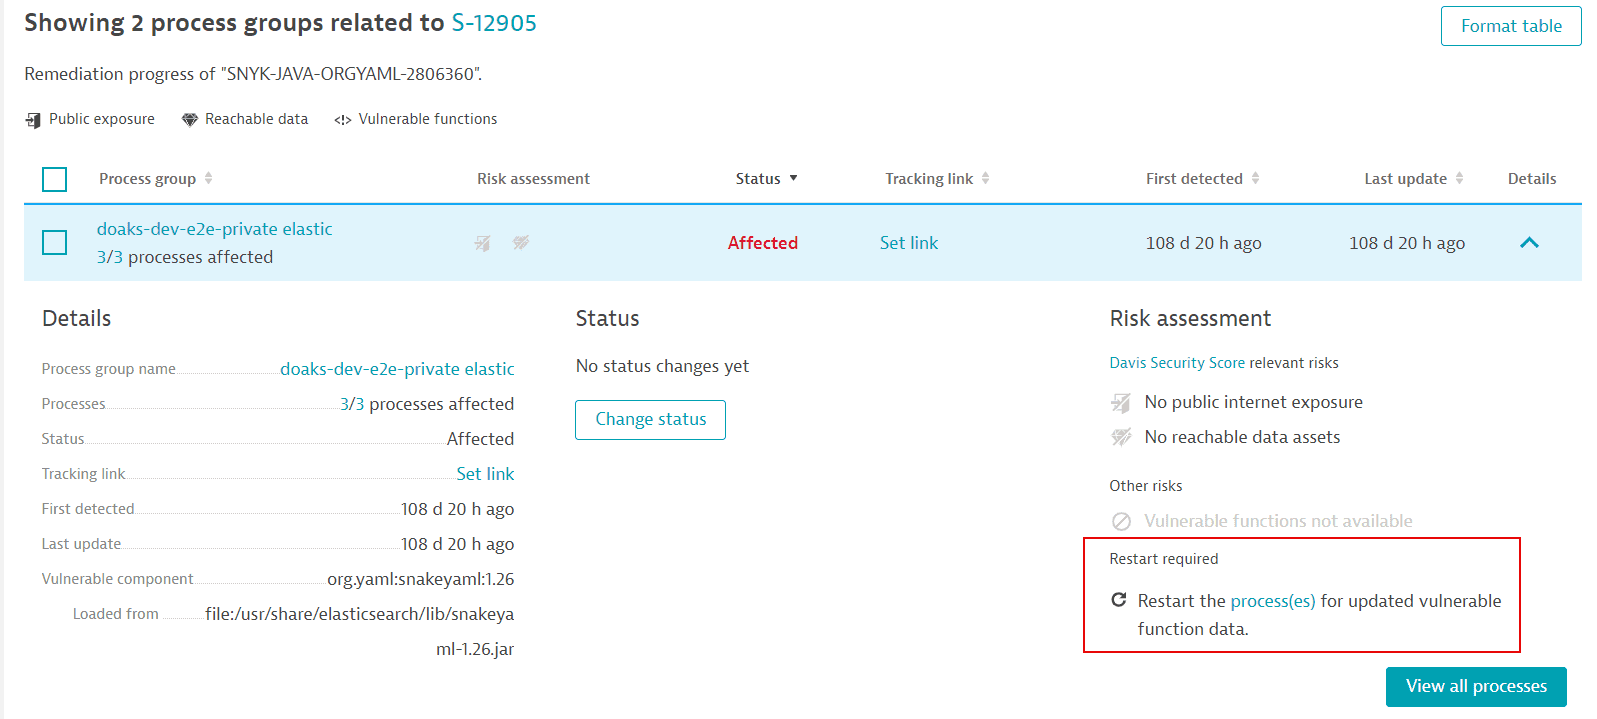 Restart required on the process groups overview related to a vulnerability
-
The process list related to a vulnerability (in Vulnerable functions and Details).
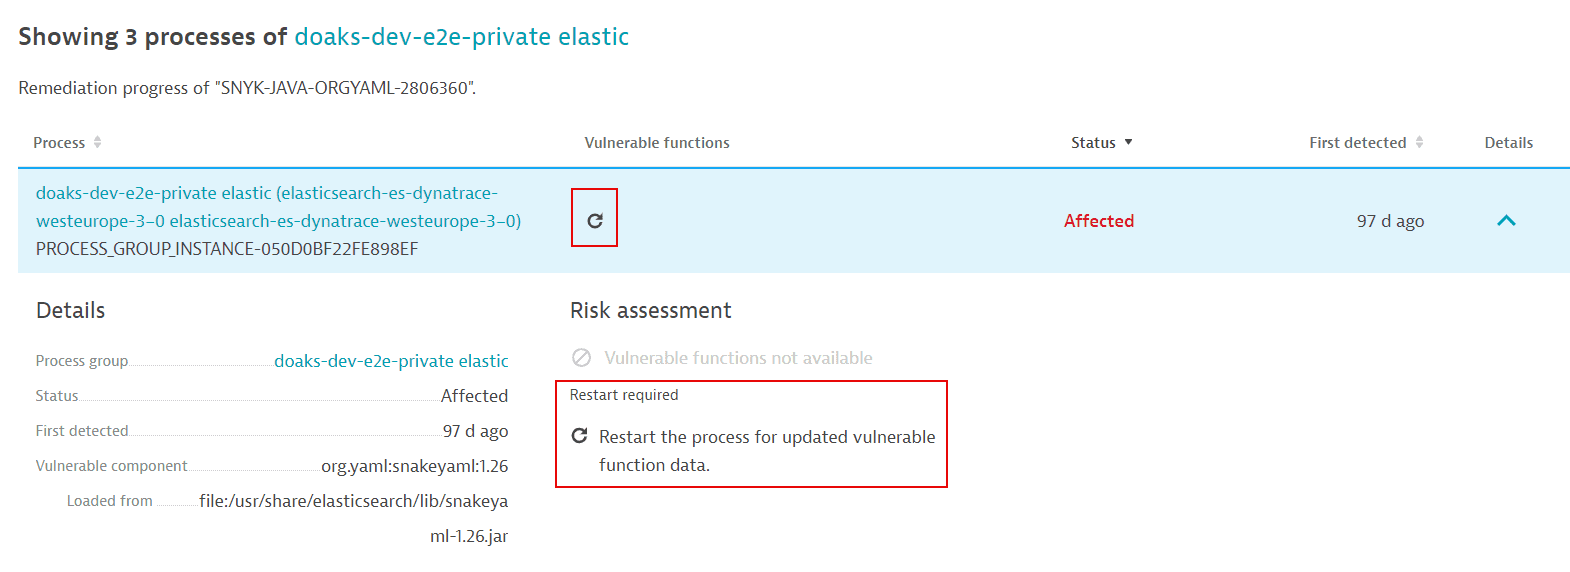 Restart required on the process list related to a vulnerability
Attack blocking mechanism
How does Dynatrace actually block attacks?
Selecting Block attack for an attack doesn't automatically block the respective attack; it takes you to the Settings page where you can create a monitoring rule to block that attack in the future. Dynatrace is configured to block future exploit situations, not the current ones.
The request (thread) with the exploit throws an exception in the running code. All other users who aren't attacking are unaffected.
Dynatrace detects when a user-supplied attack payload finds its way to a line of code that uses an insecure way of
- Talking to the database (SQL injection)
- Talking to the operating system (command injection)
- Doing a JNDI lookup (JNDI injection, such as Log4Shell)
- Doing a HTTP request (SSRF)
The vulnerability is identified with or without an attack. If the data sent by the client includes characteristics of an attack that reaches this line of code, it's deemed an exploit, and Dynatrace alerts or blocks it.
To learn more about the Runtime Application Protection mechanism, see How it works.
How is an attacker's IP determined?
In Runtime Application Protection, to determine an attacker's IP, Dynatrace verifies
- Specific HTTP headers, such as
X-Client-IPorX-Forwarded-For.
- The client IP of the socket connection (if the HTTP headers mentioned above aren't available).