Analyze AWS CloudTrail logs with Security Investigator
Latest Dynatrace
AWS CloudTrail is an AWS service that helps you enable operational and risk auditing, governance, and compliance of your AWS account. Actions taken by a user, role, or an AWS service in an Amazon AWS environment are recorded as events in CloudTrail. Events include actions taken in the AWS Management Console, AWS Command Line Interface, and AWS SDKs and APIs.
In the following, you'll learn how Security Investigator  can help you
Target audience
This article is intended for security engineers and site reliability engineers who are involved in maintaining and securing cloud applications in AWS.
Prerequisites
-
Store your CloudTrail logs to an S3 bucket or CloudWatch.
-
Send CloudTrail logs to Dynatrace. There are two options to stream logs:
-
Amazon S3 recommended
-
-
Knowledge of
Before you begin
Follow the steps below to fetch the AWS CloudTrail logs from Grail using Security Investigator and prepare them for analysis.
 Fetch AWS CloudTrail logs from Grail
Once your CloudTrail logs are ingested into Dynatrace, follow these steps to fetch the logs.
-
Open Security Investigator
 .
. -
Select
Case to create an investigation scenario.
-
In the query input section, insert the DQL query below.
fetch logs, from: -30min| filter aws.service == "cloudtrail" -
Select
Run to display results.
The query will search for logs from the last 30 minutes, which have been forwarded from an AWS log group that contains the word
cloudtrail.If you know in which Grail bucket the CloudTrail logs are stored, use filters to specify the bucket to improve the query performance.
fetch logs, from: -30min| filter dt.system.bucket == "my_aws_bucket"| filter aws.service == "cloudtrail"For details, see DQL Best practices.
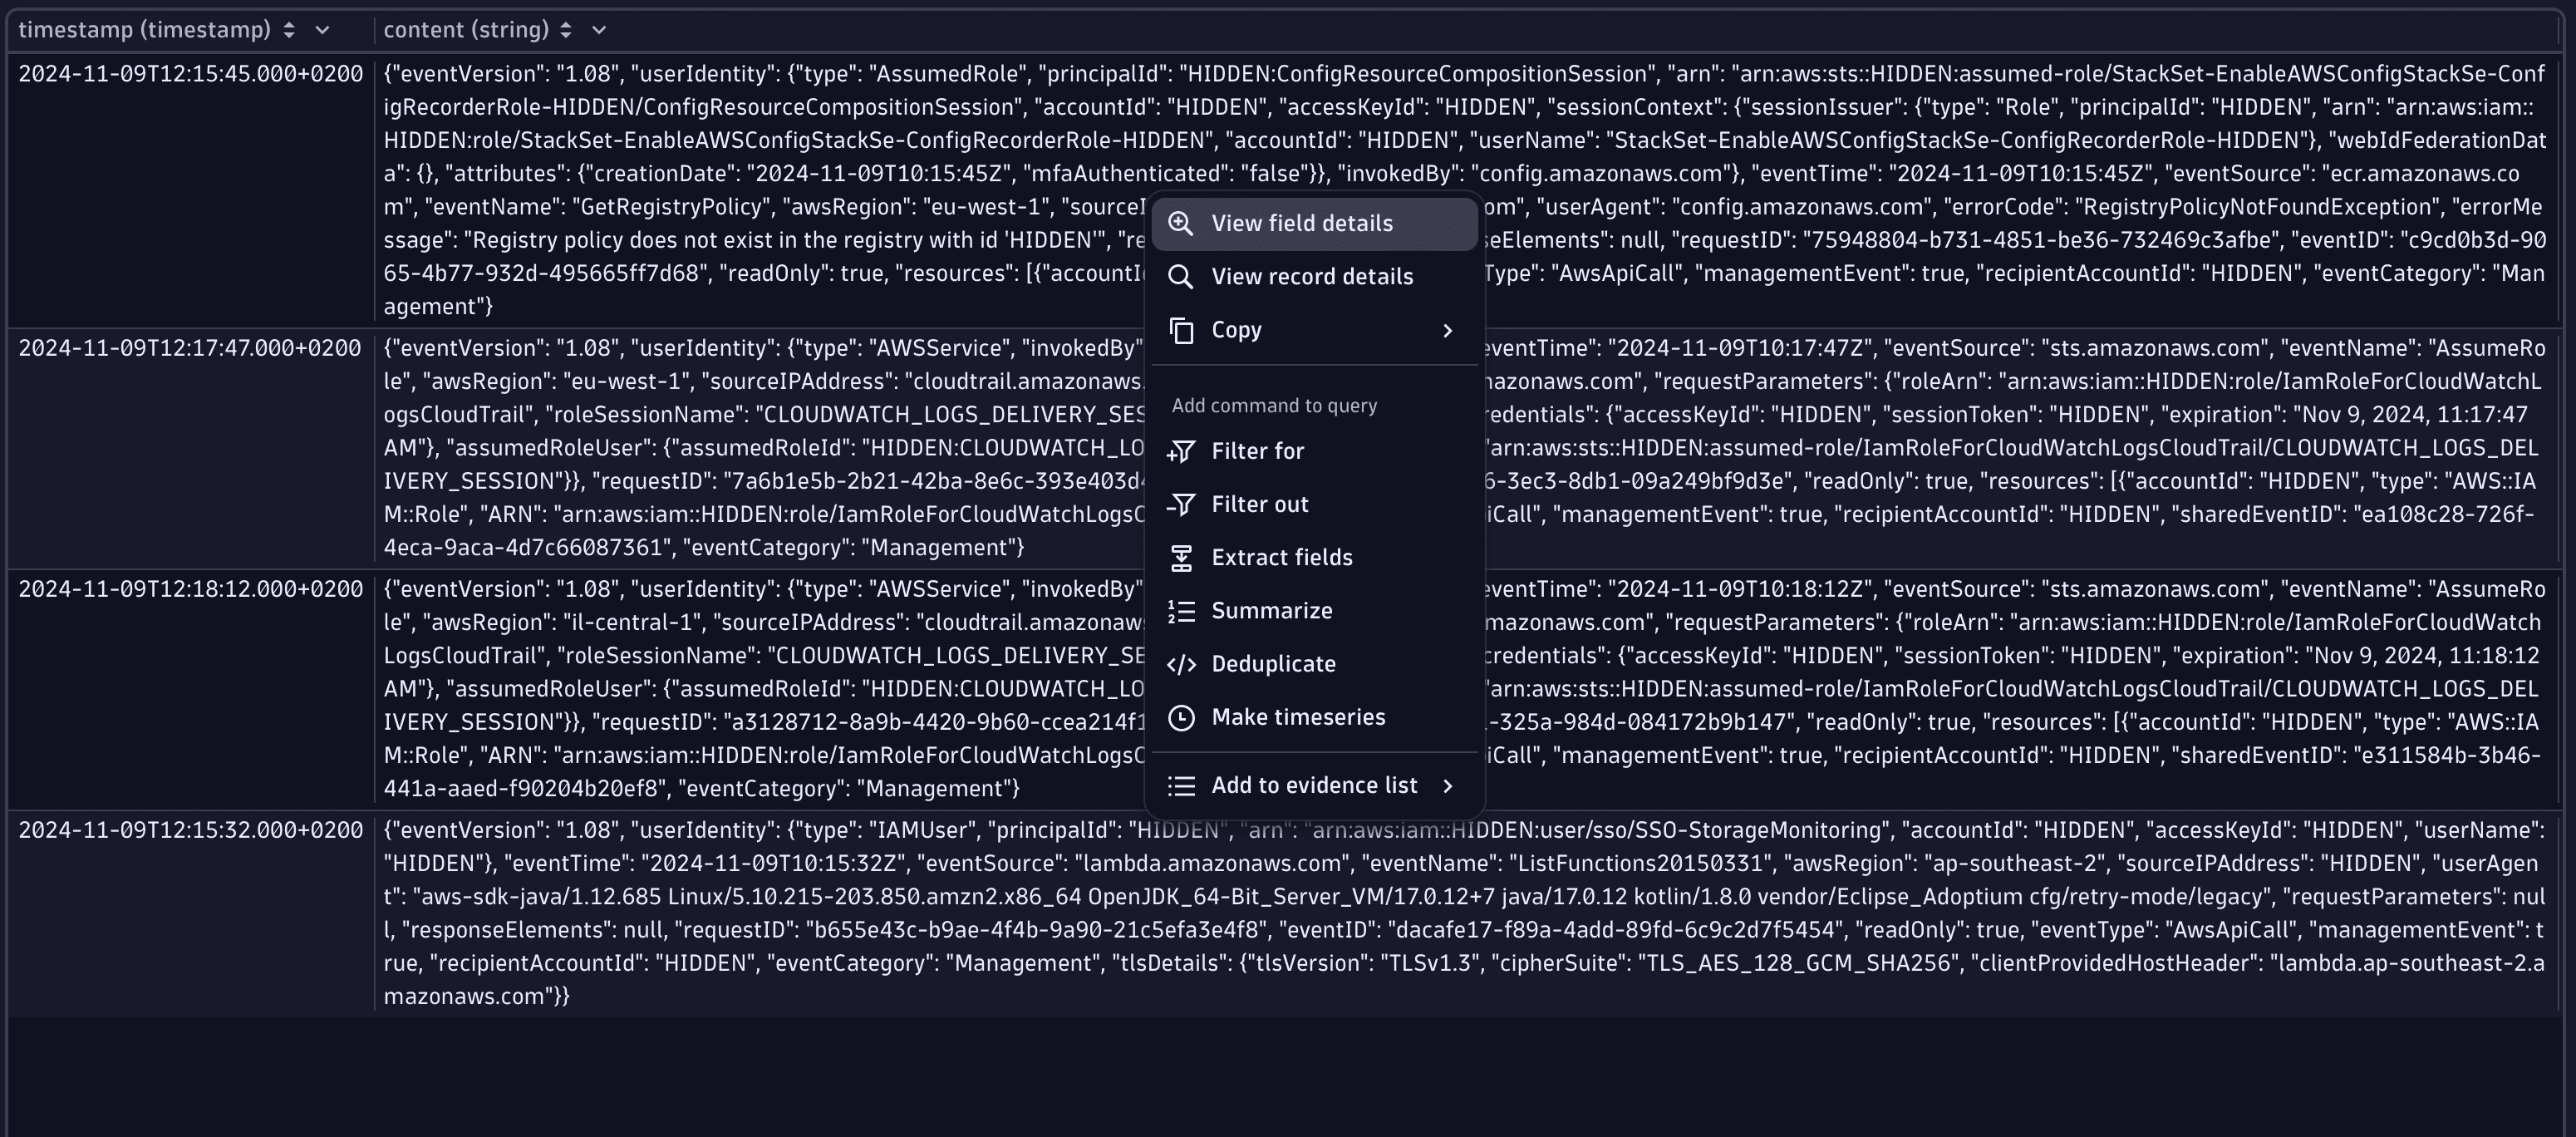
The results table will be populated with the JSON-formatted events.
-
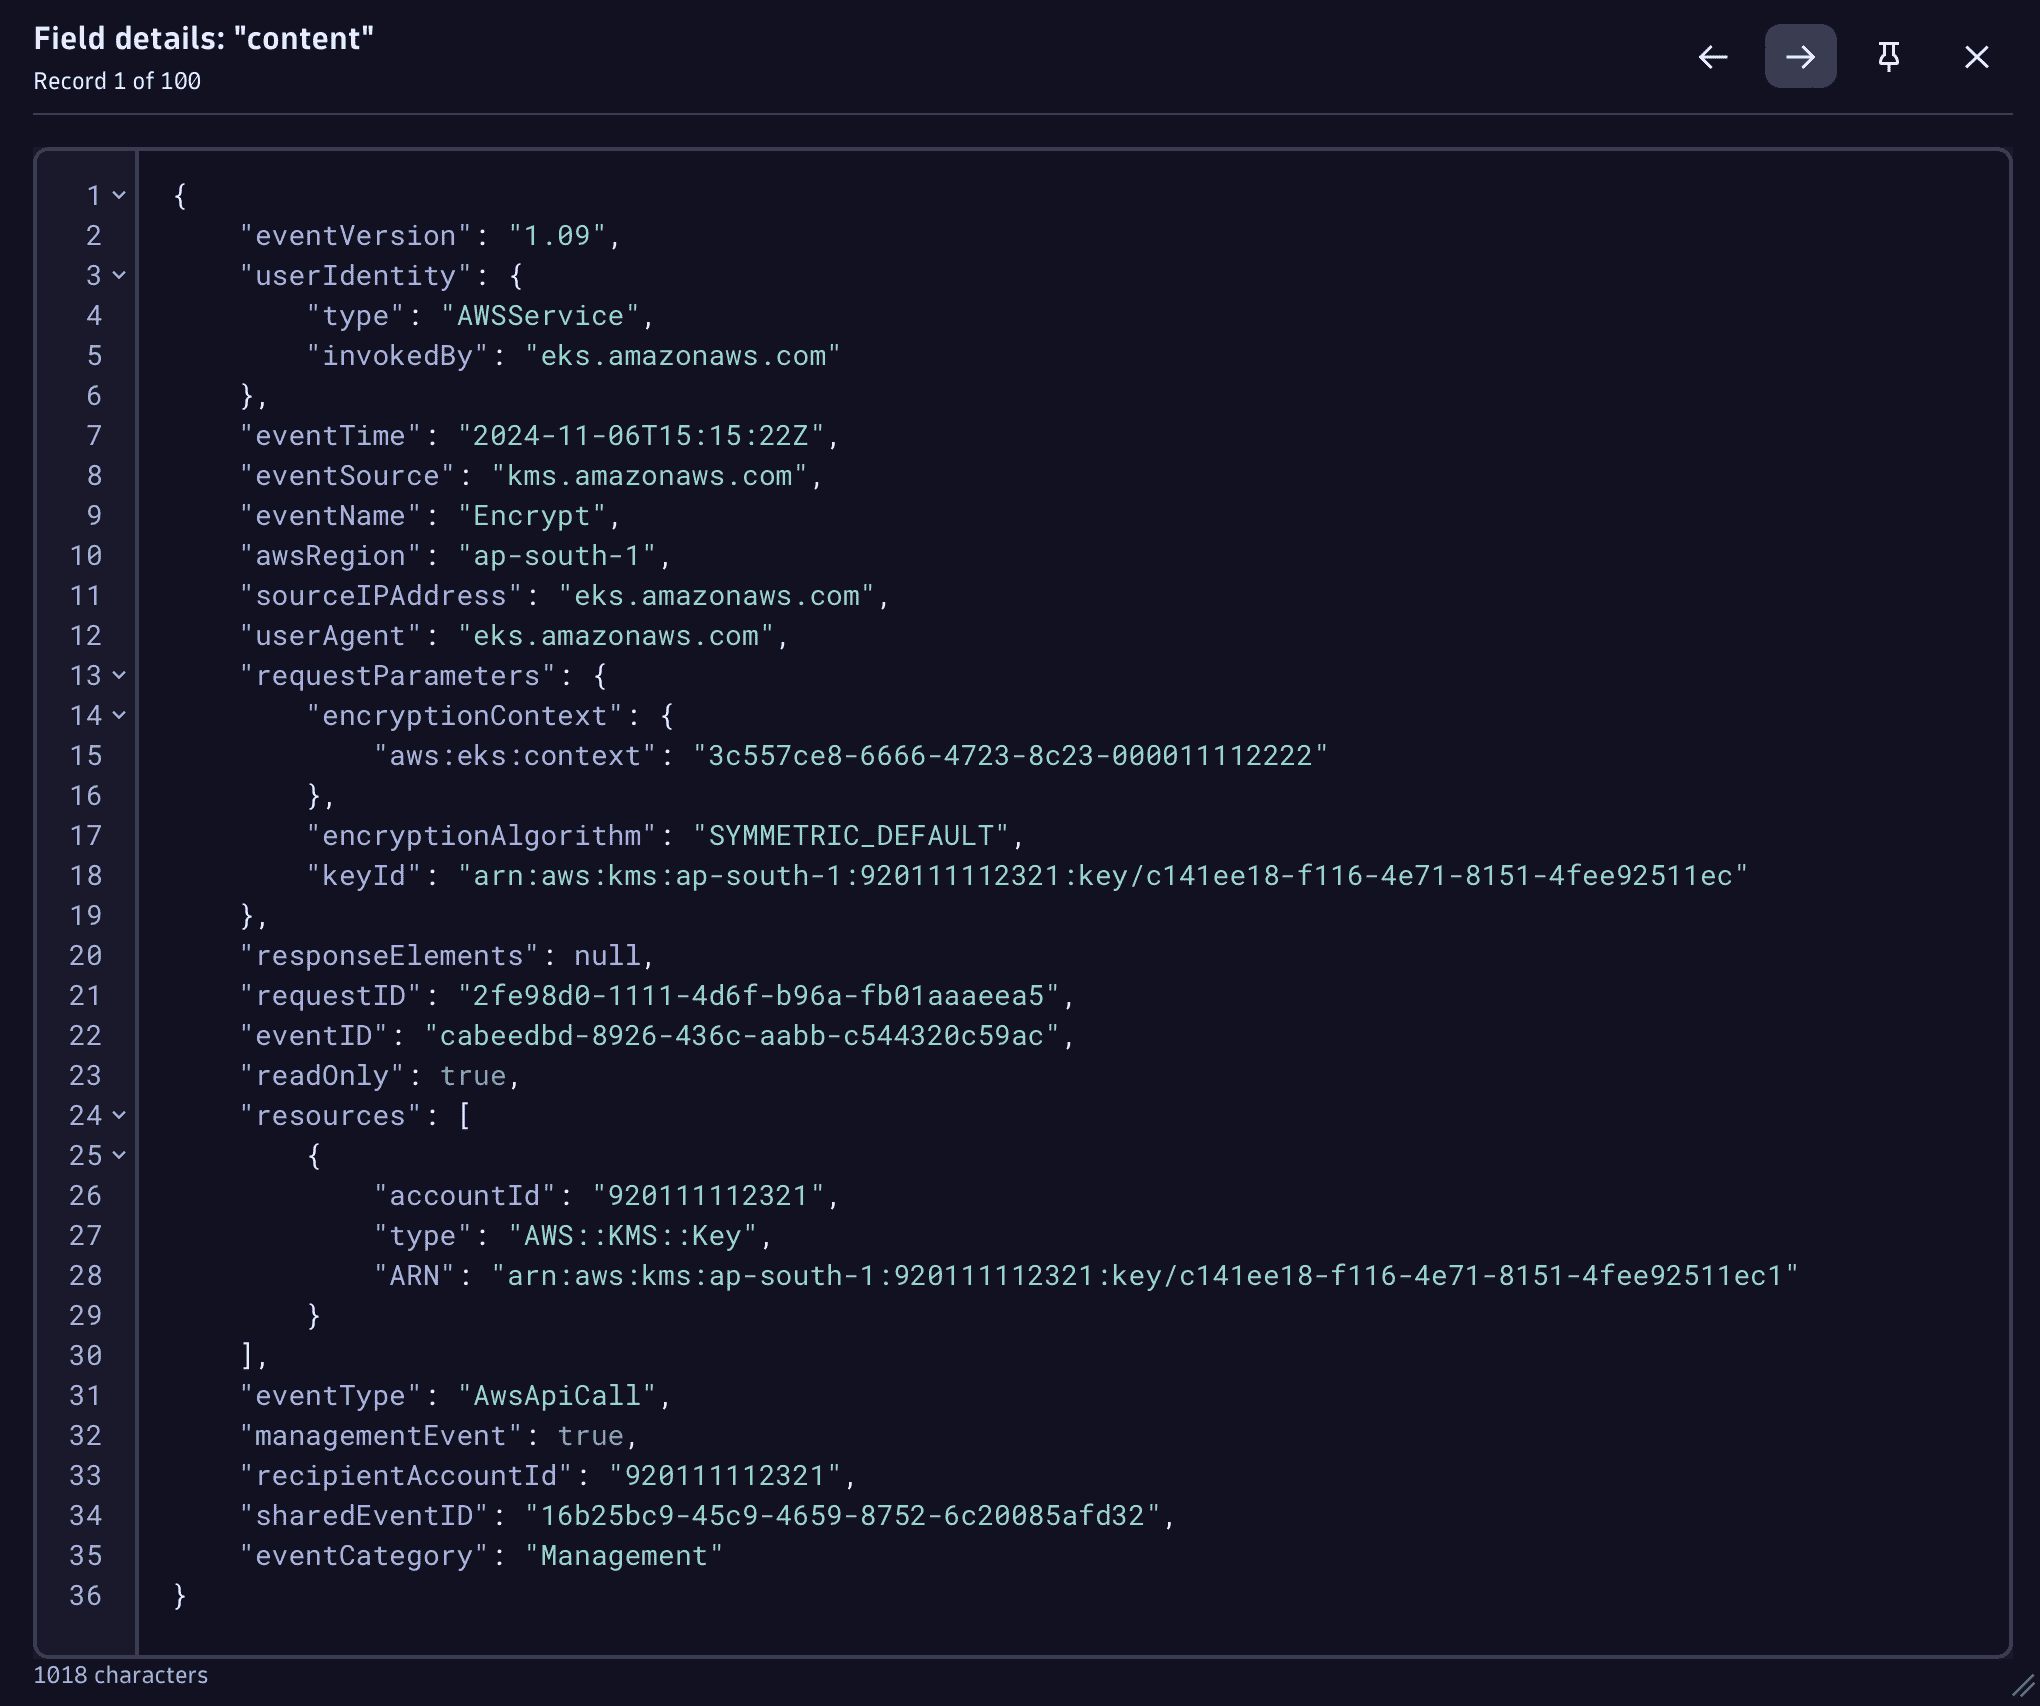
Right-click on an event and select View field details to see the JSON-formatted event in a structured way. This enables investigators to grasp the content of the event much faster.

-
Navigate between events in the results table via the keyboard arrow keys or the navigation buttons in the upper part of the View field details window.

 Prepare data for analysis
Follow the steps below to simplify log analysis, speed up investigations, and maintain the required precision for analytical tasks.
-
Add to your DQL query the parse command to extract the required data from the log records into separate fields.
-
Add the JSON matcher to extract the JSON-formatted log content as a JSON object into a separate field called
event.Your DQL query should look like this:
fetch logs, from: -30min| filter dt.system.bucket == "my_aws_bucket"| filter aws.service == "cloudtrail" -
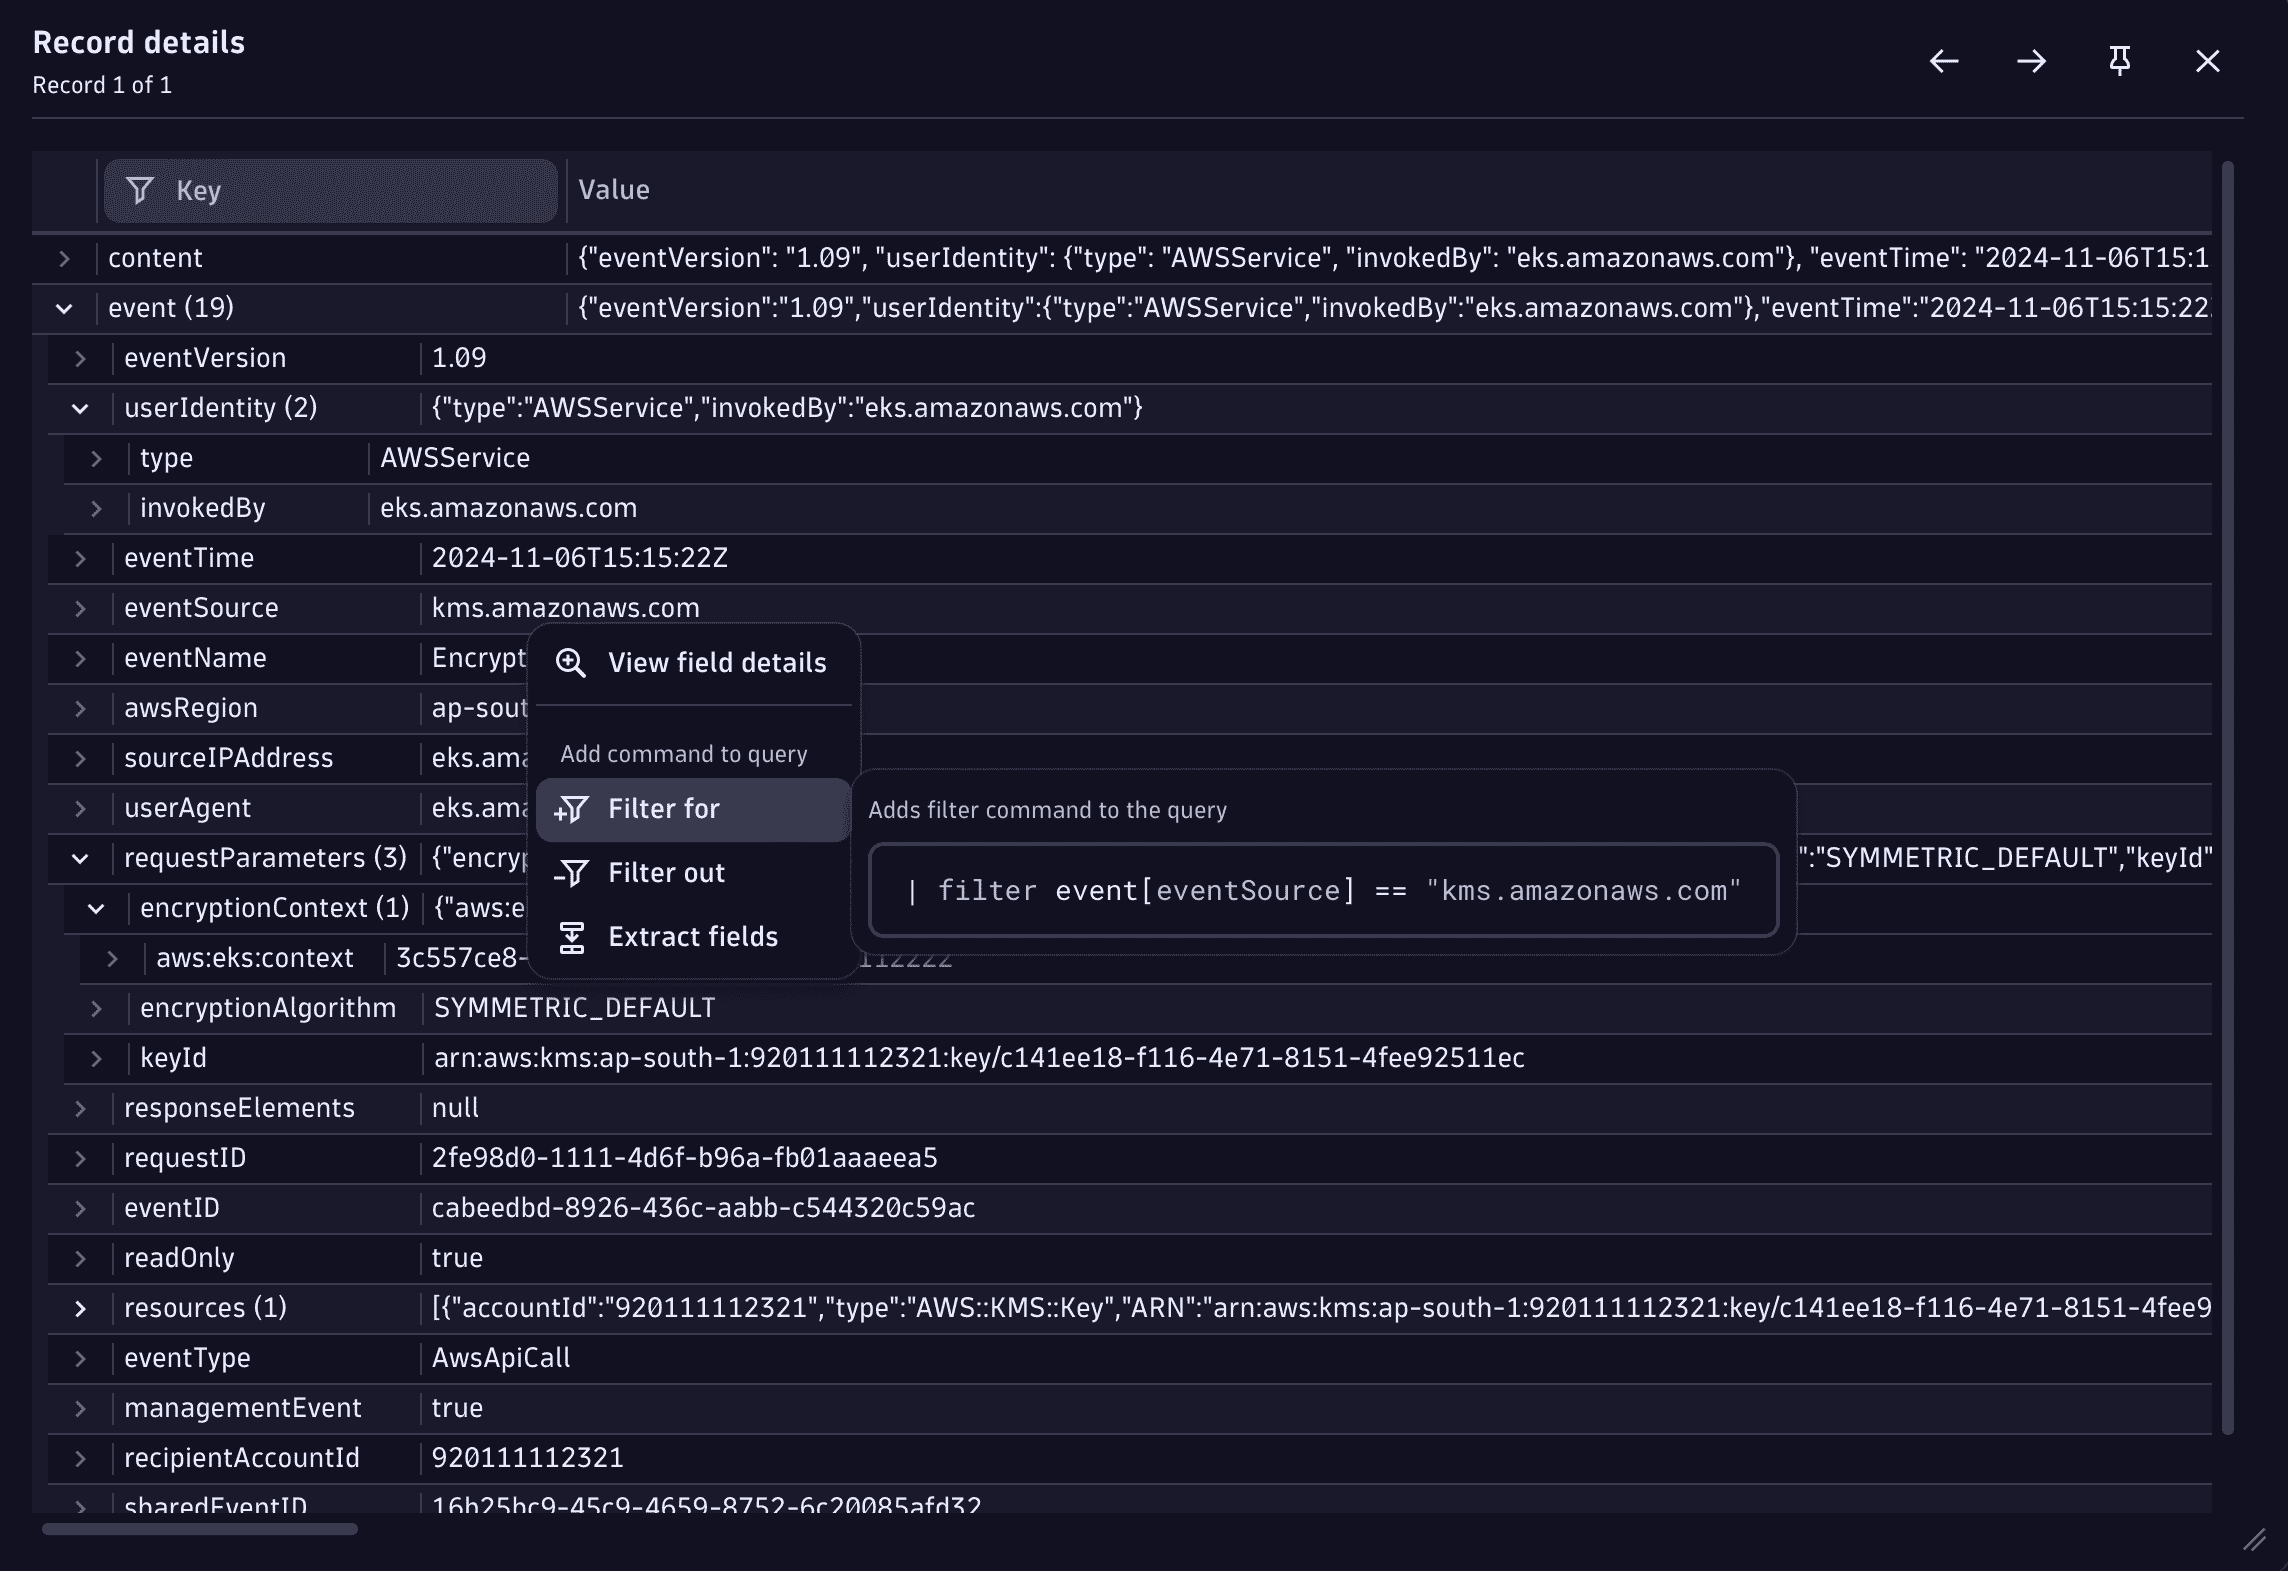
Double-click on any record in the results table to view the object in the Record details view. Expand the JSON elements to navigate through the object faster and add filters based on its content.

Get started
The following are use cases demonstrating how to build the above query to analyze AWS CloudTrail logs with Dynatrace.
Monitor sign-in failures to AWS console
Create metrics for unauthorized API calls
Monitor AWS API throttling
Detect externally generated keys in AWS KMS
Monitor sign-in failures to AWS console
Failures in authentication logs can be an indication for a potential attack towards your infrastructure. A malicious user could try to enumerate usernames or passwords to gain access to your AWS environment and take control of your business.
To monitor sign-in failures to the AWS console using CloudTrail logs
-
Add a filter statement to fetch only results with
signin.amazonaws.comas the event source andConsoleLoginas the event name. -
Add a filter command for the
responseElements.ConsoleLoginsub-element in the JSON object with the valueFailureto see only failed login attempts.You can use the DQL snippet below.
| filter event[eventSource] == "signin.amazonaws.com"and event[eventName] == "ConsoleLogin"and event[responseElements][ConsoleLogin] == "Failure" -
Add the
summarizecommand with your chosen fields to have an aggregated overview of the events.You can use the DQL snippet below.
| summarize event_count = count(), by: {source = event[sourceIPAddress],reason = event[errorMessage],region = event[awsRegion],userARN = event[userIdentity][arn],MFAUsed = event[additionalEventData][MFAUsed]}Your final DQL query should look like this:
fetch logs, from: -30min| filter dt.system.bucket == "my_aws_bucket"| filter aws.service == "cloudtrail"| parse content, "JSON:event"| filter event[eventSource] == "signin.amazonaws.com"and event[eventName] == "ConsoleLogin"and event[responseElements][ConsoleLogin] == "Failure"| summarize count(), by: {ipAddr = event[sourceIPAddress],reason = event[errorMessage],region = event[awsRegion],userARN = event[userIdentity][arn],MFAUsed = event[additionalEventData][MFAUsed]}
Create metrics for unauthorized API calls
Unauthorized API calls can indicate a hacking attempt or a system malfunction. These kinds of anomalies should be investigated to prevent unexpected costs or system takeovers by malicious users.
To identify the "top targets" from the API list
-
Create a filter to fetch only events, with an
AccessDeniedorUnauthorizedOperationerror code. -
Add the makeTimeseries command to convert your log results to metrics.
-
Add the
event[eventName]value from the logs as a metrics dimension. -
Sort the results to see only the top 10 APIs and limit the results to 10 records.
Your DQL query should look like this:
fetch logs, from: -30min| filter dt.system.bucket == "my_aws_bucket"| filter aws.service == "cloudtrail"| parse content, "json:event"| filter in(event[errorCode], { "AccessDenied", "UnauthorizedOperation" })| makeTimeseries event_count = count(), by: { eventName = event[eventName] }| sort arrayAvg(event_count) desc| limit 10For more granularity, you can add more dimensions to the
makeTimeseriescommand.For example, to see API call charts based on the user and the API endpoint, the summarization command would be as follows.
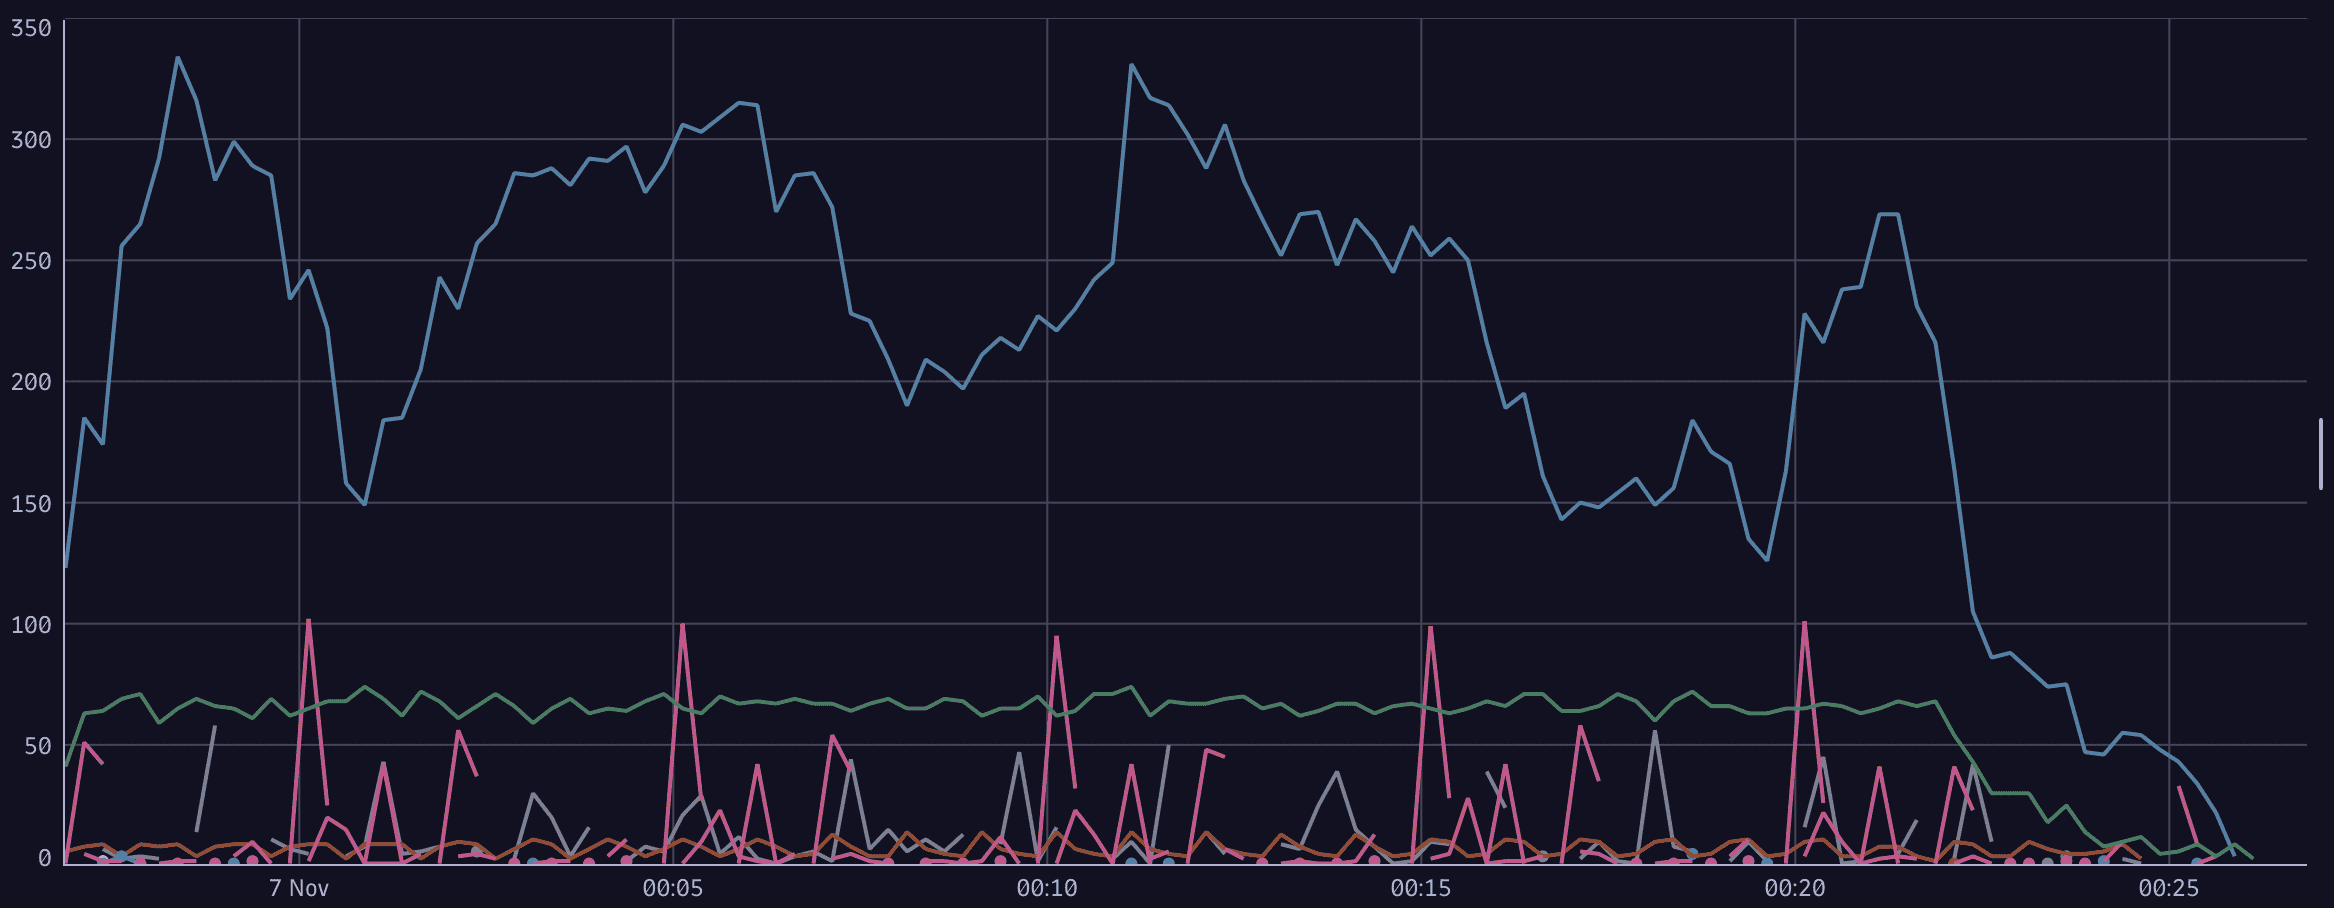
| makeTimeseries count(), by: {user = event[userIdentity][arn],eventName = event[eventName]}Example results visualized as a line chart:

Monitor AWS API throttling
Monitoring request counts towards APIs is important from the availability, cost, and security perspectives. A throttling API might indicate either a brute-force attack, a denial-of-service attack, or an ongoing data exfiltration by a malicious actor.
To monitor AWS API throttling from AWS CloudTrail logs in Dynatrace
-
Create a filter to fetch only events with an error code
Client.RequestLimitExceeded. -
Add the makeTimeseries command to convert your log results to metrics.
-
Add the
event[eventName]value from the logs as a metrics dimension.Your DQL query should look like this:
fetch logs, from: -30min| filter dt.system.bucket == "my_aws_bucket"| filter aws.service == "cloudtrail"| parse content, "json:event"| filter event[errorCode] == "Client.RequestLimitExceeded"| makeTimeseries count(), by: { eventName = event[eventName] }
Detect externally generated keys in AWS KMS
When creating a new key in AWS Key Management Service (KMS), you can choose the key material origin for the key: whether the keys are kept under AWS control or handled externally.
By default, key origin material is AWS_KMS, which means that KMS creates the key material.
When keys are handled externally, there’s an increased risk that the keys might leak, thus endangering the data which is protected with the key: the key could leak from elsewhere and its location could be unknown.
To detect such key creations, where external key material was used
-
Create a filter to fetch only events with the name
CreateKey. -
Add a statement to the filter to exclude all origins that begin with
AWS_.Currently there are two options (
AWS_KMSandEXTERNAL) so you could filter byExternalorigin, but having the filtering out could be be more future-proof.Your DQL query should look like this:
fetch logs, from: -30min| filter dt.system.bucket == "my_aws_bucket"| filter aws.service == "cloudtrail"| parse content, "json:event"| filter event[eventName] == "CreateKey"| filterOut startsWith(event[requestParameters][origin], "AWS_")| fields {eventName = event[eventName],origin = event[requestParameters][origin],keyUsage = event[responseElements][keyMetadata][keyUsage],region = event[awsRegion],userARN = event[userIdentity][arn],keyId = event[responseElements][keyMetadata][keyId]}
As a result, you get a table that contains the following information:
Summary
These are some of the use cases that can be solved using CloudTrail logs and Dynatrace Security Investigator. These logs are an endless source of information that enables Security and DevOps Engineers to conduct different investigations on their AWS infrastructure.