Measure an important code path with histograms in OpenPipeline
- Latest Dynatrace
- How-to guide
- 2-min read
Use OpenPipeline to measure important parts of your application code and analyze outliers. For example, you can capture response times for a specific method and visualize the resulting data as a histogram to identify unusually slow executions.
How-to
To measure an important code path with a sampling-aware histogram metric:
-
Go to
 Distributed Tracing and identify the method name that you want to measure.
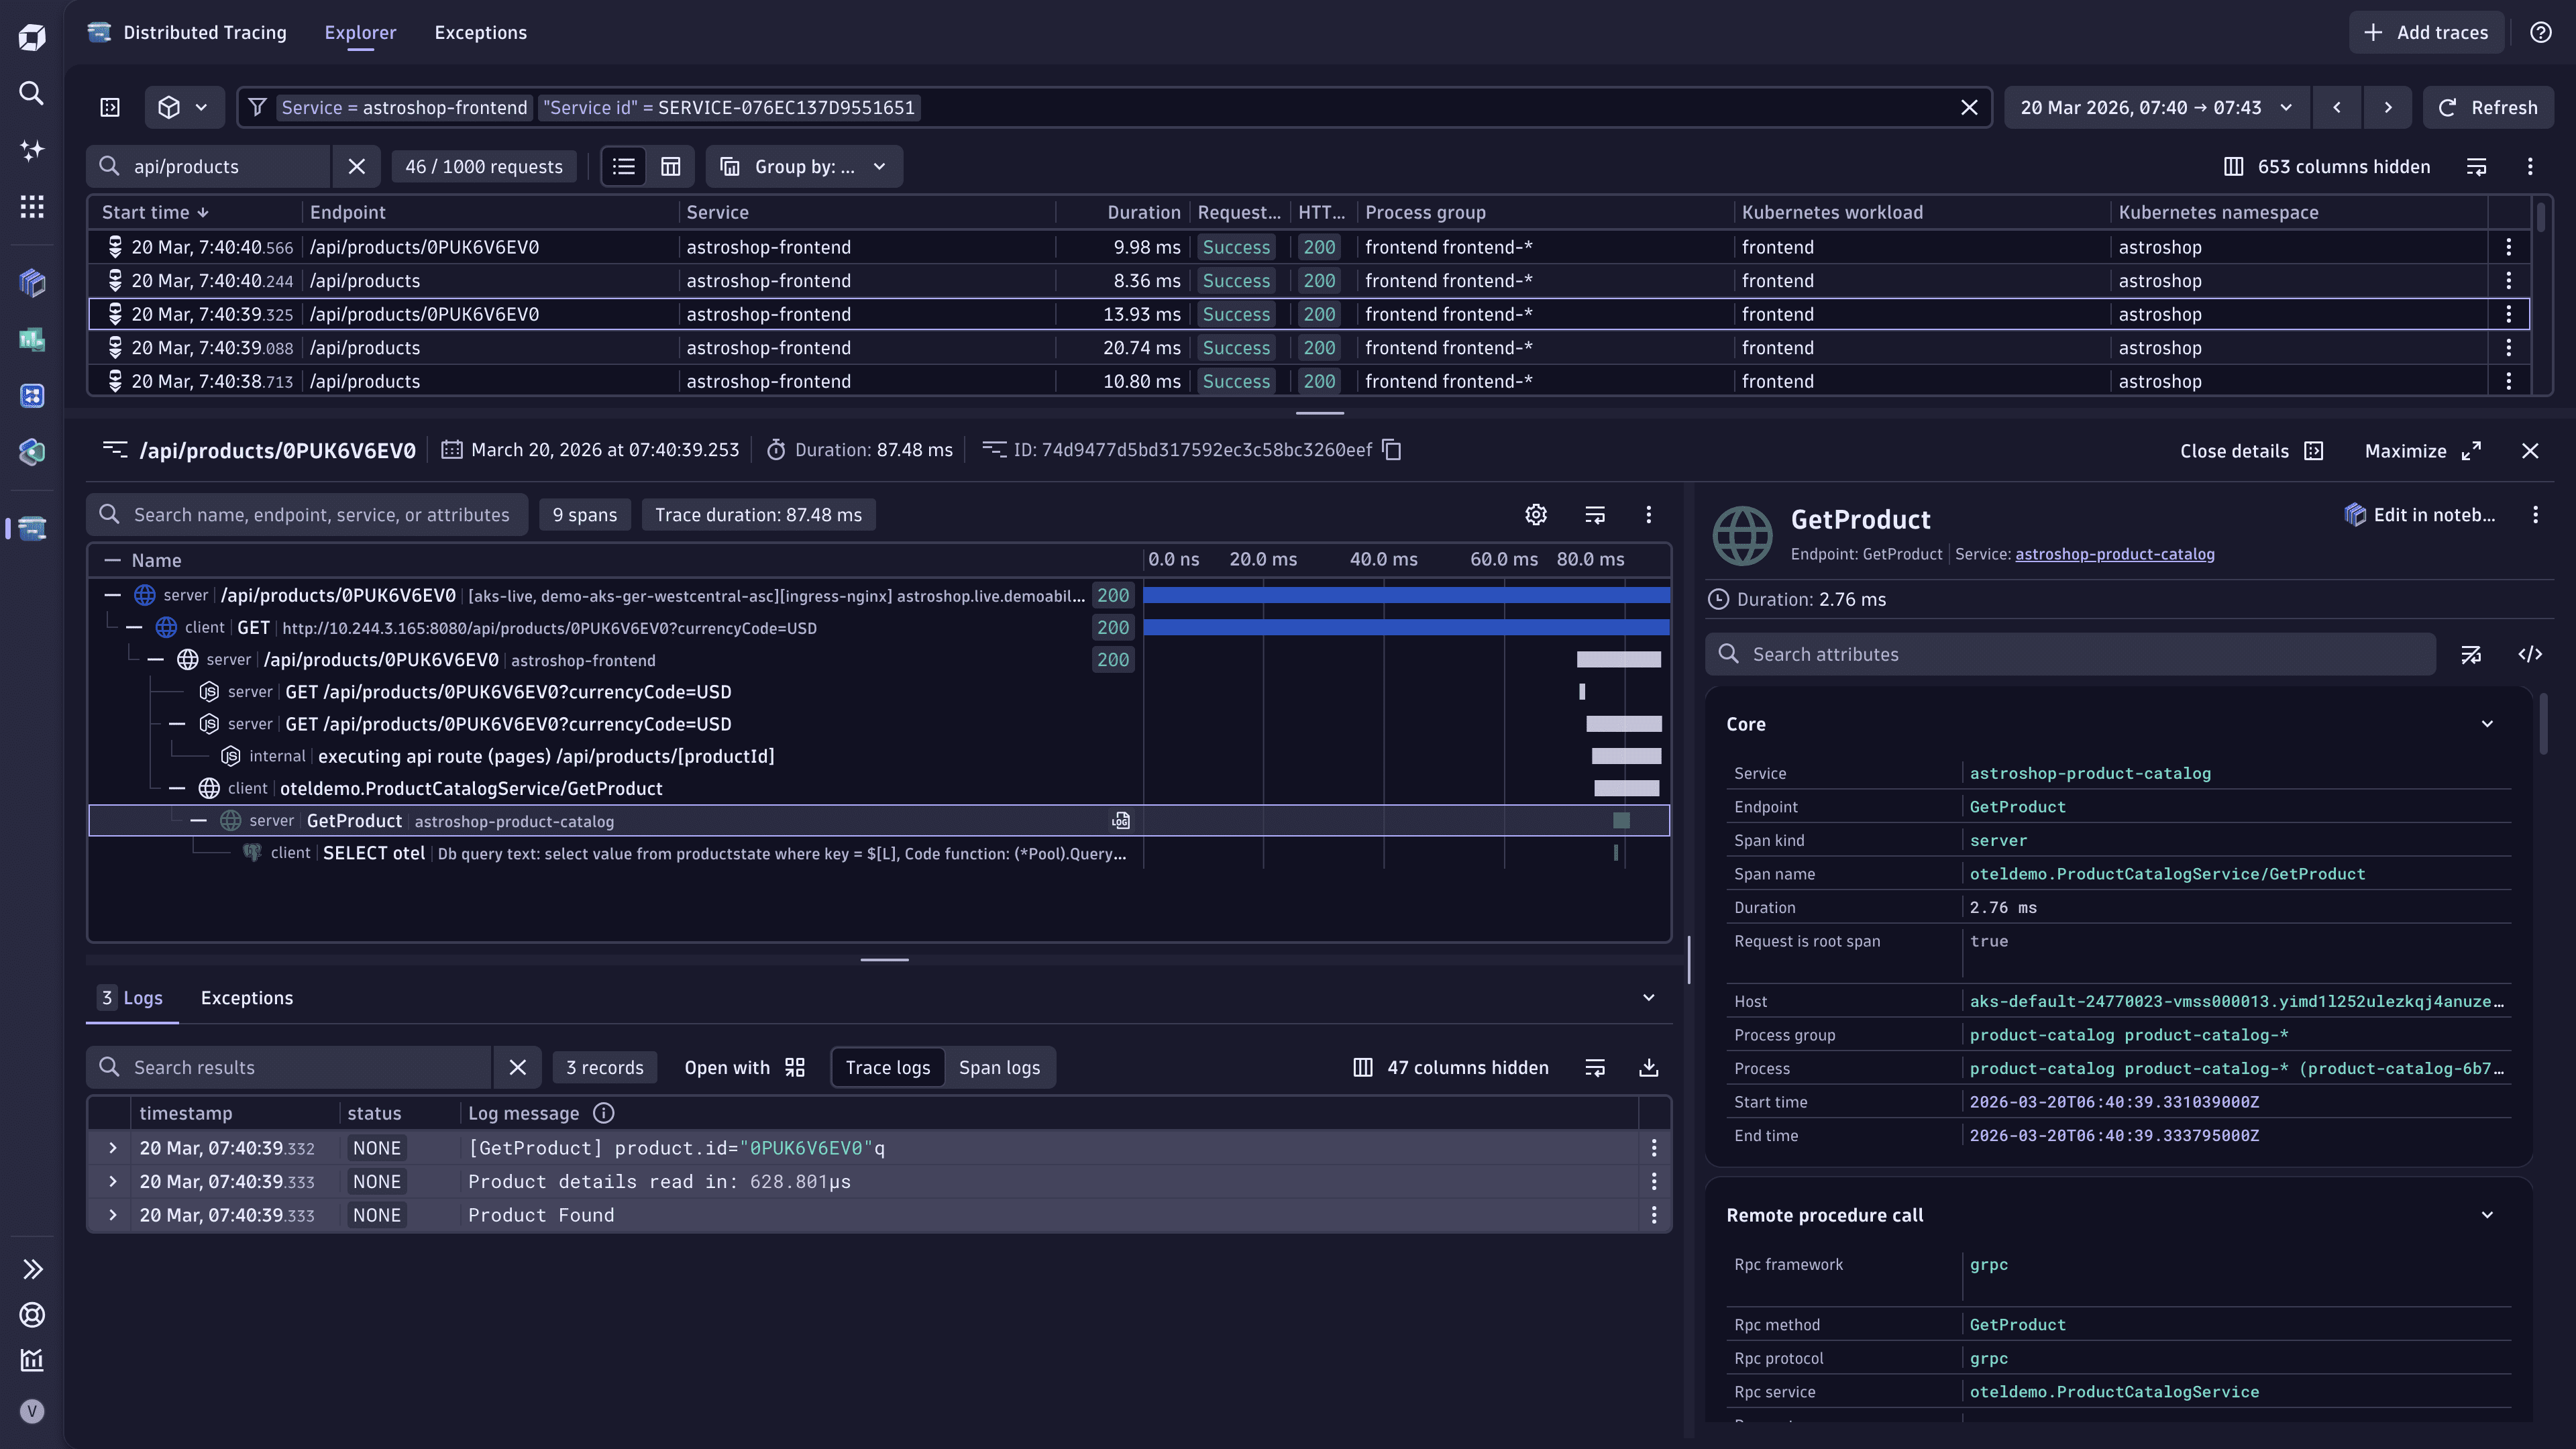 Identify important methods
 -
Go to
 Settings > Process and contextualize > OpenPipeline > Spans.
 -
Select Pipelines and choose the pipeline you want to use or create a new pipeline (:PlusIcon: Pipeline).
-
Select Metric extraction > Processor > Sampling Aware Histogram Metric.
-
Define the processor:
- Enter a metric name and metric key—for example,
my-span-histogram-metric. - In Matching condition, define the method that you want to measure, for example
span.name == "GetProduct".
- Enter a metric name and metric key—for example,
-
Select Save and close.
-
Make sure data is routed to the pipeline.
You created a new pipeline that extracts sampling aware histogram metrics from spans with the name GetProduct. You can now analyze data with your new metric.
- Go to
 Notebooks.
 - Choose an existing notebook or create a new one.
- Add a new Metrics section.
- Select Histogram and then choose the metric that you configured (
my-span-histogram-metric).