Root cause analysis concepts
- Latest Dynatrace
- Explanation
- 11-min read
As dynamic systems architectures increase in complexity and scale, IT teams face mounting pressure to quickly detect and react to business-critical incidents across their multi-cloud environments. Incidents might affect one or more IT components, ultimately leading to large-scale outages that take down critical business services and applications. Such services and applications (for example, accounting systems or web shops) consist of many different components that depend on each other to work reliably and to deliver excellent user experience. If a critical component fails, the ripple effect negatively influences many other dependent components, triggering a large-scale incident.
Concepts such as Service Level Objectives (SLOs) establish a framework of trust between individual components and shift responsibility toward the teams building and owning those components. While SLOs are great to gain a machine-processable understanding of what the normal boundaries of operation for individual services are, they fail to deliver a deeper understanding on the cause of the problem and the best remediation.
Root cause analysis aims to fill this gap by using all available context information to evaluate an incident and determine its precise root cause. It is equally important to evaluate the impact of an incident, allowing the operations team to quickly triage the incident and reduce the mean time to repair (MTTR).
This page introduces the following core concepts:
Incidents and problems
Davis events
Root cause analysis
Fault tree analysis
Impact analysis
Problem lifecycle
Problem timing
Duplicate problems
Incidents and problems
An incident is an abnormality in your environment—in an application, infrastructure, and so on. A problem is an entity that represents the incident in Dynatrace. A problem is the result of automatic Dynatrace Intelligence root cause and impact analysis of an incident. Problems (just like underlying incidents) can span across multiple dependent components, sharing the same impact and root cause.
A problem might result from single or multiple Davis events occurring simultaneously within the same topology, which is often the case in complex environments. To prevent over-alerting, Dynatrace correlates all Davis events with the same root cause into a single problem.
All detected problems are listed in the problem feed and Dynatrace automatically updates them in real time with all incoming Davis events and findings.
Davis events
Events represent different types of singular anomalies, such as a metric breaching a threshold, baseline degradations, or point-in-time Davis events, such as process crashes. Dynatrace also detects and processes informational Davis events such as new software deployments, configuration changes, and other Davis event types.
Dynatrace ingests and stores Davis events from multiple sources. Those events can trigger root cause analysis, an automation, or serve as raw data for dashboards and reports. Together with logs, metrics, and traces, Davis events provide the input for root cause and impact analysis.
Most Davis events don't indicate abnormal or unhealthy states, therefore only a small fraction of Davis events are considered within problems.
Root cause analysis
Root cause analysis uses all the available context information—such as topology, transaction, and code-level information—to identify Davis events that share the same root cause and impact.
To identify the root cause of problems, time correlation alone is not sufficient. Dynatrace follows a context-aware approach, detecting interdependent Davis events across time, processes, hosts, services, applications, and both vertical and horizontal topological monitoring perspectives. This approach combines multiple standalone anomalies into a single consistent problem, dramatically reducing the alert load.
The image below illustrates how Dynatrace Intelligence analyzes all horizontal and vertical dependencies of a problem. In this example, the application shows abnormal behavior, while the underlying vertical stack operates normally. The analysis follows the transactions of the application, detecting dependency on a service (Service 1) that also shows abnormal behavior. In turn, all of the service's dependencies behave abnormally as well and are part of the same problem.
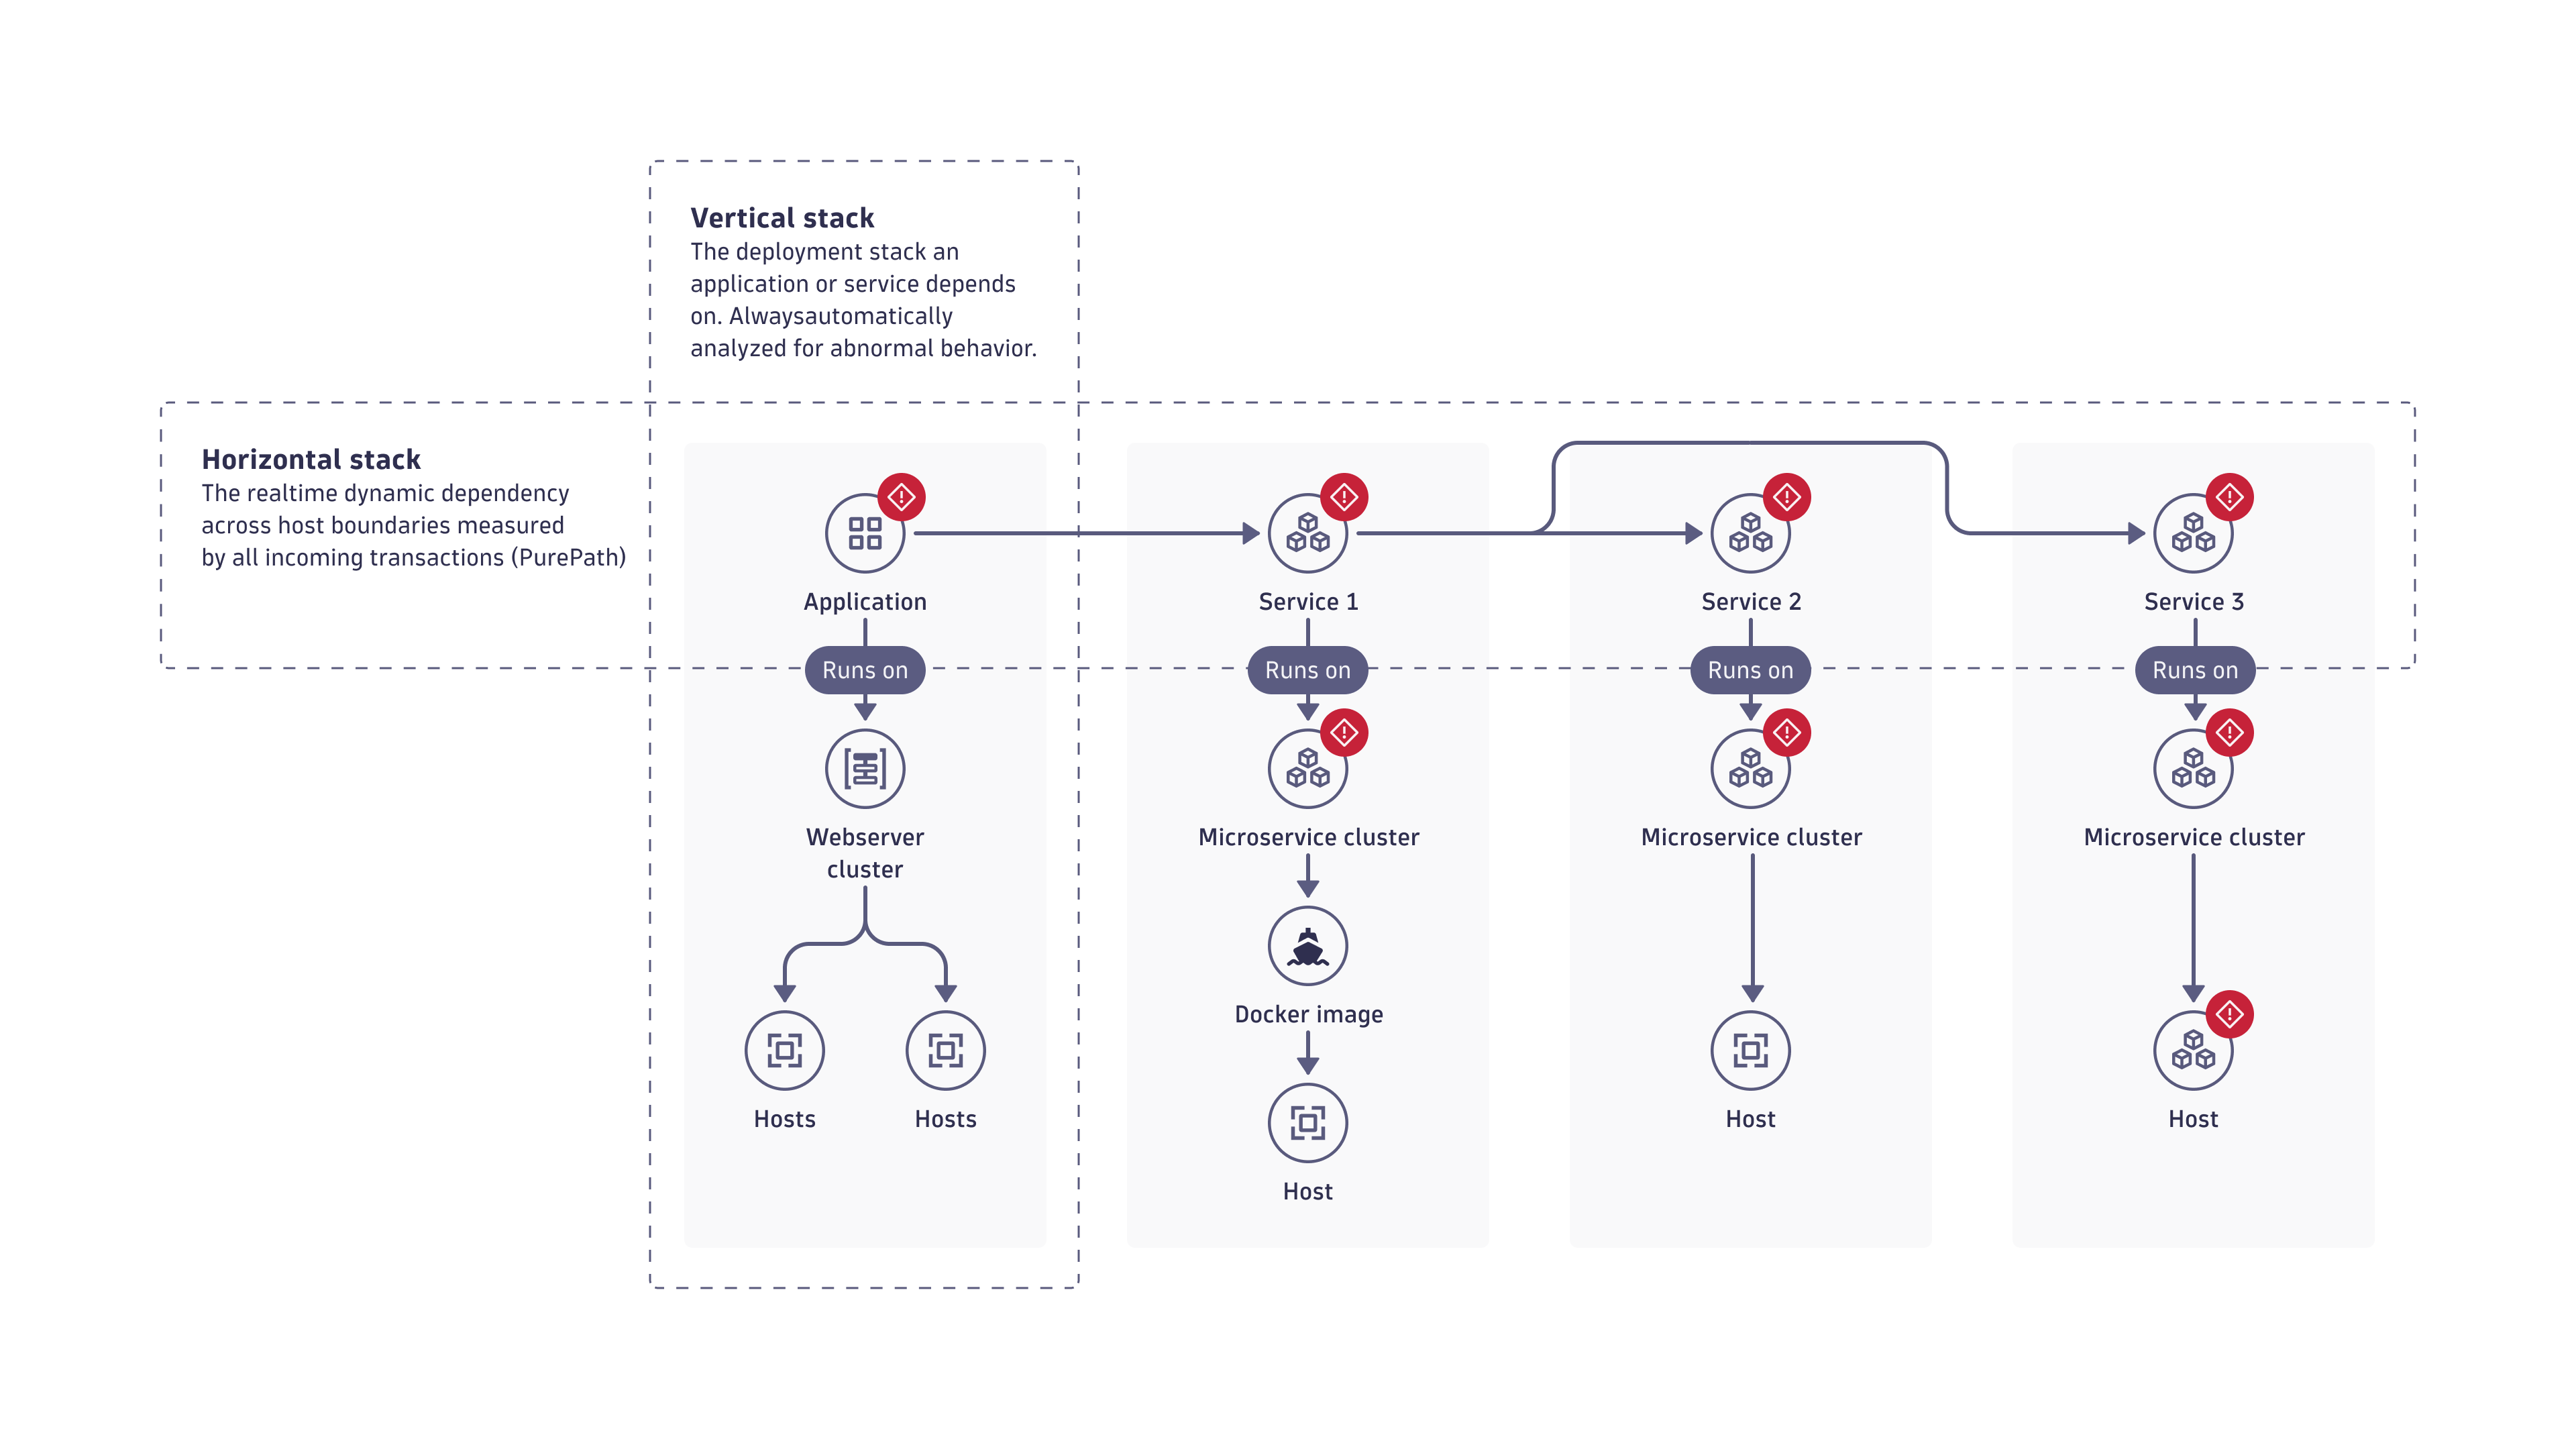
Dynatrace Intelligence includes all relevant abnormalities and ranks all root cause contributors, determining which is the primary negative impact. You can drill down to the component level and analyze the root cause down to the source code level. For example, Dynatrace can show failing methods within your service code or high GC activity on underlying Java processes.
Why is context correlation important?
A problem is rarely a one-time Davis event. Often they appear in regular patterns and are symptoms of larger issues within your environment. If multiple entities depending on an affected component experience issues around the same time, all those entities are included into root cause analysis.
Time correlation alone is, however, is not enough to identify the root cause of many application and service problems. Consider, for example, a simple time correlation in which the Booking service calls the Verification service, and the Verification service experiences a slowdown. The first Davis event in the problem evolution is a slowdown of the Verification service. Subsequently, the Booking service experiences a slowdown too, caused by dependency on the Verification service. In this case, time correlation works well in detecting the root cause of the problem: a slowdown of the Verification service. However, this is an oversimplified description of what happens in real applications.
What if the Davis events in the problem evolution sequence are more nuanced and open to interpretation? What if, for example, the Booking service has a long history of performance problems? Without the complete context, it becomes impossible to decisively conclude that the slowdown of the Booking service is caused by the slowdown of the Verfication service. There is a possibility that Booking service is experiencing another performance issue, unrelated to the Verfication service.
Dynatrace Intelligence root cause analysis uses all related monitoring data to identify interdependencies between the problem and other components that took place around the same time and within a dependent topology. That is, all topological dependencies, vertical and horizontal, are part of the analysis.
Fault tree analysis
Dynatrace Intelligence context model is built on known dependency information from Smartscape, OneAgent, and cloud integration. Dynatrace Intelligence uses this information to quickly conduct a fault tree analysis to analyze millions of dependencies and arrive at the most probable root cause of a problem.
Impact analysis
The impact of a problem is equally as important as its root cause, since both represent essential information for triaging and remediating the underlying incident—the problems that threaten your company's business most have higher priority to resolve.
Impact analysis identifies which applications' entry-point services are affected by an incident and the size of the overall "blast radius" in terms of the total number of affected entities. Impact analysis also delivers the number of affected SLOs as well as the number of potentially affected real users.
Ultimately, impact analysis strives to determine how badly the incident affects your business.
Problem lifecycle
Dynatrace opens a problem upon receiving the first indicator of an incident, which is typically a single Davis event representing abnormal behavior, such as a service slowdown, node saturation, or a workload crash and restart.
A problem automatically follows a lifecycle and remains in the active state while there is still an affected entity in the unhealthy or abnormal state, mostly indicated by an active Davis event.
In the following scenario, a problem that has a performance incident in the infrastructure layer is the root cause.
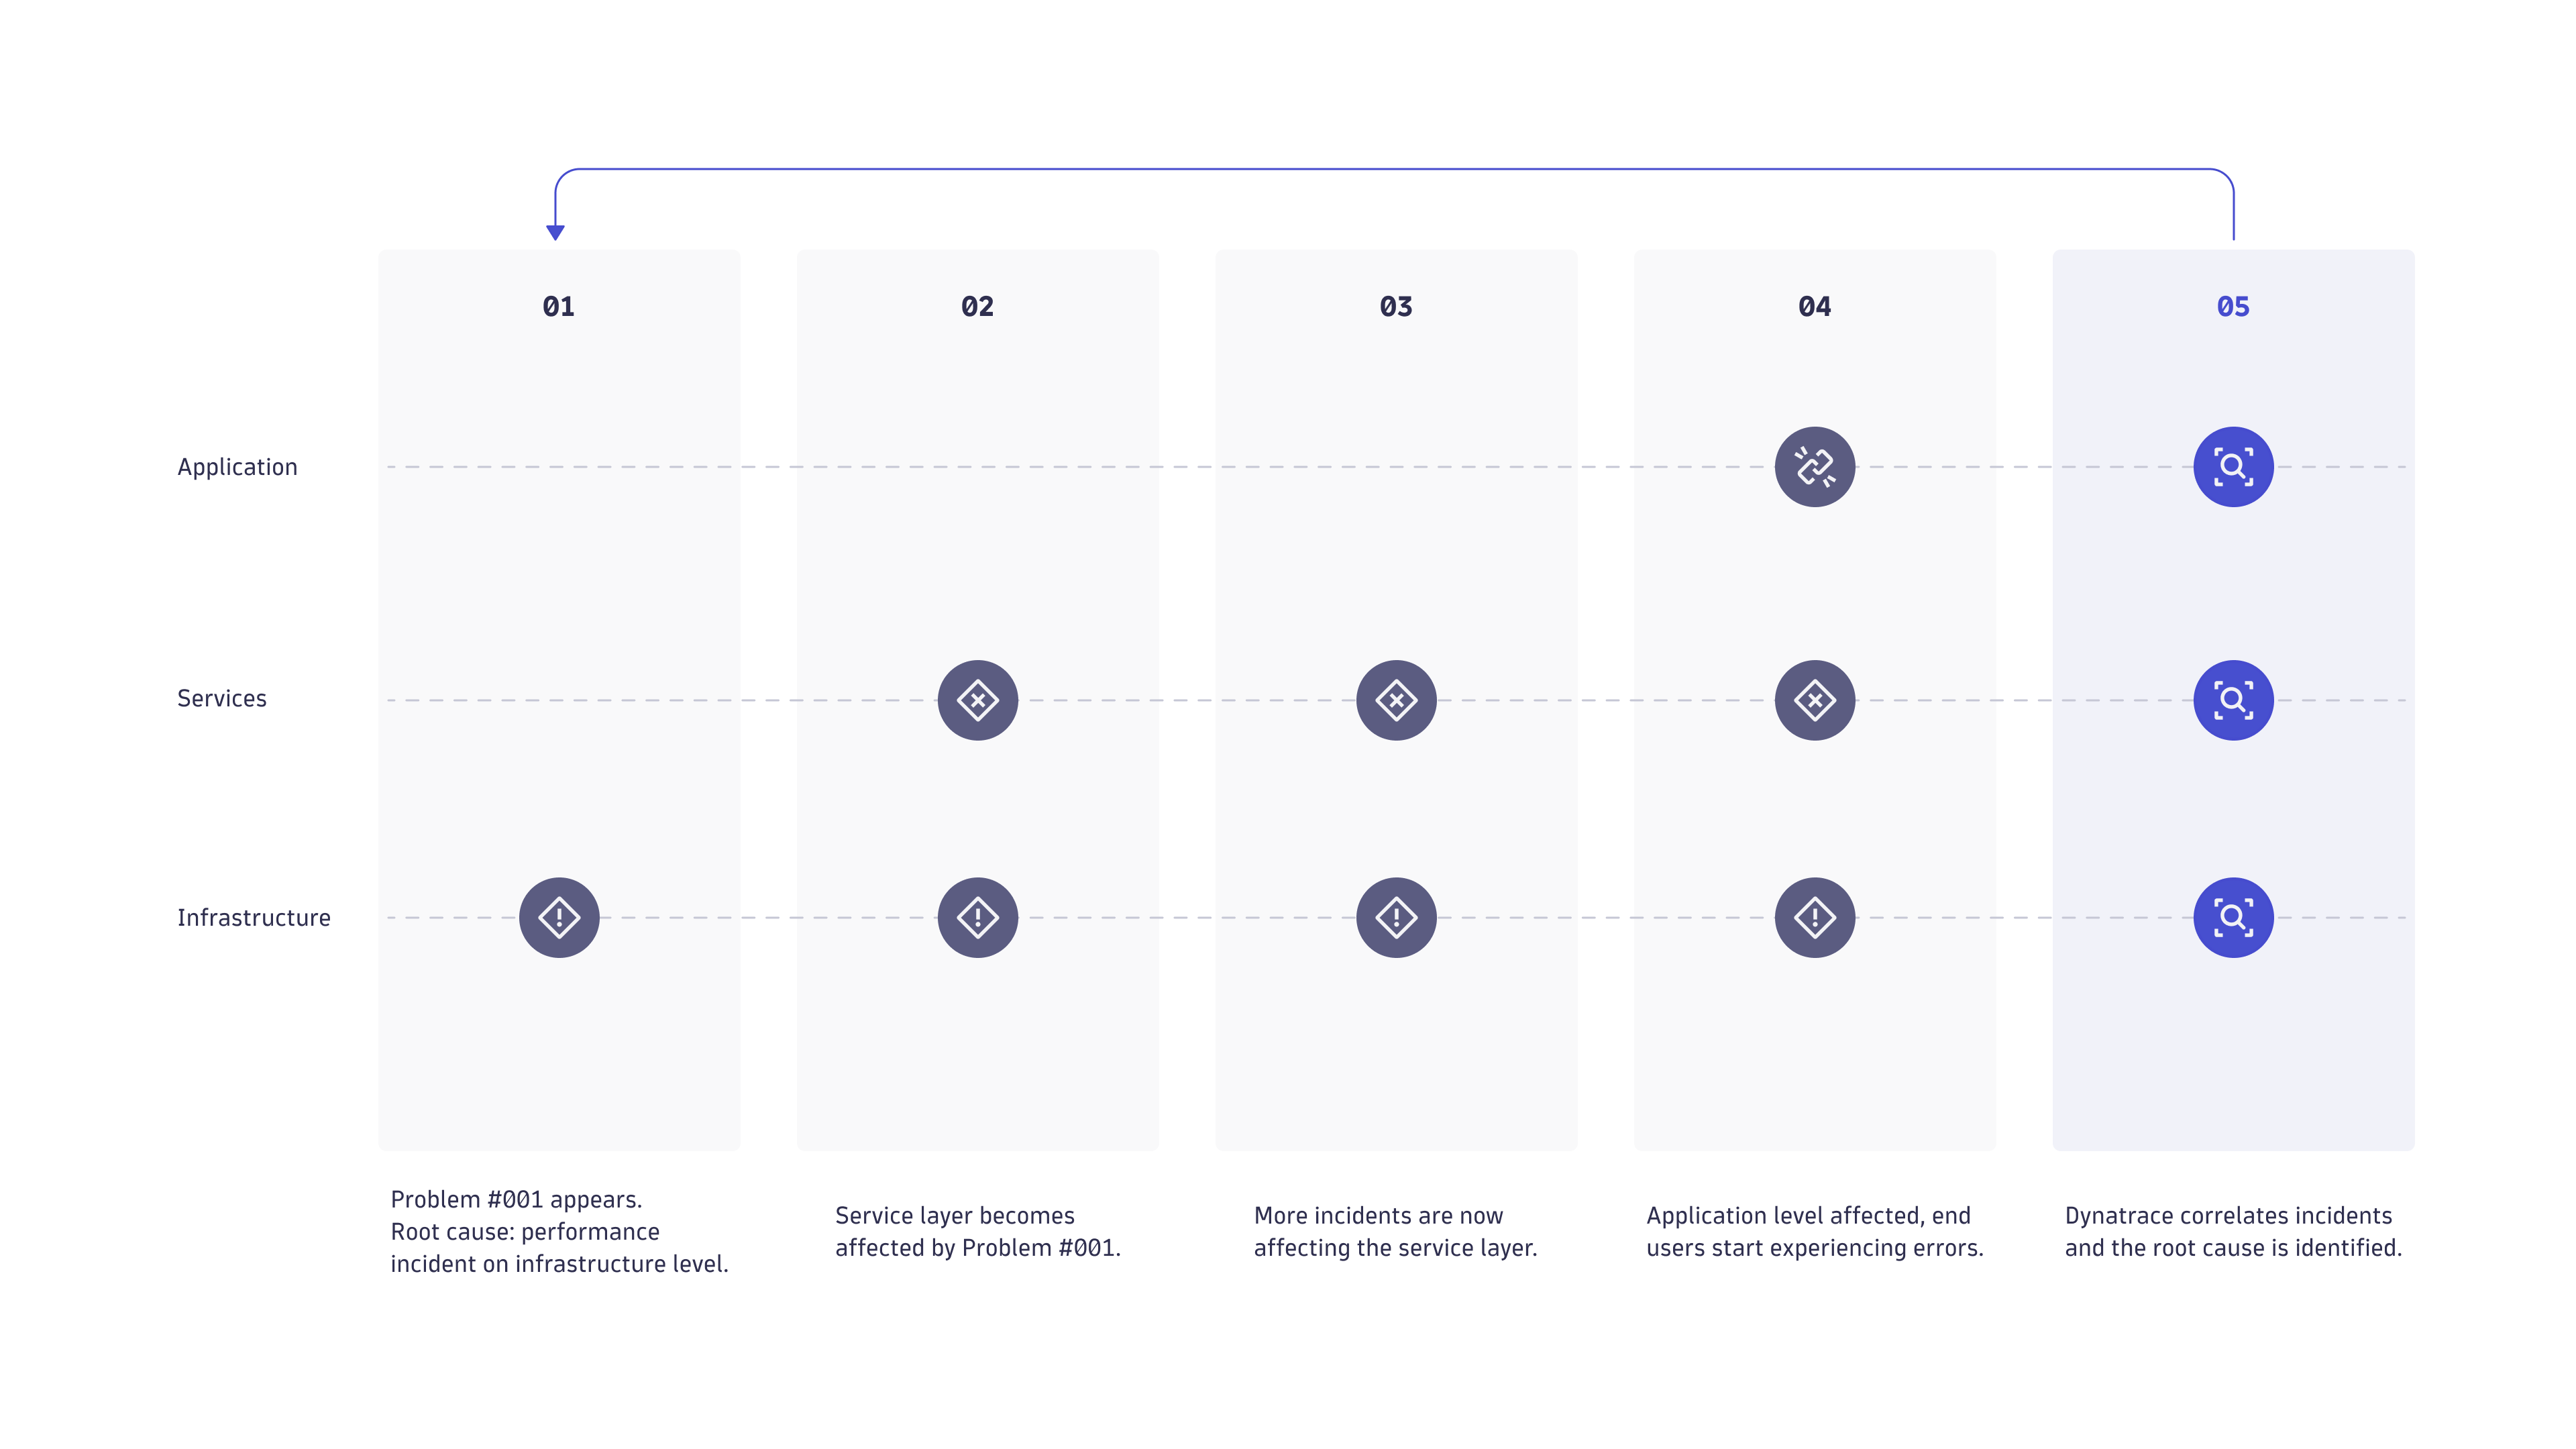
- Dynatrace detects an infrastructure-level performance incident and creates a new problem for tracking purposes. A notification is sent out as well.
- After a few minutes, the infrastructure problem leads to the appearance of a performance degradation problem in one of the application's services.
- Additional service-level performance degradation problems begin to appear. What began as an isolated infrastructure-only problem has grown into a series of service-level problems that each have their root cause in the original incident in the infrastructure layer.
- Eventually, the service-level problems begin to affect the user experience of customers who are interacting with the application via desktop or mobile browsers. At this point in the problem life span, you have an application problem with one root cause in the infrastructure layer and additional root causes in the service layer.
- Because Dynatrace understands all the dependencies in your environment, it correlates the performance degradation problem your customers are experiencing with the original performance problem in the infrastructure layer, facilitating quick problem resolution.
Problem timing
The Dynatrace Intelligence root-cause engine collects all Davis events that belong to the same incident. As a result, Dynatrace Intelligence causal AI generates a problem that references all incident-relevant information such as individual Davis events that were detected on the impacted topology graph.
The following shows how two individual Davis events are analyzed within one problem generated by Dynatrace Intelligence causal AI.
- Each Davis event comes with its own start and end timestamps.
- Each Davis event producer uses various observation sliding time windows, which we call event analysis time (shown in yellow).
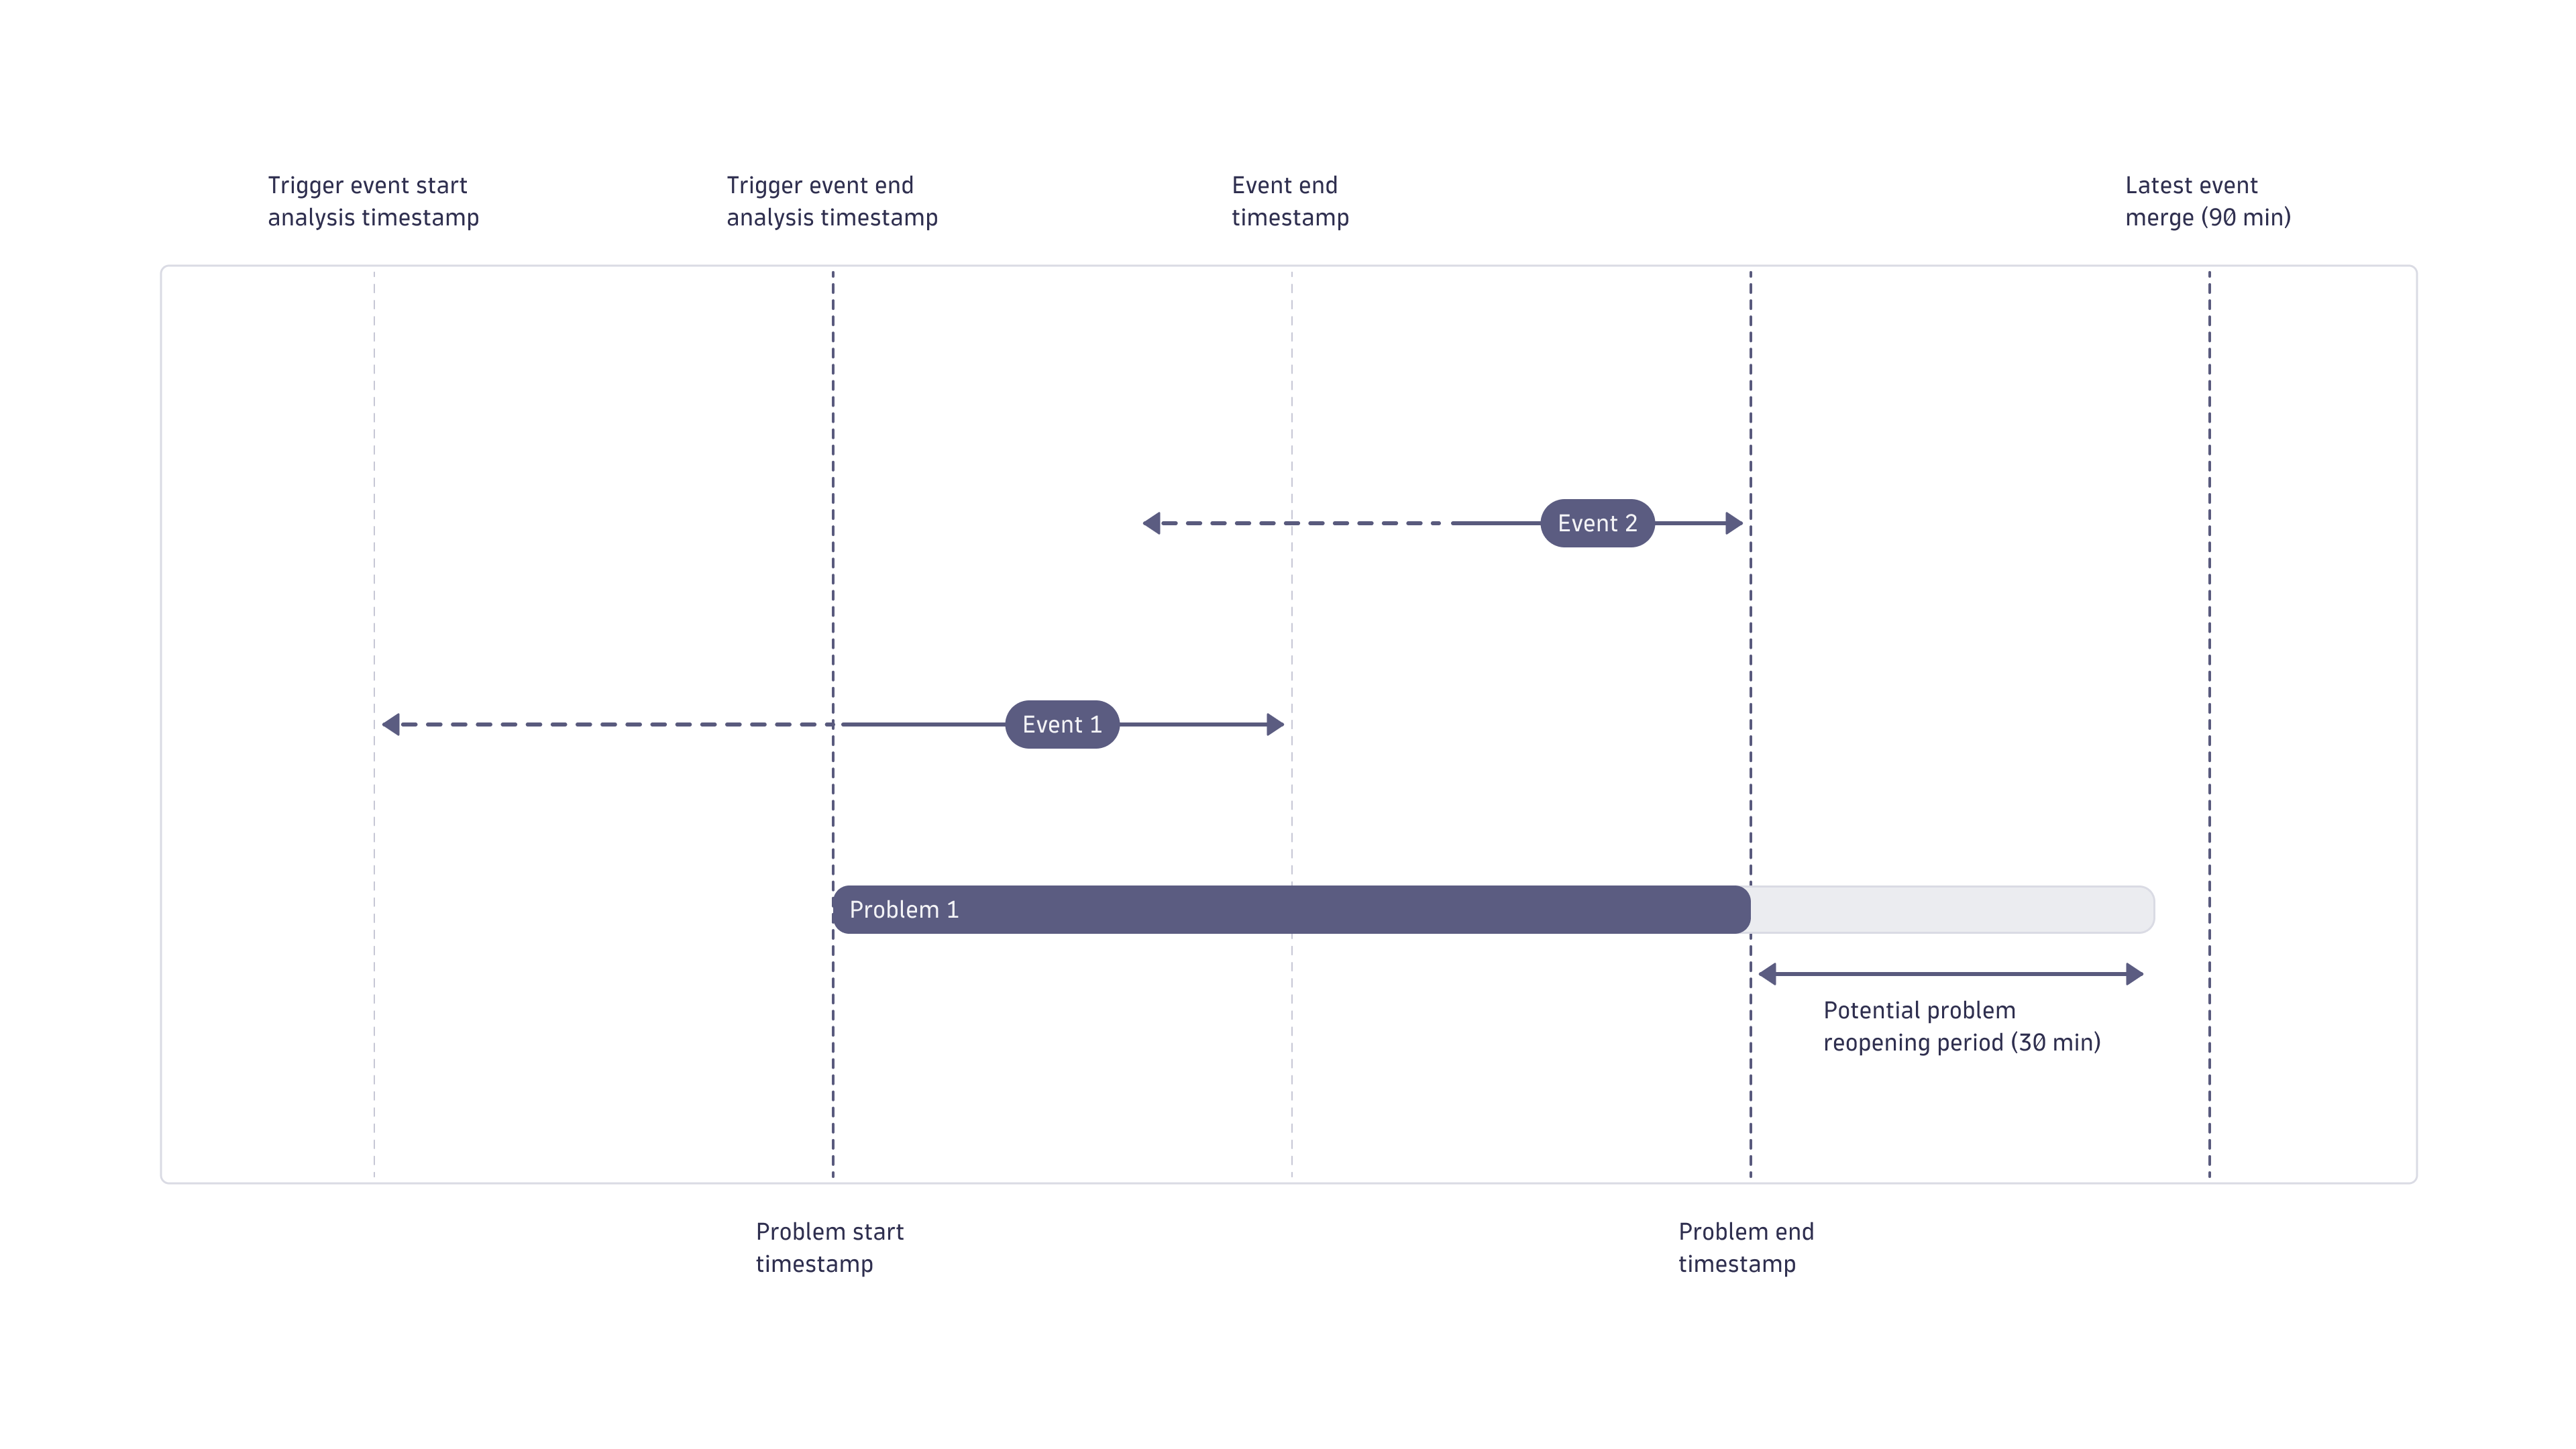
Consider an example of a metric Davis event configured to use a five-minute sliding window where three one-minute samples need to violate the threshold to raise a Davis event. In that case, the metric starts violating the threshold three minutes before the timestamp when the event is raised.
- The event start analysis timestamp is the earliest point in time when the violating state was observed.
- The event end analysis timestamp is the point in time after all necessary violation samples are collected and a problem is opened.
- Because each Davis event involved in the problem uses a sliding window, each problem has a trailing period during which a closed problem might be reopened. This is called the reopening period, and its maximum length is 30 minutes.
- If a problem remains open for longer than 90 minutes, no new events are merged into it after the 90-minute point. This prevents Dynatrace Intelligence causal AI from collecting unrelated information for long-lasting incidents (for example, a synthetic test constantly failing and keeping problems open for weeks).
Summary of the problem lifecycle timings:
- Individual Davis events use variable analysis sliding windows.
- A problem is raised at the event end analysis timestamp.
- A problem lifespan is defined by the lifespans of individual Davis events in the problem.
- A problem is closed when all Davis events in the problem are closed.
- A closed problem can be reopened during a reopening period of 30 minutes.
- If a problem lasts for longer than 90 minutes, no new Davis events will be merged after the 90-minute point—a new problem will be raised instead.
- If the time gap between creation (start timestamp) of the first Davis events is longer than 5 minutes, the Davis events won't be merged into the same problem. Instead, they will be identified as two different problems.
Duplicate problems
The detection and analysis of a large-scale incident always requires a balance between fast alerting and having a complete picture of the situation. Data collection is asynchronous by nature due to different observation windows, different synthetic check schedules, and different latencies of information originating from various data sources.
The asynchronous processing of incoming information leads to situations where root-cause detection identifies two problems that share the same root cause.
- At the time of detection, the root cause analysis might lack the necessary information to connect both problems into a single incident.
- After the delayed information is considered, and one main problem is identified, other identical problems are marked as duplicates (
dt.davis.is_duplicate=true).
Duplicates could be avoided entirely by waiting for a longer period (for example, 30 minutes) to receive all possible information, but this would delay alerts to the operation teams.
Due to the criticality of real-time alerting, potentially incomplete information and problem duplicates are accepted to allow the fastest possible alerting.
Problem processing state
After Dynatrace Intelligence causal AI detects a problem, it enters the Processing state. This means that the causal AI analyzes the Davis event to see if it needs to be merged into a more significant problem. The Processing state aims to avoid duplicate issues and false alarms, so no alerts are sent until the state changes. Analysis and information gathering necessary for causal AI to make a decision usually take up to 3 minutes.
Below, you can find the example of a problem in the Processing state.
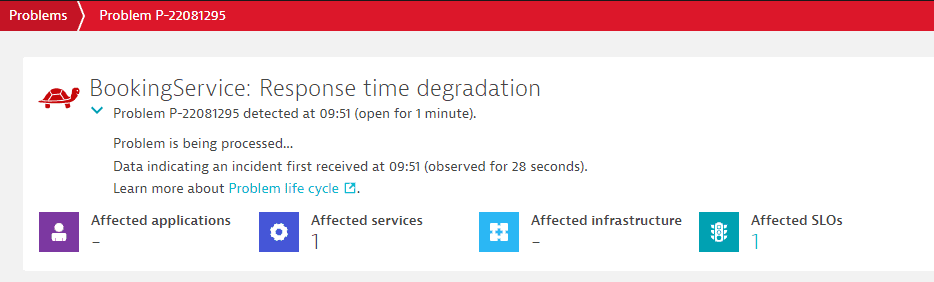
If you want to receive alerts immediately after the problem is detected, you can use Custom alert with Metric events. In this case, the Davis event flags dt.davis.trigger_delay and dt.davis.analysis_time will be set to 0. The problem won't enter the Processing state, and no causal AI analysis will be performed.
Alternatively, you can set the processing state per Davis event source in Log events configuration.