Slowdown events
This page provides information about supported slowdown events and the logic behind raising them.
![]()
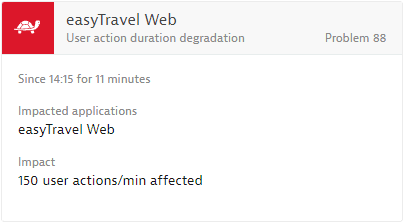
User action duration degradation
USER_ACTION_DURATION_DEGRADATION
User action duration degradation events are detected in multiple ways within Dynatrace. By default, Dynatrace uses automated baselining to detect degradation events of either the 50th percentile (Median) or the 90th percentile of an application’s user action performance.
On the application level, the baseline distinguishes between three main categories of user action:
- load actions
- XHR actions
- custom user actions
If the performance of one of these categories degrades, the event is raised with a reference to one of these categories.
Dynatrace automatically collects multidimensional baselines for user actions, where the dimensions are user action, geographic region, operating system, and browser type. If a slowdown is detected within a specific combination of these user action dimensions, for example, payment, Browser: Firefox, the resulting event will contain a reference to the violating dimensions.
A typical example of a user action duration degradation event is shown below.
Affected entity types
The following entity types may be affected by slowdown events:
- Services
- Mobile apps
- Web applications
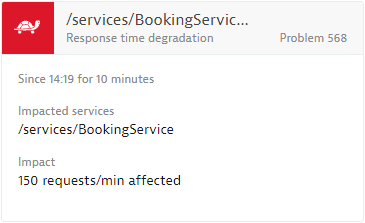
Response time degradation
SERVICE_RESPONSE_TIME_DEGRADED
Response time degradation events are detected in multiple ways within Dynatrace. By default, Dynatrace uses automated baselining to detect degradation events of either the 50th percentile (Median) or the 90th percentile of the service and service method response time. Navigate to Settings > Anomaly detection > Services to find automated baselining settings. Alternatively, you can use a static threshold instead of dynamic baselining. Static thresholds are compared to the monitored 50th and 90th percentiles.
A typical example of a response time degradation event is shown below.
Applicable Dynatrace entities
The following Dynatrace entities apply to this event:
- Service
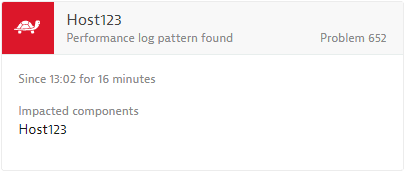
Performance log pattern found
HOST_LOG_PERFORMANCE
Dynatrace Log Monitoring allows you to define log patterns that indicate performance related problems on the host level. Each appearance of a configured pattern is counted over time. If the number of pattern detections exceeds your critical threshold, a performance log pattern event will be raised.
A typical example of a performance log pattern found event is shown below.
Applicable Dynatrace entities
The following Dynatrace entities apply to this event:
- Host
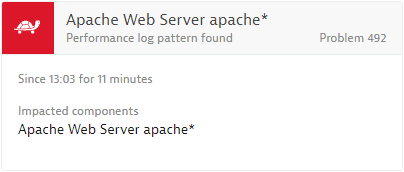
Performance log pattern found
PROCESS_LOG_PERFORMANCE
Dynatrace Log Monitoring allows you to define log patterns that indicate performance related problems on a the process or process-group level. Each appearance of a configured pattern is counted over time and if the number of pattern detections exceeds your critical threshold, a performance log pattern event will be raised.
A typical example of a performance log pattern found event is shown below.
Applicable Dynatrace entities
The following Dynatrace entities apply to this event:
- Process group instance
Synthetic monitor performance threshold violation
SYNTHETIC_SLOWDOWN
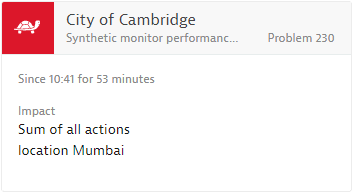
You can define specific performance thresholds for synthetic monitors that check an application from multiple global locations at regular intervals. If a user-defined performance threshold on one of the configured locations isn't met, a synthetic monitor performance threshold violation event will be raised.
A typical example of a synthetic monitor performance threshold violation event is shown below.
Applicable Dynatrace entities
The following Dynatrace entities apply to this event:
- Synthetic monitor
- External synthetic monitor
Custom performance event
PERFORMANCE_EVENT
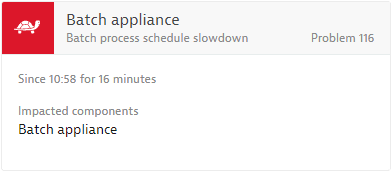
This generic performance event can be used by monitoring plugins or through the Dynatrace REST API to raise a customized performance event with a user-defined title.
An example of a custom performance event with a user-defined title Batch process schedule slowdown is shown below.
Applicable Dynatrace entities
All Dynatrace entities apply to this event.