Error events
This page provides information about supported error events and the logic behind raising them.
![]()
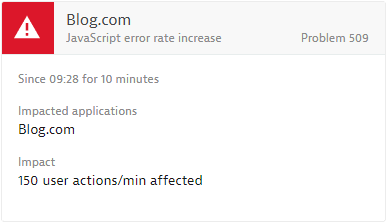
JavaScript error rate increase
JAVASCRIPT_ERROR_RATE_INCREASED
By default, JavaScript error rate increase events are detected by the automated baselining that learns the typical JavaScript error rates for each application and user action. If the JavaScript error rate increases from the learned baseline, Dynatrace raises a JavaScript error rate increase event. Navigate to baselining settings at Settings > Anomaly detection > Web applications to tweak alerting sensitivity.
If you need static thresholds rather than the baseline-based alerting approach, change from automated mode to fixed thresholds, as shown below. The sensitivity controls the level of statistical confidence required to raise an event. Low sensitivity means a high confidence is required, and vice versa. For example, to see events immediately, even if only a few data points have breached the threshold, select high sensitivity.

See a typical JavaScript error rate increase event example below.
Applicable Dynatrace entities
The following Dynatrace entities apply to this event:
- Application
Mobile app crash rate increased
MOBILE_APP_CRASH_RATE_INCREASED
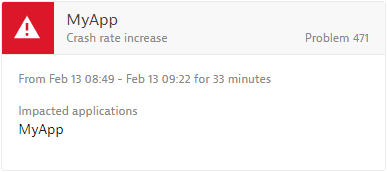
Mobile app (Android and iOS) crashes are recorded along with associated crash stack traces and context information. Dynatrace baselines the number of crashes per app version and alerts when one of your mobile app versions degrades in terms of number of crashes. The observation period for alerting on mobile app crashes is 10 minutes. If Dynatrace observes an unusually high crash rate of one of your mobile app versions within a sliding window of 10 minutes, a mobile app crash rate increase event will be raised. To avoid over alerting in case of low load periods, a minimum number of 10 concurrent users with the same app version need to be active before an event is raised.
See a typical mobile app crash rate increased event example below.
Applicable Dynatrace entities
The following Dynatrace entities apply to this event:
- Mobile application
High rate of dropped packets
HIGH_DROPPED_PACKETS_RATE
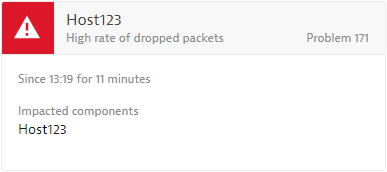
By default, Dynatrace alerts if the percentage of dropped packets on the TCP network level is higher than 10% and the total number of dropped packets is higher than 10 packets/s in 3 of 5 one-minute observation intervals. Navigate to your infrastructure anomaly detection settings at Settings > Anomaly detection > Host to adapt the alerting sensitivity.
See a typical high rate of dropped packets event example below.
Applicable Dynatrace entities
The following Dynatrace entities apply to this event:
- Host
- Hypervisor
High number of network errors
HIGH_NETWORK_ERROR_RATE
By default, Dynatrace alerts if the percentage of failed connection attempts on the TCP network level is higher than 3% and the total number of failed connections is higher than 10 connections/min in 3 out of 5 one-minute observation intervals. Navigate to your infrastructure anomaly detection settings at Settings > Anomaly detection > Host to adapt the alerting sensitivity.
See a typical high number of network errors event example below.

Applicable Dynatrace entities
The following Dynatrace entities apply to this event:
- Host
Lambda high error rate
LAMBDA_FUNCTION_HIGH_ERROR_RATE
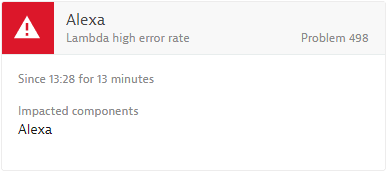
Lambda high error rate event informs about high rate of failed invocations for a specific AWS Lambda function. By default, this event is raised if the rate of failed invocations is higher than 5% in 3 of 5 one-minute intervals. Navigate to Settings > Anomaly detection > Infrastructure > AWS to adapt the sensitivity of Lambda error rate alerting.
See a typical Lambda high error rate event example below.
Applicable Dynatrace entities
The following Dynatrace entities apply to this event:
- AWS Lambda function
Elastic load balancer has a high backend failure rate
ELASTIC_LOAD_BALANCER_HIGH_BACKEND_FAILURE_RATE
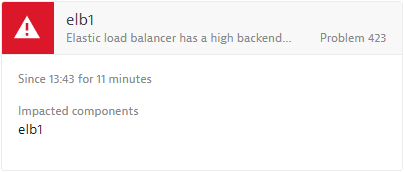
Dynatrace automatically reports the number of failed connection attempts to the backend of an AWS load balancer. By default, Dynatrace opens an alert if the number of failed backend connection attempts is higher than 10 per minute during at least 3 of 5 one-minute intervals.
See a typical Elastic load balancer has a high backend failure rate event example below.
Applicable Dynatrace entities
The following Dynatrace entities apply to this event:
- Elastic load balancer
Error log pattern found
HOST_LOG_ERROR
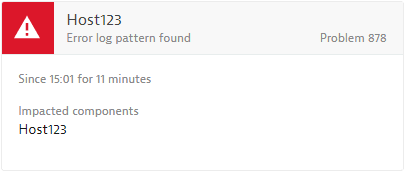
Dynatrace Log Monitoring allows you to define log patterns that indicate error-related problems on the host level. Every appearance of a configured pattern is counted over time and if the number of detected patterns exceeds your critical threshold, an error log pattern event is raised.
See a typical error log pattern found rate event example below.
Applicable Dynatrace entities
The following Dynatrace entities apply to this event:
- Host
Error log pattern found
PROCESS_LOG_ERROR
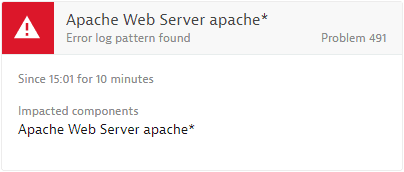
Dynatrace Log Monitoring allows you to define log patterns that indicate error related problems on a process or process group level. Every appearance of a configured pattern is counted over time and if the number of detected patterns exceeds your critical threshold an error log pattern event is raised.
See a typical error log pattern found rate event example below.
Applicable Dynatrace entities
The following Dynatrace entities apply to this event:
- Process group instance
Custom error event
ERROR_EVENT
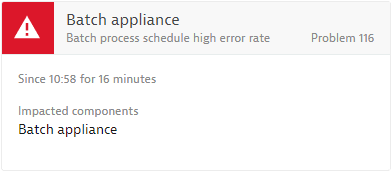
This generic error event can be used by monitoring plugins or through the Dynatrace REST API to raise a customized error event with a user-defined title.
See a typical custom error event with a user-defined title Batch process schedule high error rate below.
Applicable Dynatrace entities
All Dynatrace entities apply to this event.
Restart sequence
RDS_RESTART_SEQUENCE
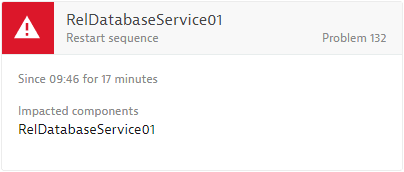
Dynatrace detects and alerts on abnormal relational database service (RDS) restarts. By default, a restart sequence event is raised if an RDS instance shows a total number of restarts higher than 2 within an observation period of 20 minutes.
See a typical restart sequence event example below.
Applicable Dynatrace entities
The following Dynatrace entities apply to this event:
- Relational database service