Detection of frequent issues
Within large environments, certain aspects of your system may consistently trigger alerts that are unnecessary because they relate to non-severe known issues that don't require a human response. Such alert noise may come from non-critical components or build machines that are low on resources, but aren't in a critical state.
To reduce such alert noise and avoid alert spamming, the Dynatrace AI causation engine automatically detects regularly occurring issues that originate from sub-optimal, though acceptable, conditions. Dynatrace detects such frequent issues by reviewing the problem patterns of monitored entities within specified observation periods of one day and one week.
When the same problem is detected multiple times within these periods, Dynatrace evaluates the problem based on the actual severity of a threshold breach combined with the duration of the problem. It then compares the severities and durations of past problem alerts on the same entity and only alerts if the severity of the problem has increased. The following diagram illustrates this process.
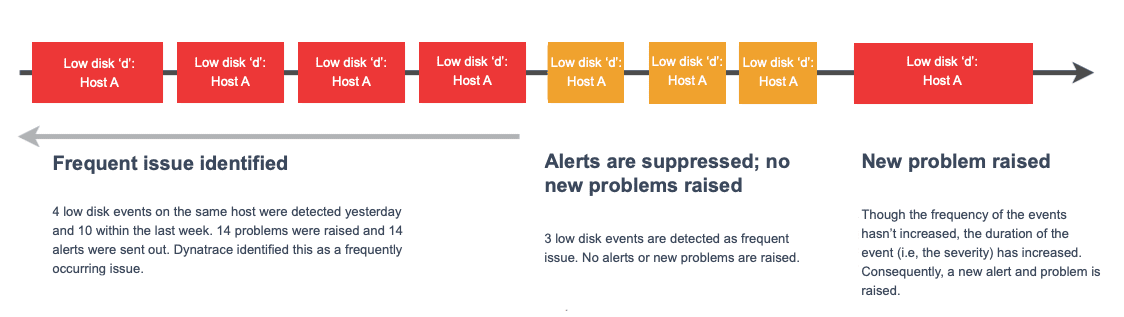
Problems that are less severe and have a shorter duration than previous alerts are considered to be frequent issues and so alerts are suppressed for these. For details on event severities, see event types.
This intelligent approach to detection and handling of frequent issues guarantees that you receive alerts for problems that increase in severity over time while simultaneously avoiding alert spamming.
Entity overview pages that are subject to frequent issues include a Frequent issue message.
Frequent issue evaluation
The diagram below shows the classification of issues.
- Green is normal operating state.
- Yellow is an event that reoccurs frequently but is normal for your system. It can be, for example, a slow disk event that relates to a non-mission critical device. These events are unhealthy but no alerting is necessary.
- Red is an event that does affect the normal operation and triggers an alert.
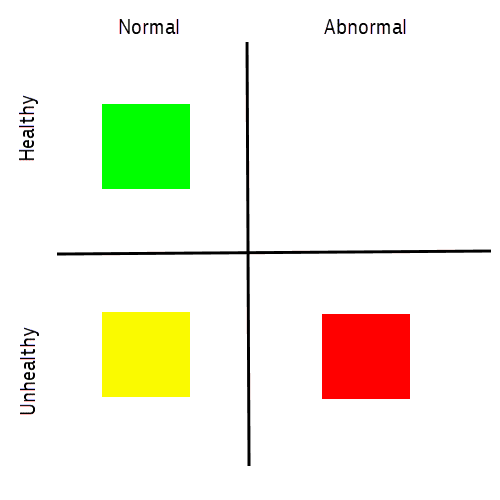
The goal of the evaluation process is to classify an incoming event as yellow or red.
The evaluation process is independent for every event type and every monitored entity. It begins with two sets of historic events:
- Events for the last 24 hours
- Events for the last 7 days
And goes as follows:
- The 24-hours set is sorted in two ways:
- Duration (shortest to longest)
- Severity (less to more severe)
- When a new event arrives, it is placed in proper position in each of these sorted sets.
- From each initial sorted set, a subset is created, consisting of events to the right of the new event (that is, longer and more severe).
- A reference set is created, consisting of events that appear in both of these two subsets.
- The size of the reference set is calculated as the number of events in the reference set.
- The duration of the reference set is calculated as the sum of the durations of the events in the reference set.
- The same reference set is created from the 7-days set.
- The following criteria are evaluated:
- If the size of the 24-hours reference set equals or is greater than 3, the condition is resolved as yellow. Otherwise it is resolved as red.
- If the duration of the 24-hours reference set is equal to or greater than 50% of 24 hours (12 hours = 720 minutes = 43,200 seconds), the condition is resolved as yellow. Otherwise it is resolved as red.
- If the size of the 7-days reference set is equal to or greater than 7, the condition is resolved as yellow. Otherwise it is resolved as red.
- If the duration of the 7-days reference set is equal to or greater than 30% of 7 days (50.4 hours = 3,024 minutes = 181,440 seconds), the condition is resolved as yellow. Otherwise it is resolved as red.
- If at least one condition is resolved as yellow, the event is classified is yellow.
Otherwise it is classified as red and an alert is triggered.
After initial evaluation, every yellow event is evaluated again with a 1-minute interval until it shifts to red or is deactivated.
See the expandable section below for an example of the evaluation process.
For the sake of simplicity, this example only considers the 24-hours set. In this example the event type is CPU saturation on a host.
Historic events for the last 24 hours have the following durations and severities:
Event1—45 seconds, 95.5%
Event2—15 seconds, 99%
Event3—35 seconds, 98%
Event4—30 seconds, 97%
Event5—60 seconds, 96%
The sorted sets look like this:
Duration: {Event2, Event4, Event3, Event1, Event5}
Severity: {Event1, Event5, Event4, Event3, Event2}
A new event arrives: EventNEW—28 seconds, 95%. It takes the following positions in sorted sets:
Duration: {Event2, EventNEW, Event4, Event3, Event1, Event5}
Severity: {EventNEW, Event1, Event5, Event4, Event3, Event2}
The subsets, consisting of the events to the right, look like this:
Duration: {Event4, Event3, Event1, Event5}
Severity: {Event1, Event5, Event4, Event3, Event2}
The following events appear in both subsets and form the refence set: {Event1, Event3, Event4, Event5}.
The size of the reference set is 4. The condition is resolved as yellow.
The duration of the reference set is 170 seconds. The condition is resolved as red.
There is one yellow condition, therefore the EventNEW is classified as yellow and doesn't trigger an alert.