Anomaly detection configuration
An anomaly detection configuration relies on several components:
- Data source—a time series that is evaluated. It can be a DQL query, fetching data from Grail or a specific metric.
- Analyzer type and parameters: how the data is evaluated.
- Sliding window: a period over which the data is evaluated.
- Event template: what kind of template is triggered by the configuration.
Once configured and activated, the configuration observes the data and triggers and event when conditions are met. To ensure the configuration works as expected and alerts you about the right events, you can preview the results of its work:
- Latest Dynatrace Use the Davis for Notebooks integration to simulate the analyzer's work. The preview in a notebook shows potential events based on your data without triggering any real events.
- Previous Dynatrace The preview of a metric event visually represents your event's behavior. You can adjust the settings to see how they affect the configuration.
Data source
Data source provides a time series that is evaluated by Davis:
- Latest Dynatrace The time series is defined by a DQL query. Even if you created a configuration in a notebook using a metric visualization, the key is transformed and stored in the configuration as a DQL query. DQL is a powerful tool that allows you to detect anomalies in any data stored in Grail.
- Previous Dynatrace A metric defines the time series. It can be a single metric defined by a metric key or a metric expression.
If your data has a latency, you need to offset it in your configuration via the Query offset parameter. Specify the value in minutes.
Analyzer type and parameters
Analyzer parameters define how Davis evaluates the data provided by the data source. The exact set of parameters depends on the type of the analysis:
- Auto-adaptive threshold—Dynatrace calculates the threshold automatically and adapts it dynamically to your data's behavior.
- Seasonal baseline—Dynatrace creates a confidence band for data with seasonal patterns.
- Static threshold—the threshold that doesn't change over time.
Missing data alert
Dynatrace provides you the ability to set an alert on missing data in a metric or a DQL query. If the alert is active, Dynatrace regularly checks whether the sliding window of the anomaly detection configuration contains any measurements. For example, if the sliding window is set to 3 minutes during any 5 minutes, Dynatrace triggers an alert if there's no data within a 3-minute period.
The missing data condition and threshold condition are combined by the OR logic.
We recommend disabling missing data alerts for sparse data streams, where measurements are not expected in regular intervals, as it will result in alert storms.
For expected late-incoming data (for example, cloud integration metrics with a 5-minute delay), use long sliding windows that cover delays. For a 5-minute delay, use a sliding window of at least 10 minutes.
The {missing_data_samples} event description placeholder resolves to the number of minutes without data received.
Sliding window
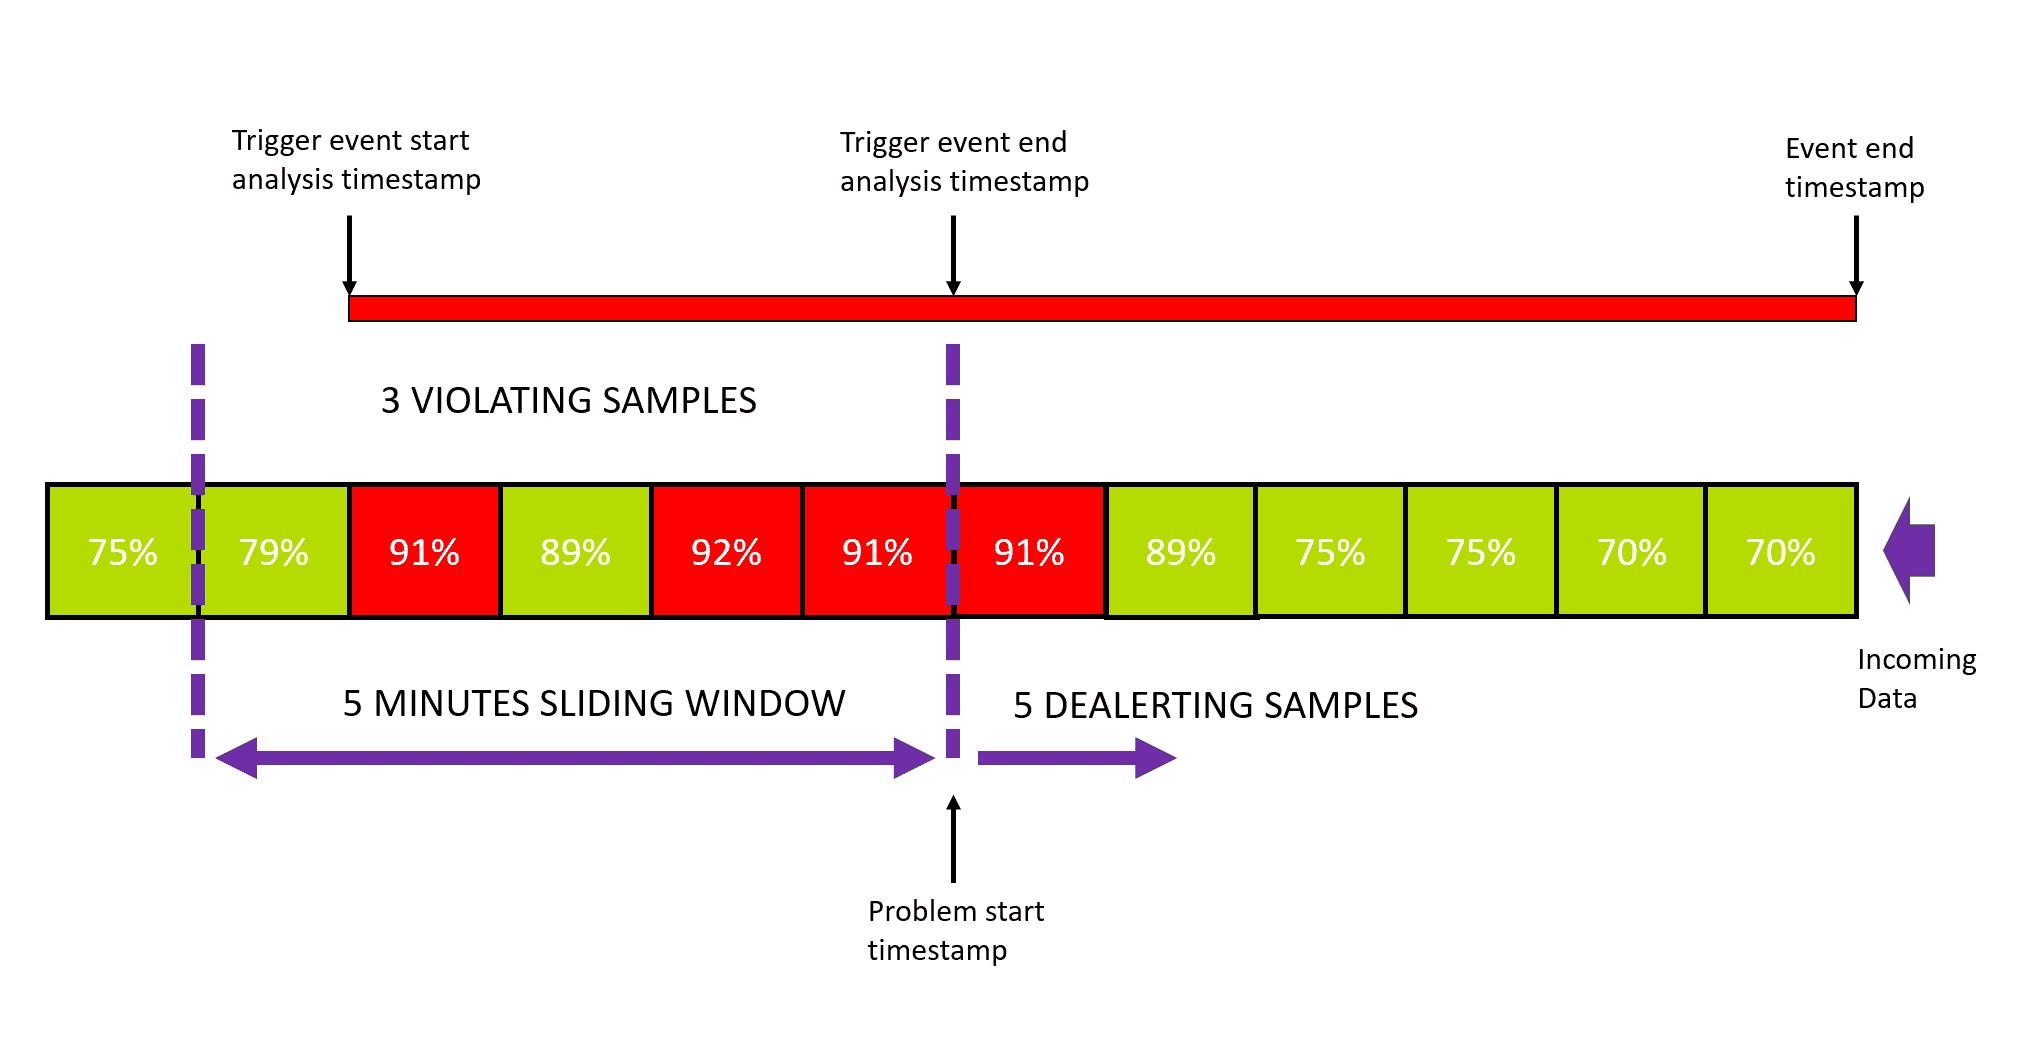
The sliding window of an anomaly detection configuration defines how many one-minute samples must violate the threshold during a specific period. When the specified number of violations is reached, Dynatrace raises an event. The goal is to avoid overly aggressive alerting on single violations, when every measurement that violates the threshold triggers an event.
The event remains open until the metric stays within the threshold for a certain number of one-minute samples within the same sliding window, at which point Dynatrace closes the event. Keeping the event open helps to avoid over-alerting by adding new threshold violations to an existing problem instead of raising a new one.
You can find settings for the sliding window in the Advanced properties section of the configuration. By default:
- Any three one-minute samples out of five must violate your threshold to raise an event.
- Five one-minute samples must be back to normal to close this event.
You can set a sliding window of up to 60 minutes.
Let's consider a case of a static threshold of 90% CPU usage.

The event analysis starts with the first violating sample in the sliding window. Once the number of violating samples reaches the defined threshold, the event analysis stops and a problem is raised. Even though event analysis is stopped, the event itself remains open until the de-alerting criteria are met:
- The number of violating samples must be lower than the threshold number to raise the problem.
- The number of "normal" samples must be greater than or equal to the number of de-alerting samples.
Both criteria must be met to close the event.
The default numbers (3 violating samples in the sliding window of 5 samples to trigger a problem, 5 de-alerting samples to close the event) are a good fit for most configurations. However, you might need to update them (for example, due to noise in measurements).
Event template
The event template defines characteristics of an event triggered by threshold violation. You need to provide at least the name and the type of the event.
- For quick understanding of the event, the name should be a short, easy-to-read description of the situation, such as
High network activityorCPU saturation. - The name can include placeholders such as
{threshold}or{alert_condition}. Placeholders are replaced with real values in the actual event. To see available placeholders, type{in the input field.
You can provide additional parameters as key-value pairs. For a list of possible event properties, see Semantic dictionary.