Virtual machine migration and performance
- How-to guide
- Published Jul 19, 2017
Virtual machine migration can greatly affect CPU resources in your cluster and lead to unwanted queuing of tasks on your virtual machines.
Track vMotion events with VMware vCenter
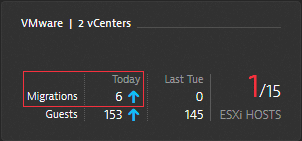
Dynatrace tracks vMotion events for all the vCenters in your IT infrastructure, showing you daily (counters are reset at midnight each day) and past-week percentages. Each vMotion event consumes resources on the target ESXi host. Even when newly migrated virtual machines don't immediately require more CPU or memory, other virtual machines that exist on the same host might need more resources. The result is that target ESXi hosts can experience problems allocating requested resources and CPU saturation can occur.
The VMware vCenter dashboard tile shows the number of migrations that have occurred during the past 24 hours and allows you to compare this number to the same 24-hour timeframe one week earlier.

Monitor CPU ready time
To view ready time information for a virtual machine
- Go to VMware (previous Dynatrace) or
 VMware Classic and select the vCenter cluster that includes the host with the virtual machine you want to examine.
 - Select the VMware host from the vCenter cluster table.
- Select Consuming virtual machines or Show details to view the CPU and memory data for the selected host machine.
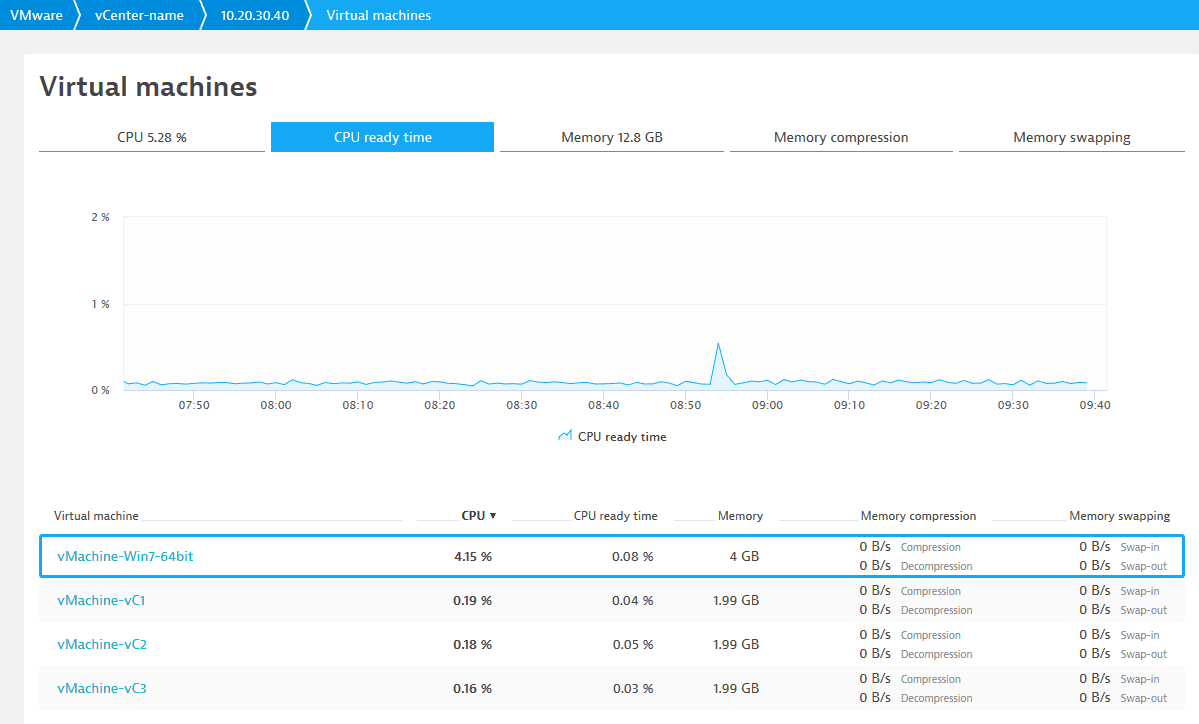
- Select the CPU ready time tab for a chart view of the ready time metric. Selecting the virtual machine in the table below the chart updates the CPU ready time chart accordingly.
Ready time tab of virtual machine details page

CPU ready time should remain below 10%. A CPU ready time measurement over 10% indicates that your virtual machines are competing for available resources and a virtual machine is unable to execute all of its tasks. Such contention can lead to a drop in application performance.
Machines with a ready time value over 10% typically have poor performance.