Overview of all technologies running in your environment
- How-to guide
- Published Jul 19, 2017
The Technology overview page provides a consolidated overview of the health and performance of all monitored technologies in your environment. This saves you the effort of browsing multiple technology-specific analysis views to get the information you need. To access the Technology overview page, go to Technologies & Processes (previous Dynatrace) or  Technologies & Processes Classic.
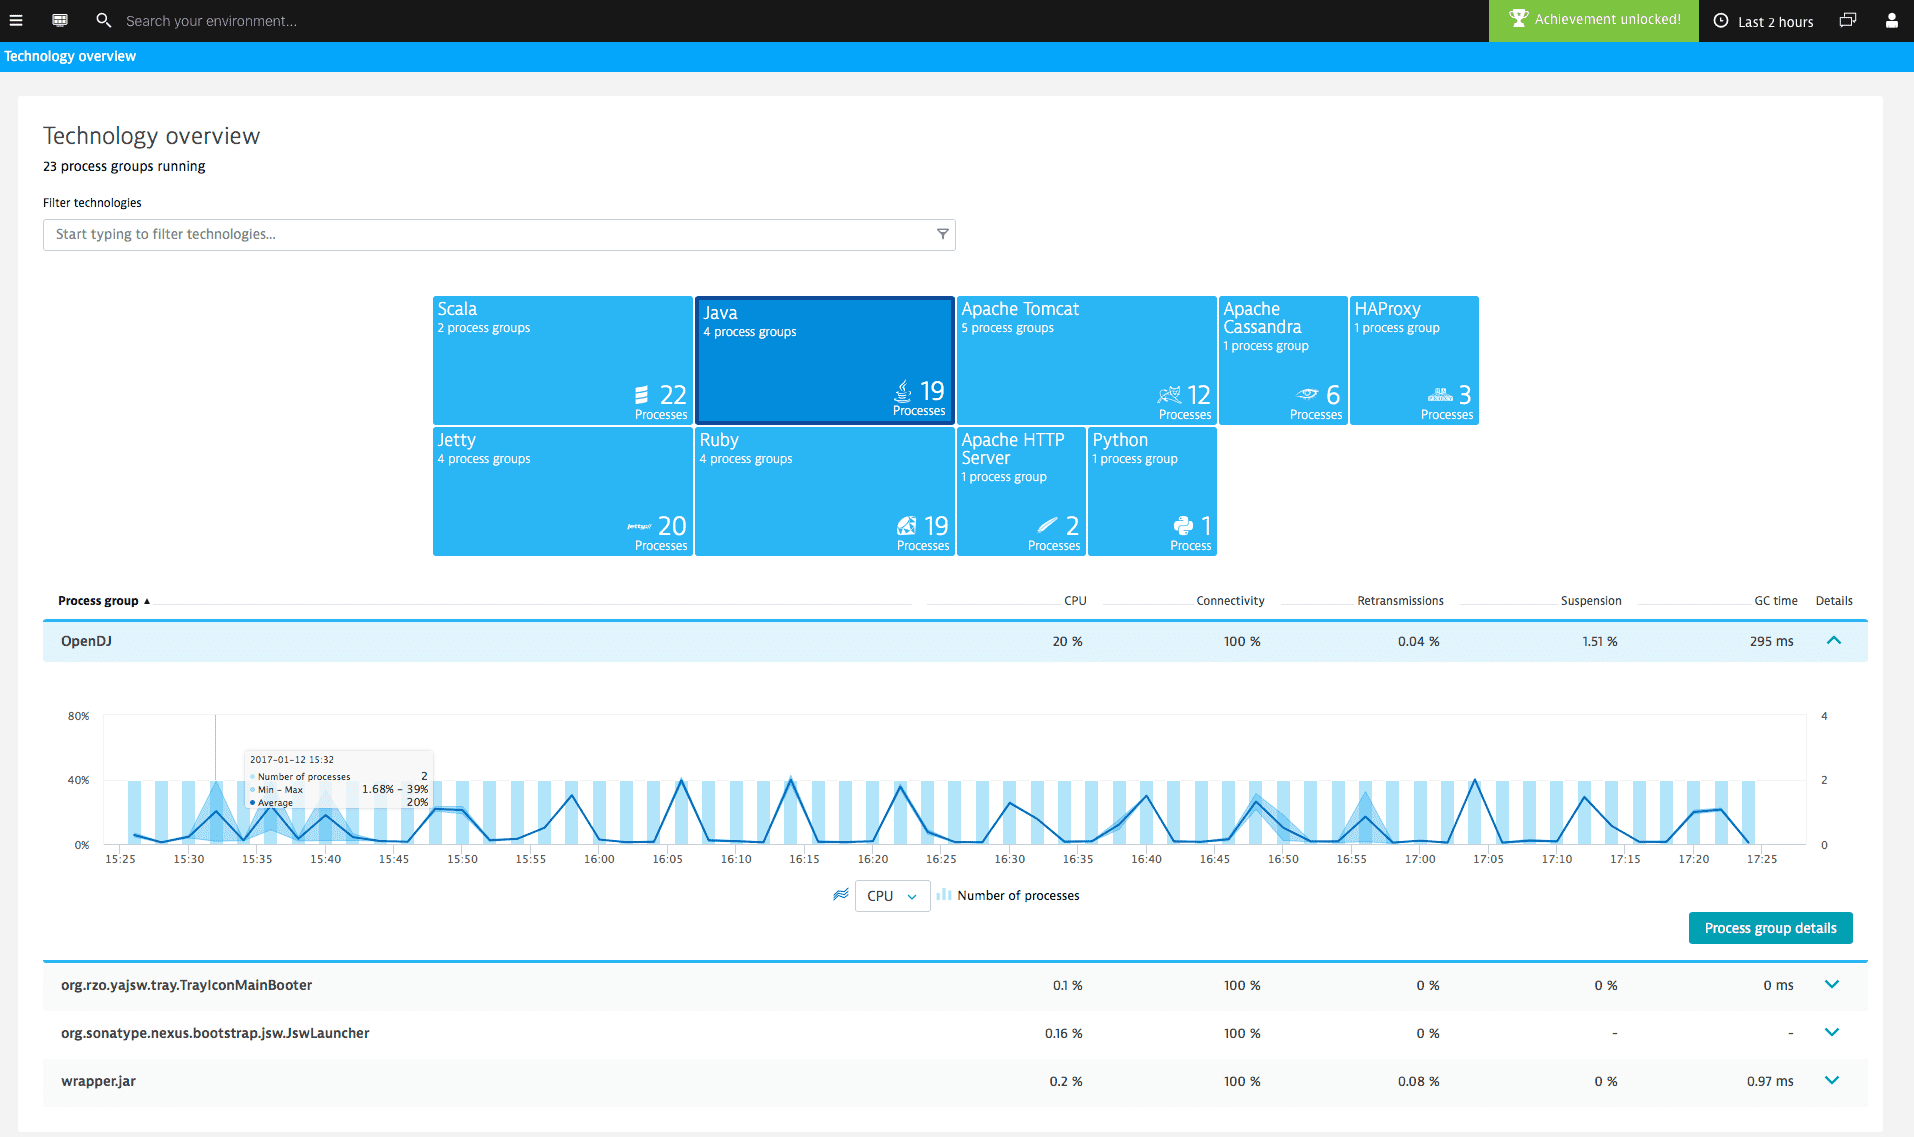
The Technology overview page is organized around tiles—1 tile for each technology-specific process group in your environment. Each process group represents a set of processes that perform the same function across multiple hosts, for example Cassandra or ElasticSearch clusters.
For each process group you get visibility into the number of instances and their resource-usage distribution, including an indication of minimum and maximum metric values.
In the example below, there is a Java process group that's composed of 2 process group instances. This process group has periodic CPU consumption spikes, with one of the process group instances consuming 39% of CPU while the same processes on another machine are consuming only 1.68% of available CPU.

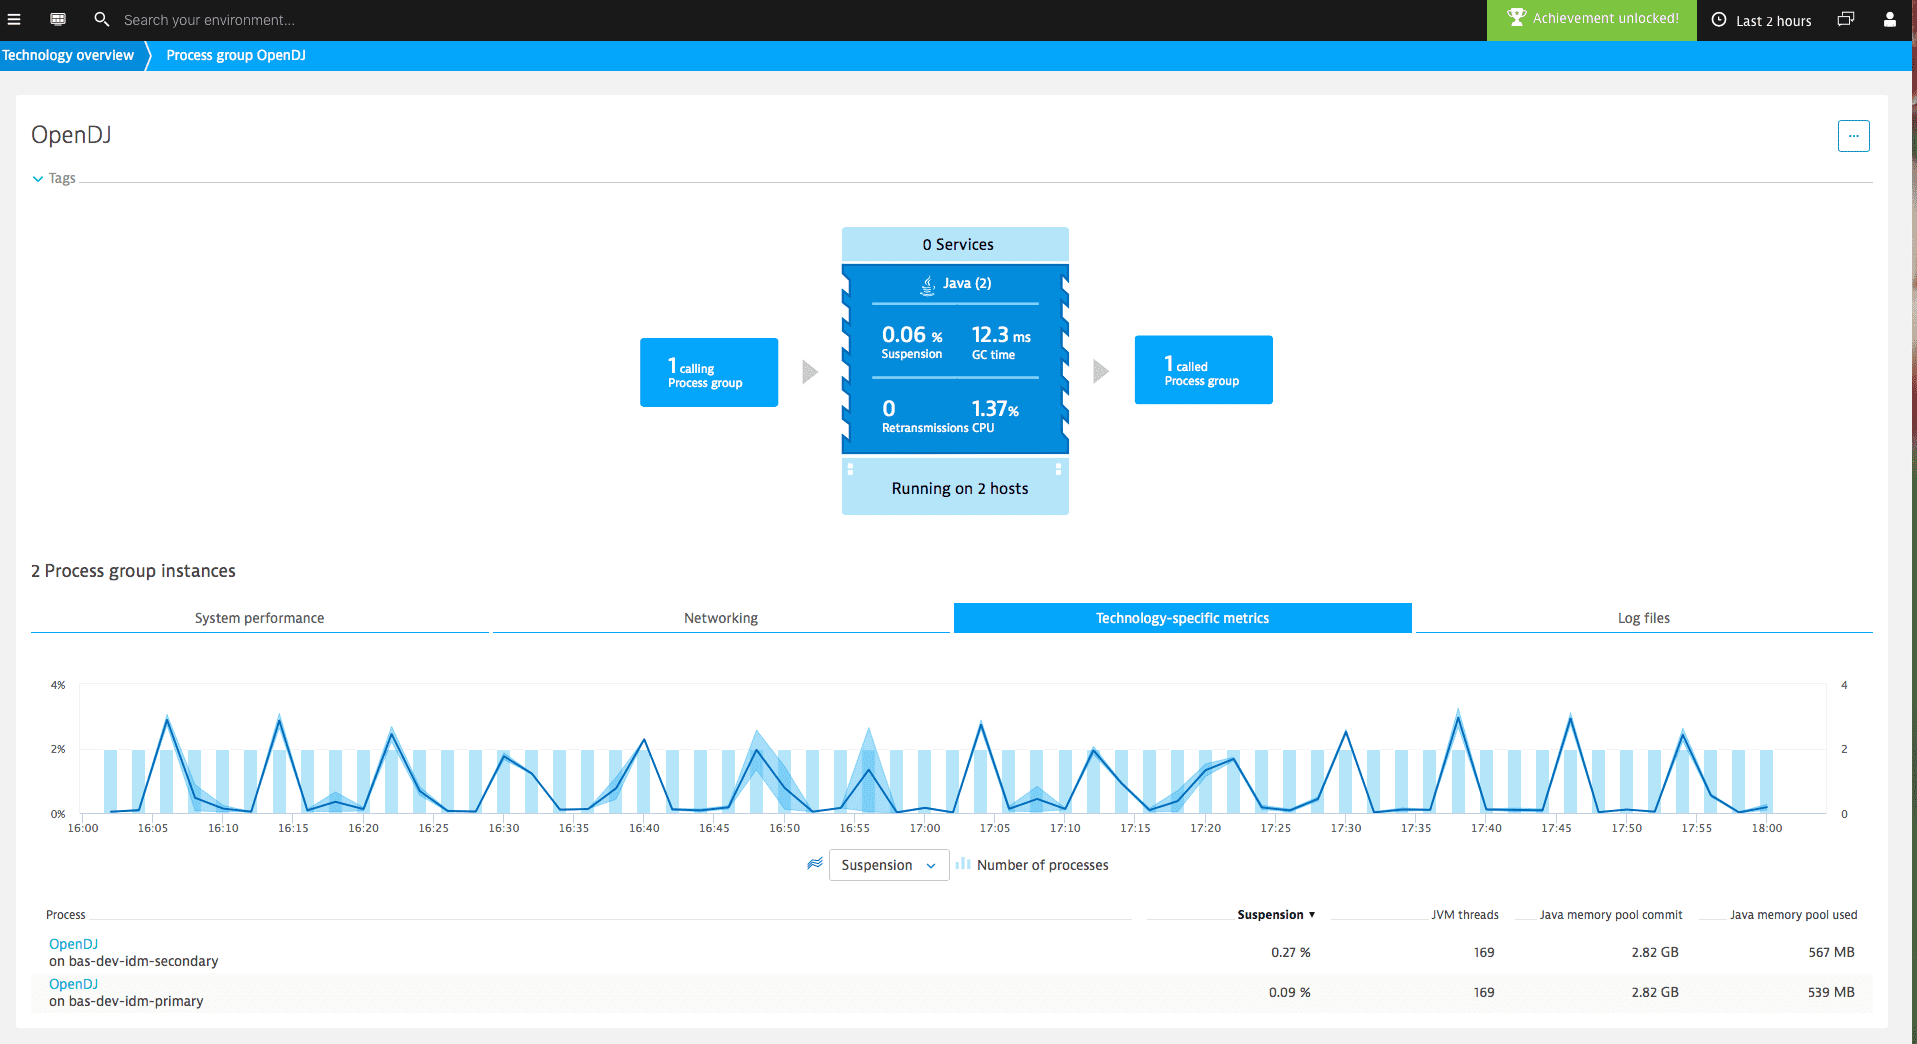
Select Process group details to access process group view, which includes comprehensive metric categories, such as:
- System performance (memory and CPU),
- Networking (connectivity and retransmissions),
- Technology-specific metrics (GC time, suspension).
- Log files
You can even perform log analysis for the processes that are included within each process group.
