Assess and troubleshoot cluster health
Latest Dynatrace
The Kubernetes app streamlines the process of assessing the health of clusters, enabling you to easily monitor health signals and metrics across your environment. It provides clear insights into cluster health, helping you identify and address issues, and ensuring your clusters are functioning efficiently.
Davis AI health status
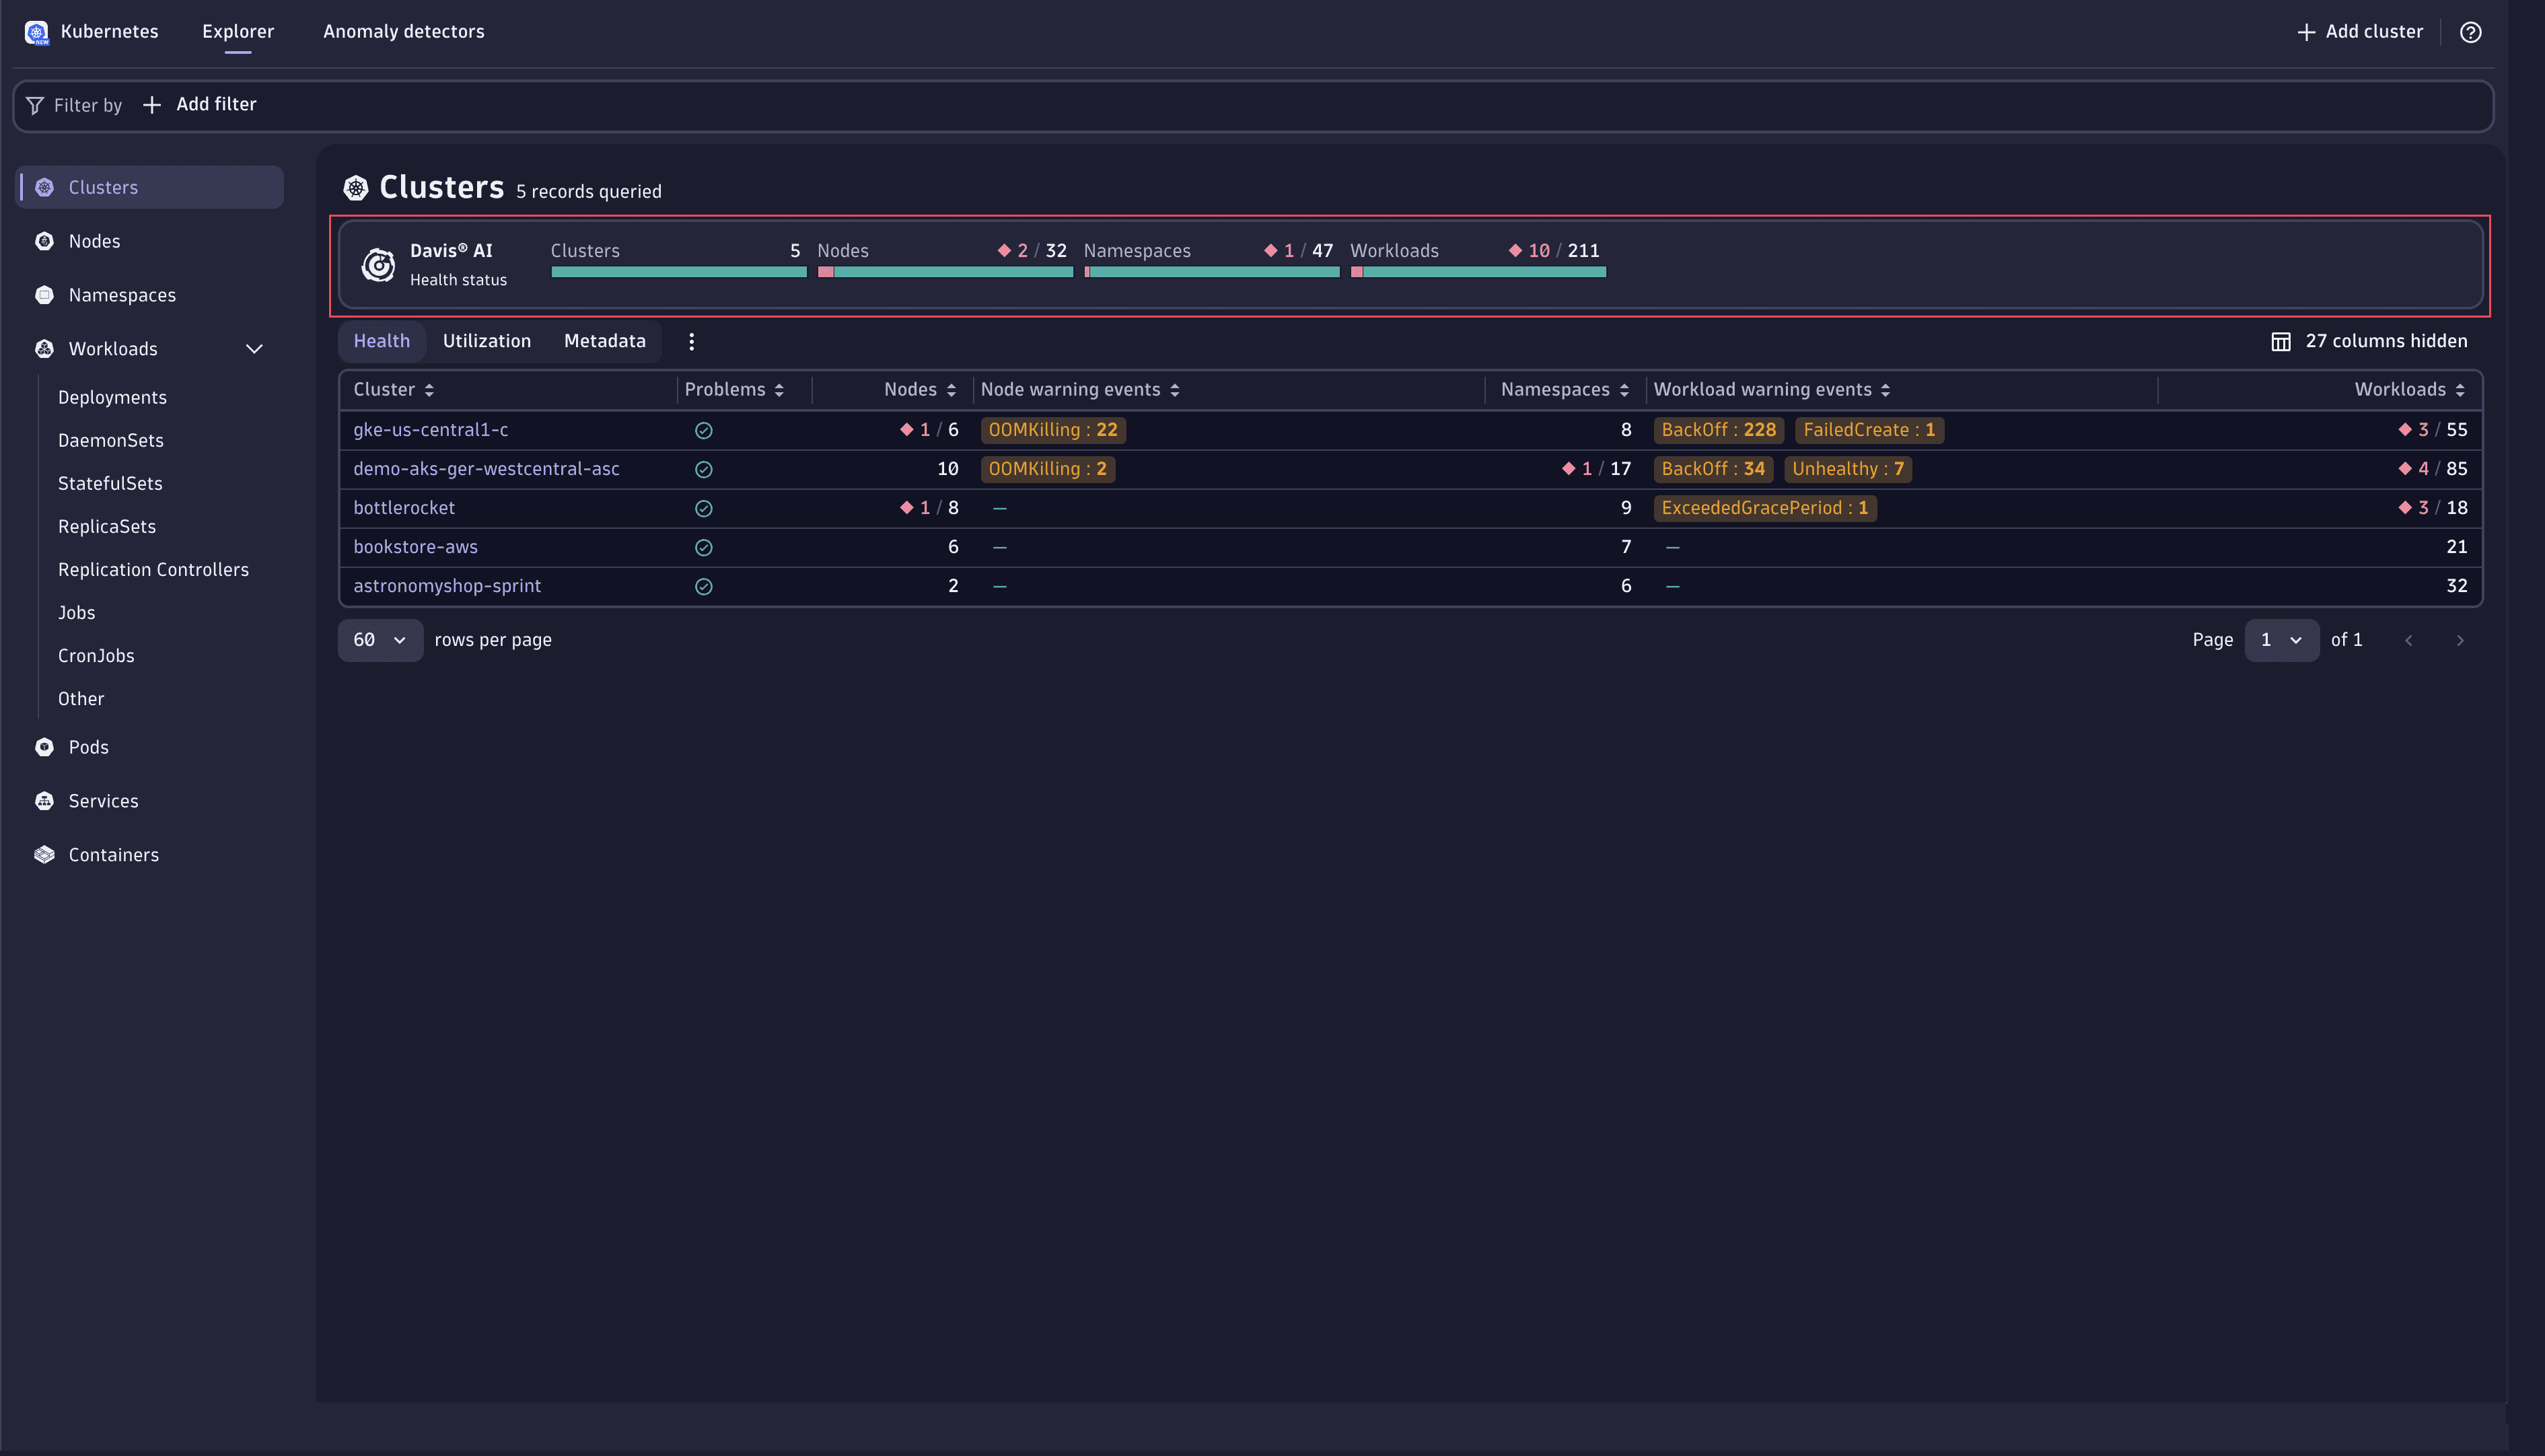
Get a quick health overview using the Davis AI health status on top of the cluster list. Davis AI automatically assesses and aggregates the health of Kubernetes clusters, nodes, namespaces, and workloads. This feature visualizes the current health state at a high level, enabling you to easily identify both healthy and unhealthy clusters, nodes, namespaces, and workloads.
Troubleshoot unhealthy resources
In the example below, we observe that all clusters are currently healthy, but some nodes, namespaces, and workloads are in an unhealthy state.
To troubleshoot these unhealthy Kubernetes objects
-
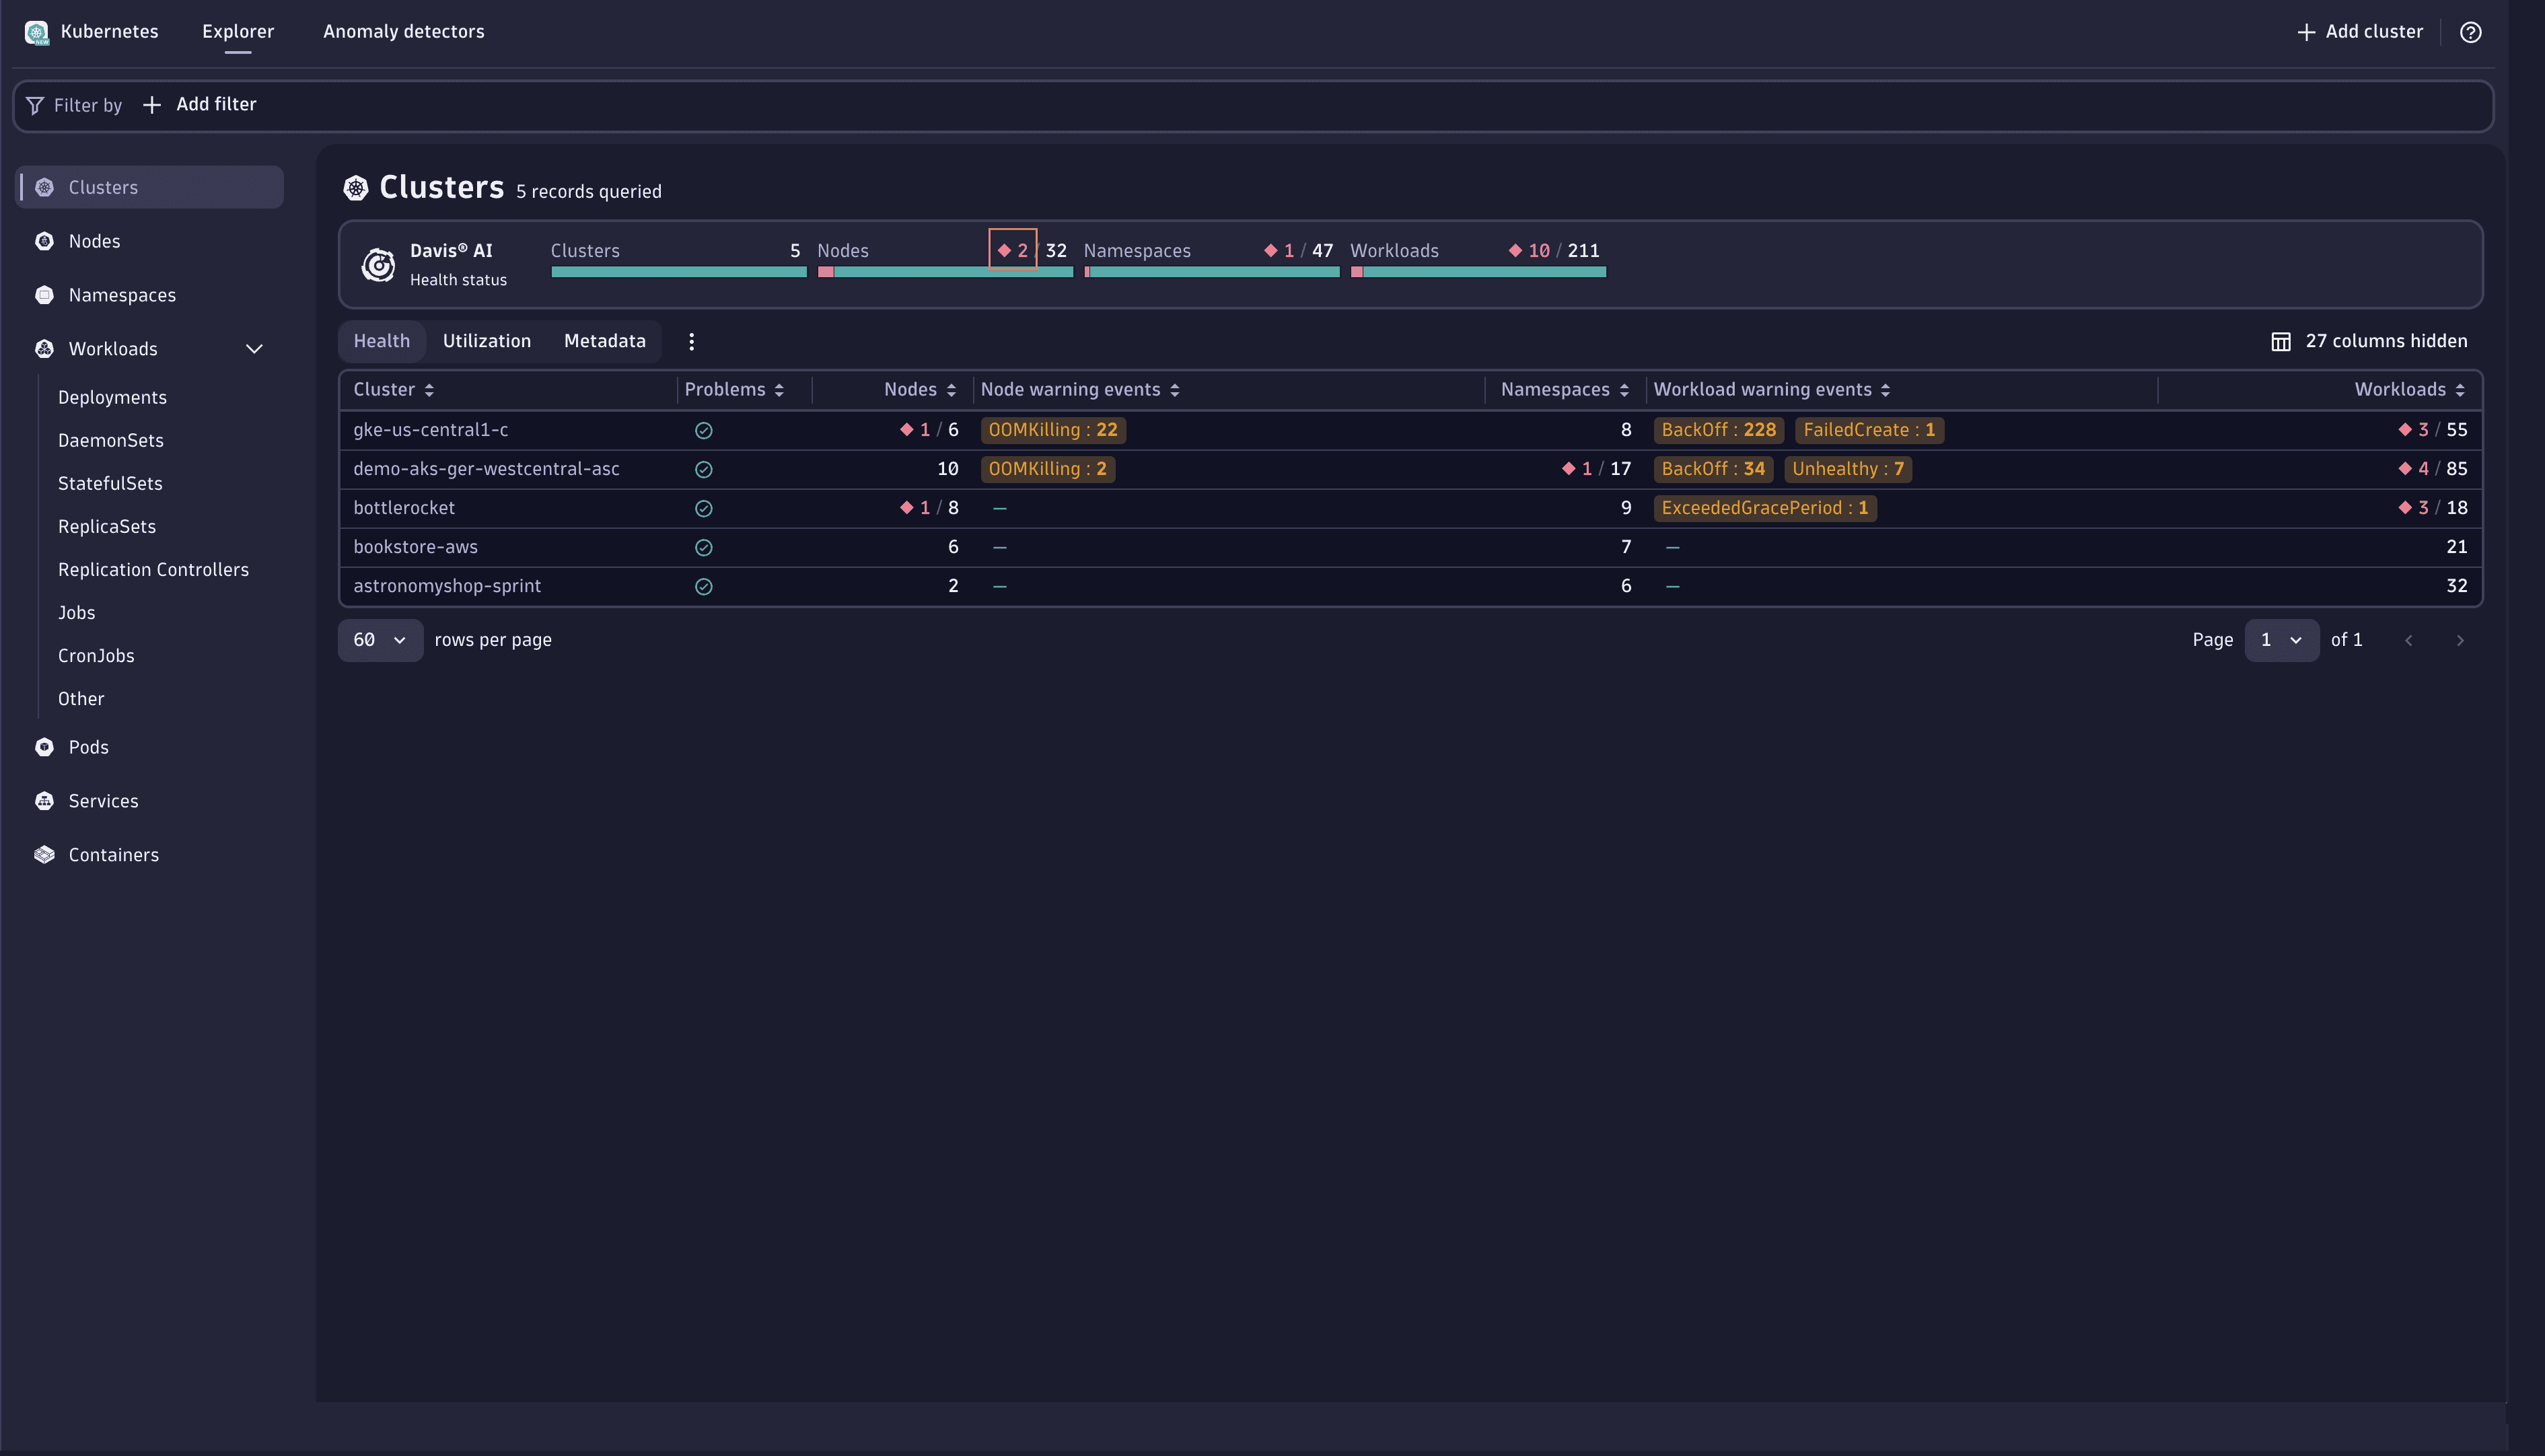
Select the red numbers displayed within the health status area. This action reveals a list of the unhealthy objects in the corresponding table, providing additional insights into the nature of the problems they are facing. For instance, you might notice a node in the cluster that is actively evicting pods, indicating an issue with ongoing memory pressure.
-
Select the node from the list.
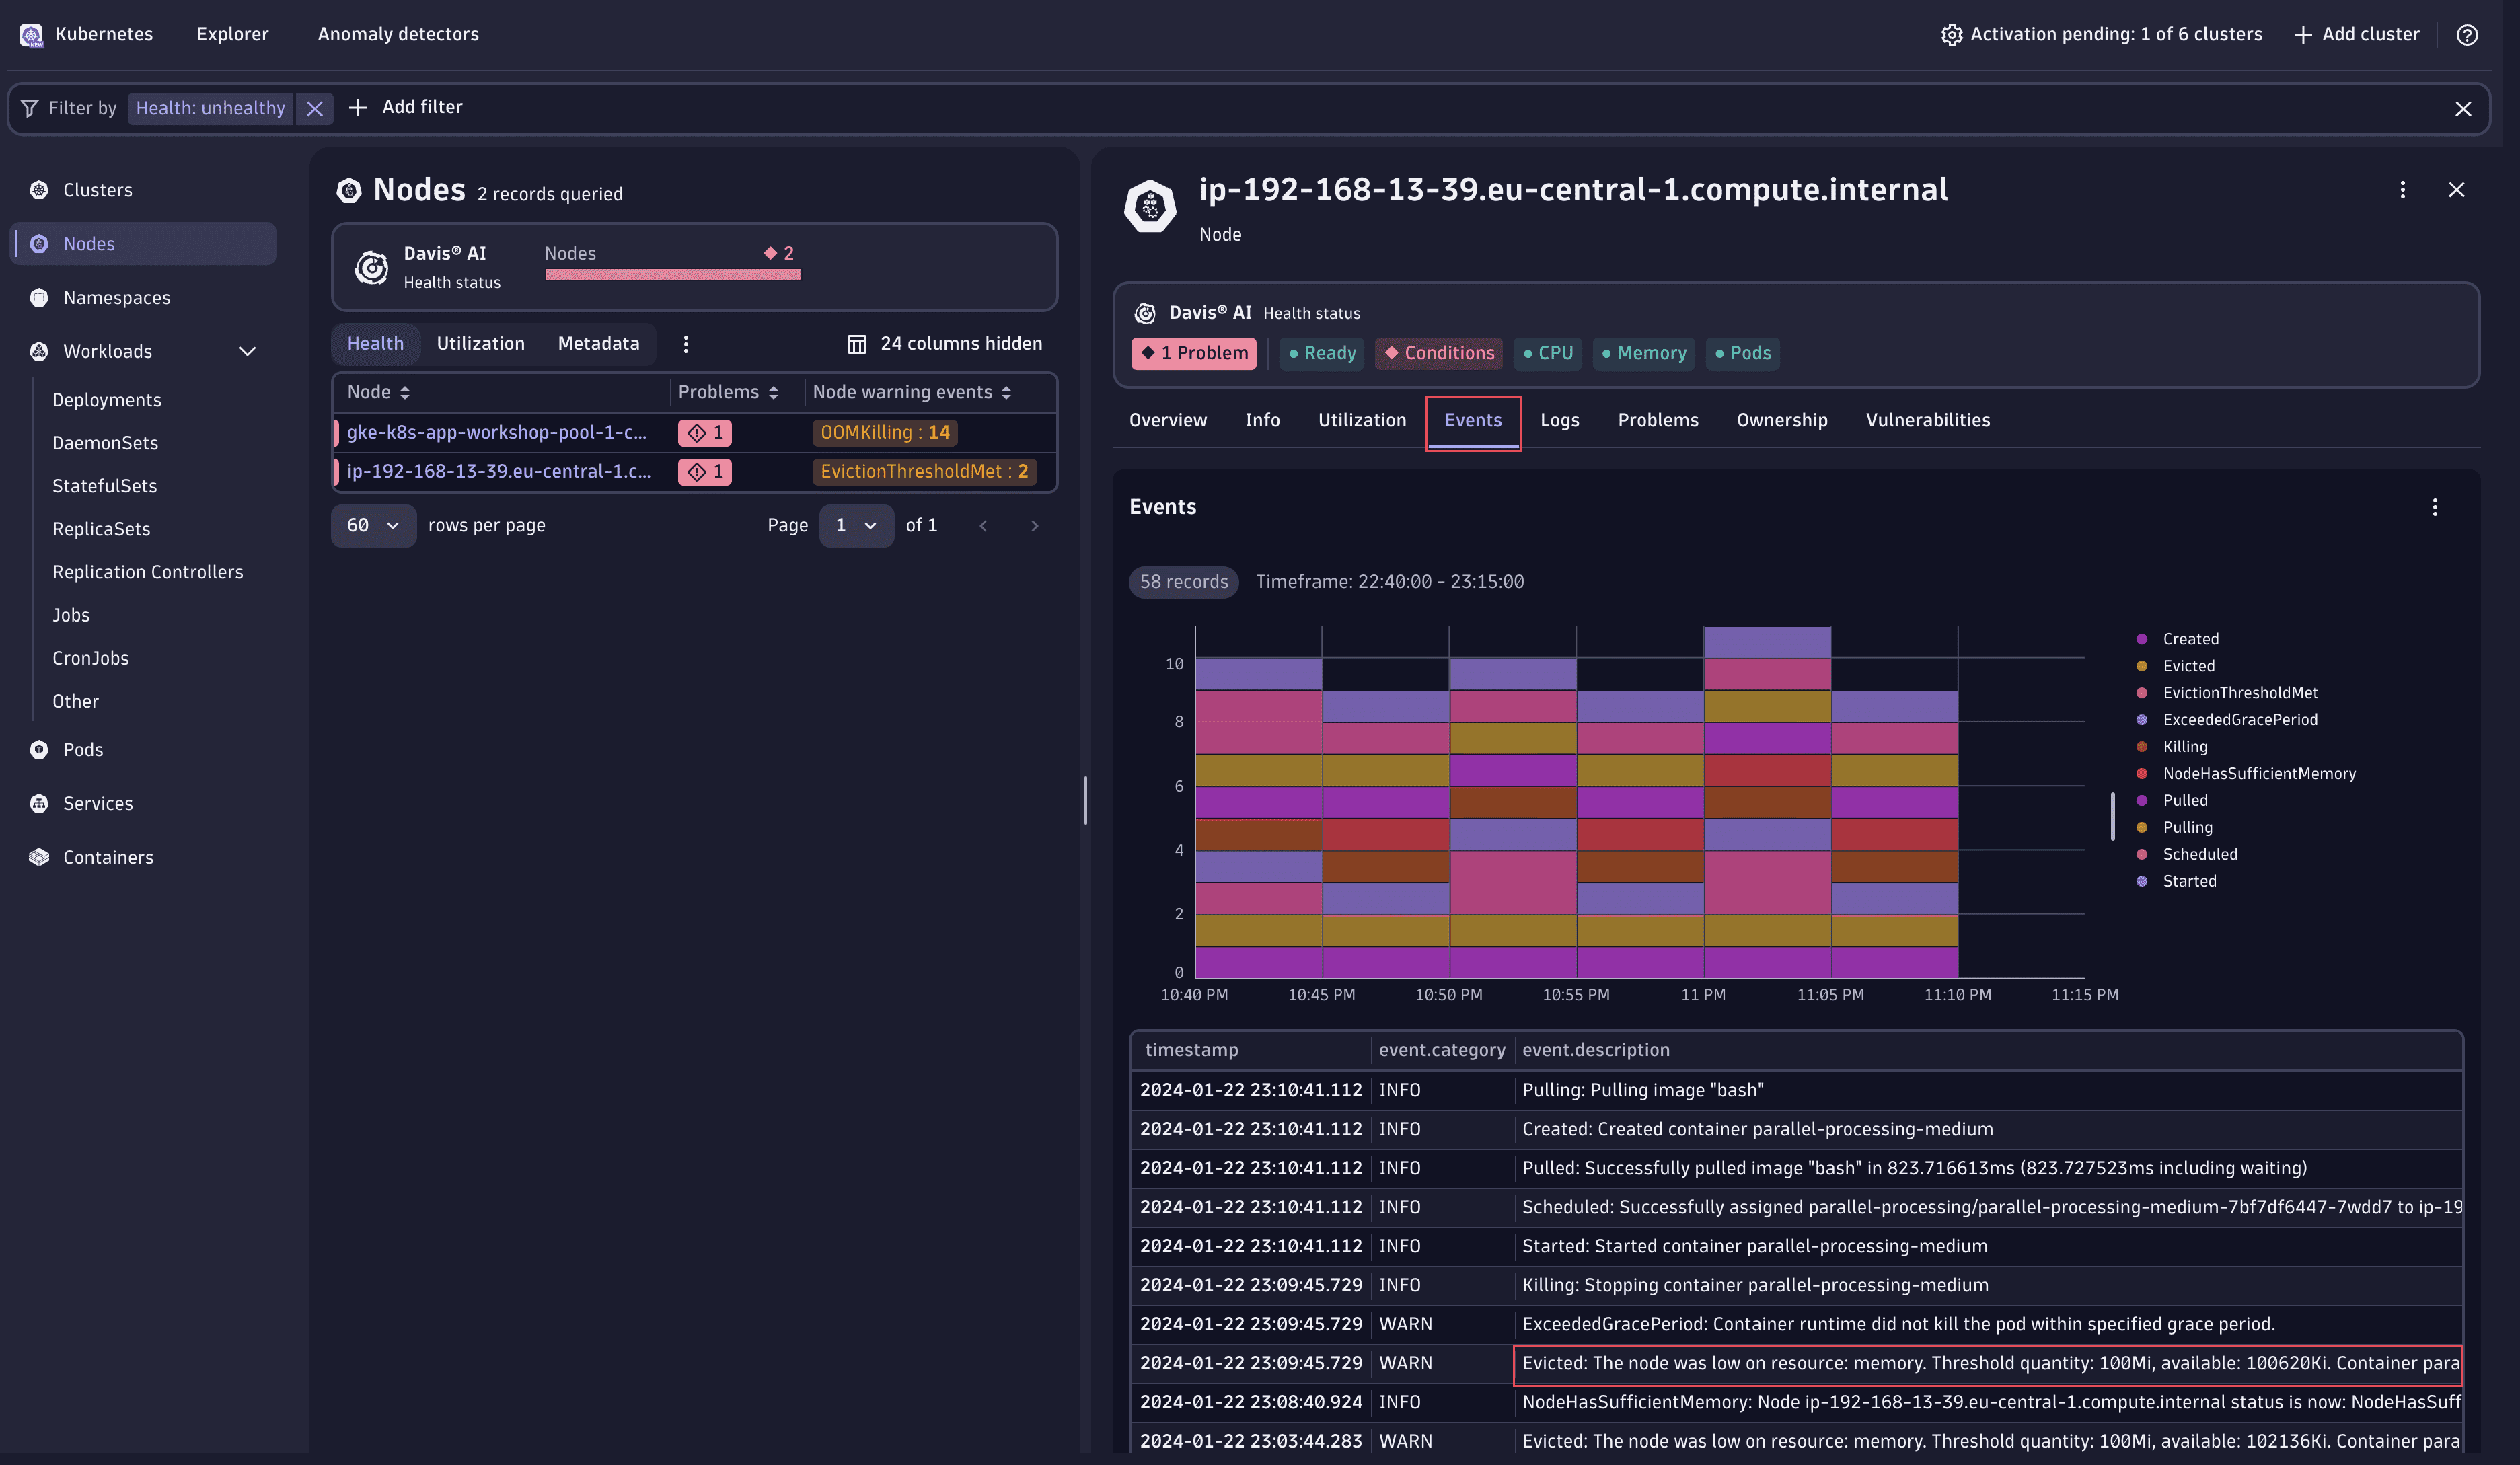
The Davis AI health status at the top signals the issue with conditions. There's a detailed breakdown of the node resource utilization. Pay attention to the Memory section. If memory usage exceeds the allocated requests, it indicates a potential resource strain. Kubernetes, in an effort to maintain node stability, might begin evicting pods to free memory. This is often a response to pods consuming more memory than available, based on their reserved requests.
-
To identify which pods have been evicted, refer to the Events section for this node.
-
Select the relevant line in the Events section and choose Show full value to reveal the full details of the event. In this example, you can see that the pod named
parallel-processing-mediumwas evicted due to resource constraints.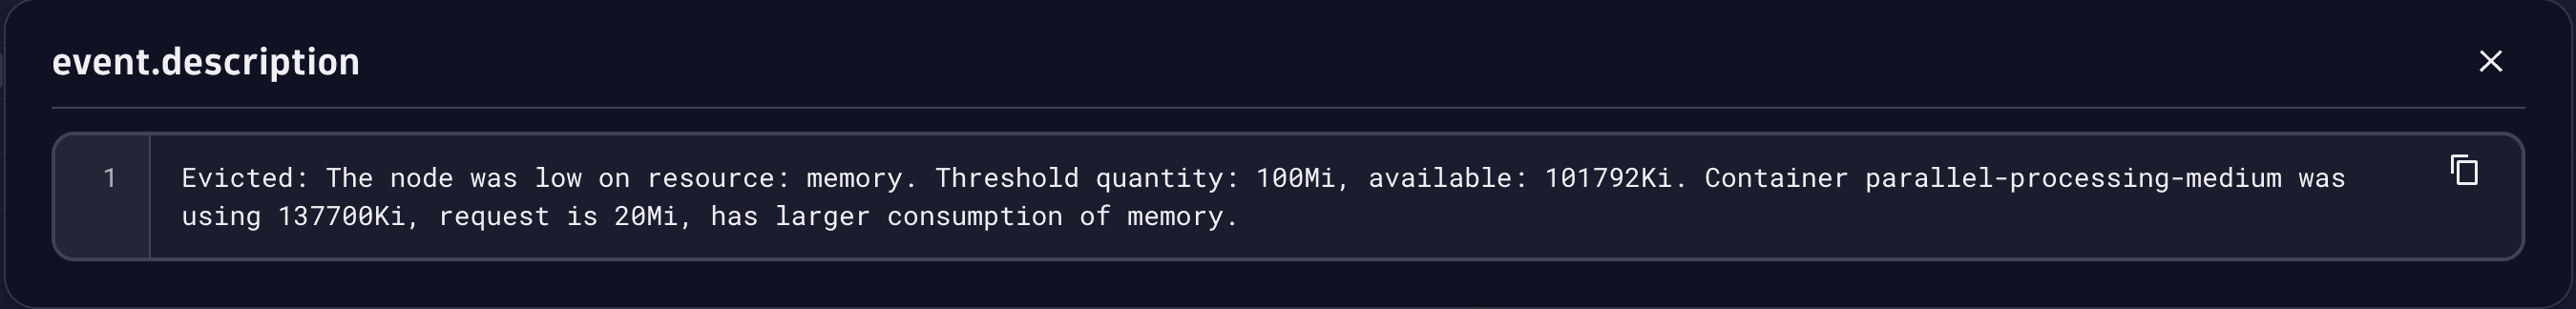
-
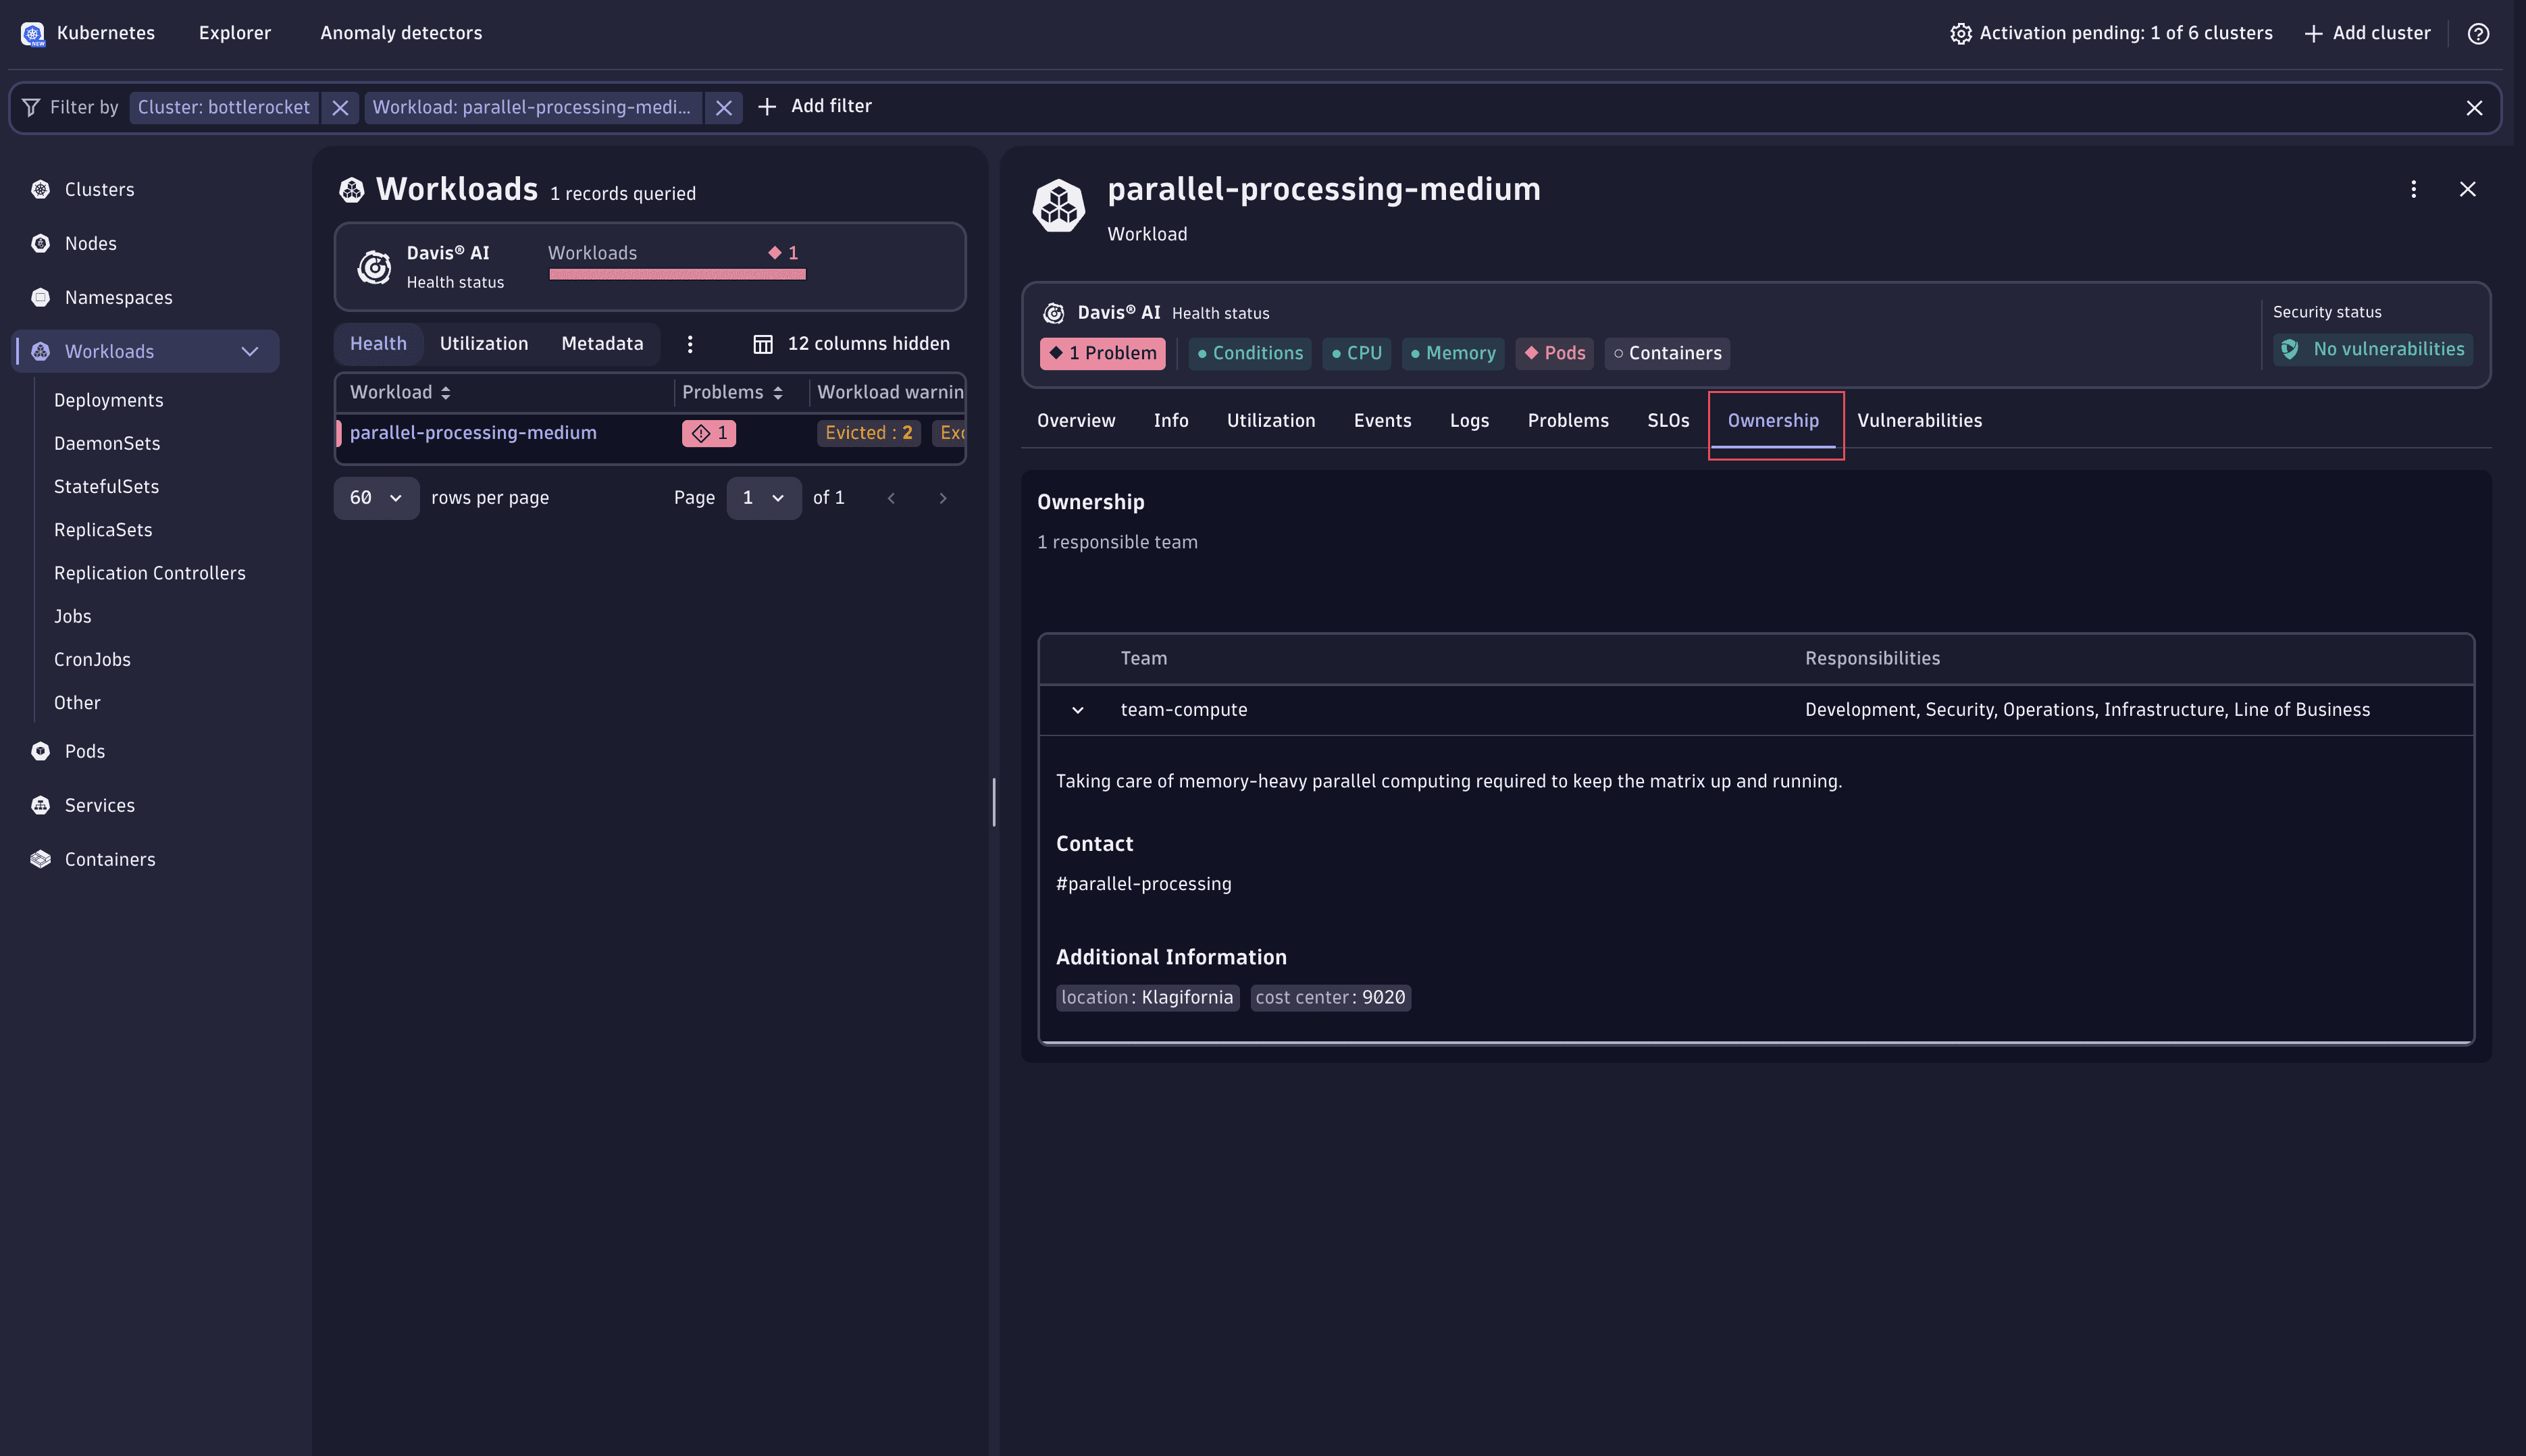
Go to the Workloads list and use the filter bar to search for the
parallel-processing-mediumworkload. Select this workload to display details. In the Workload utilization section, you can quickly spot misconfigurations of resource requests.
-
Use the Ownership information to identify the team responsible for this workload. Reach out to them to discuss and make necessary adjustments to the workload’s resource configurations. For more information regarding ownership, see Assign ownership teams to monitored entities.
Once the workload’s resource configurations are appropriately adjusted, Kubernetes will automatically work towards bringing the system back to a healthy state.