Kubernetes
- Latest Dynatrace
- App
- 7-min read
The latest Kubernetes experience is optimized for DevOps Platform Engineers and Site Reliability Engineers (SREs), focusing on the health and performance optimization of multicloud Kubernetes environments. The centerpiece of this experience is ") Kubernetes.
Kubernetes.
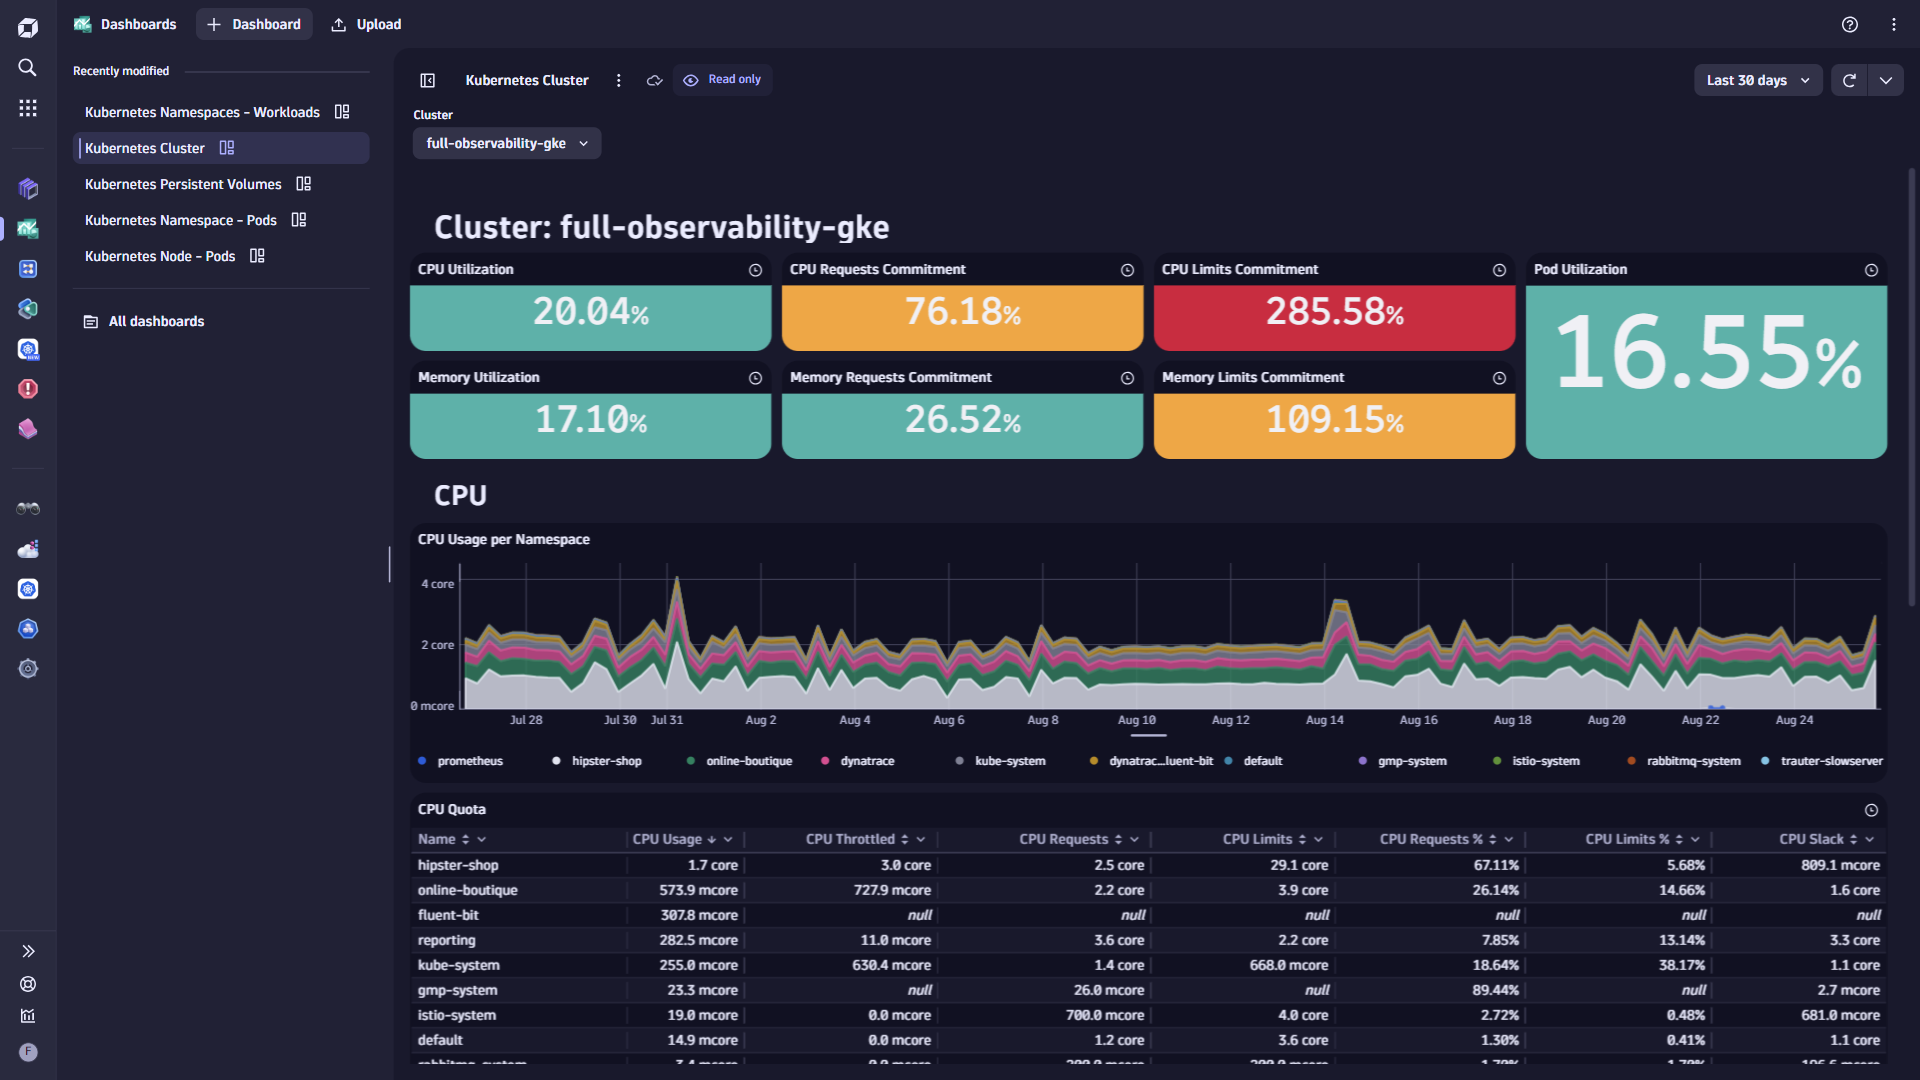
The underlying metrics, events, and logs are all powered by Grail, which supports flexible analytics through the Dynatrace Query Language in Kubernetes,  Dashboards, and
  Workflows.
Prerequisites
- Dynatrace SaaS environment powered by Grail and AppEngine
- DPS license with the Kubernetes Platform Monitoring capability on your Rate Card
- Sufficient permissions to use the Kubernetes within your Dynatrace environment
- ActiveGate version 1.327+ is a prerequisite for Kubernetes Enhanced Object Visibility.
- Older ActiveGate versions are supported in backward compatibility mode; in that mode, an additional Explorer (Classic) tab appears in the UI.
For more details, see getting started FAQ.
The new Kubernetes experience is not available for Managed or SaaS on non-Grail environments—you can continue to use Kubernetes Classic (accessible from the previous Dynatrace via Kubernetes).
Get started
Kubernetes provides a comprehensive view of your environment, enabling you to automate monitoring and optimize the health and performance of your Kubernetes clusters and workloads. This page walks you through the main concepts underlying Kubernetes.
With Kubernetes, you can:
- Set up Kubernetes monitoring with Dynatrace.
- Explore cluster, node, and workload insights.
- Analyze health status with Dynatrace Intelligence.
- Detect and troubleshoot Kubernetes issues.
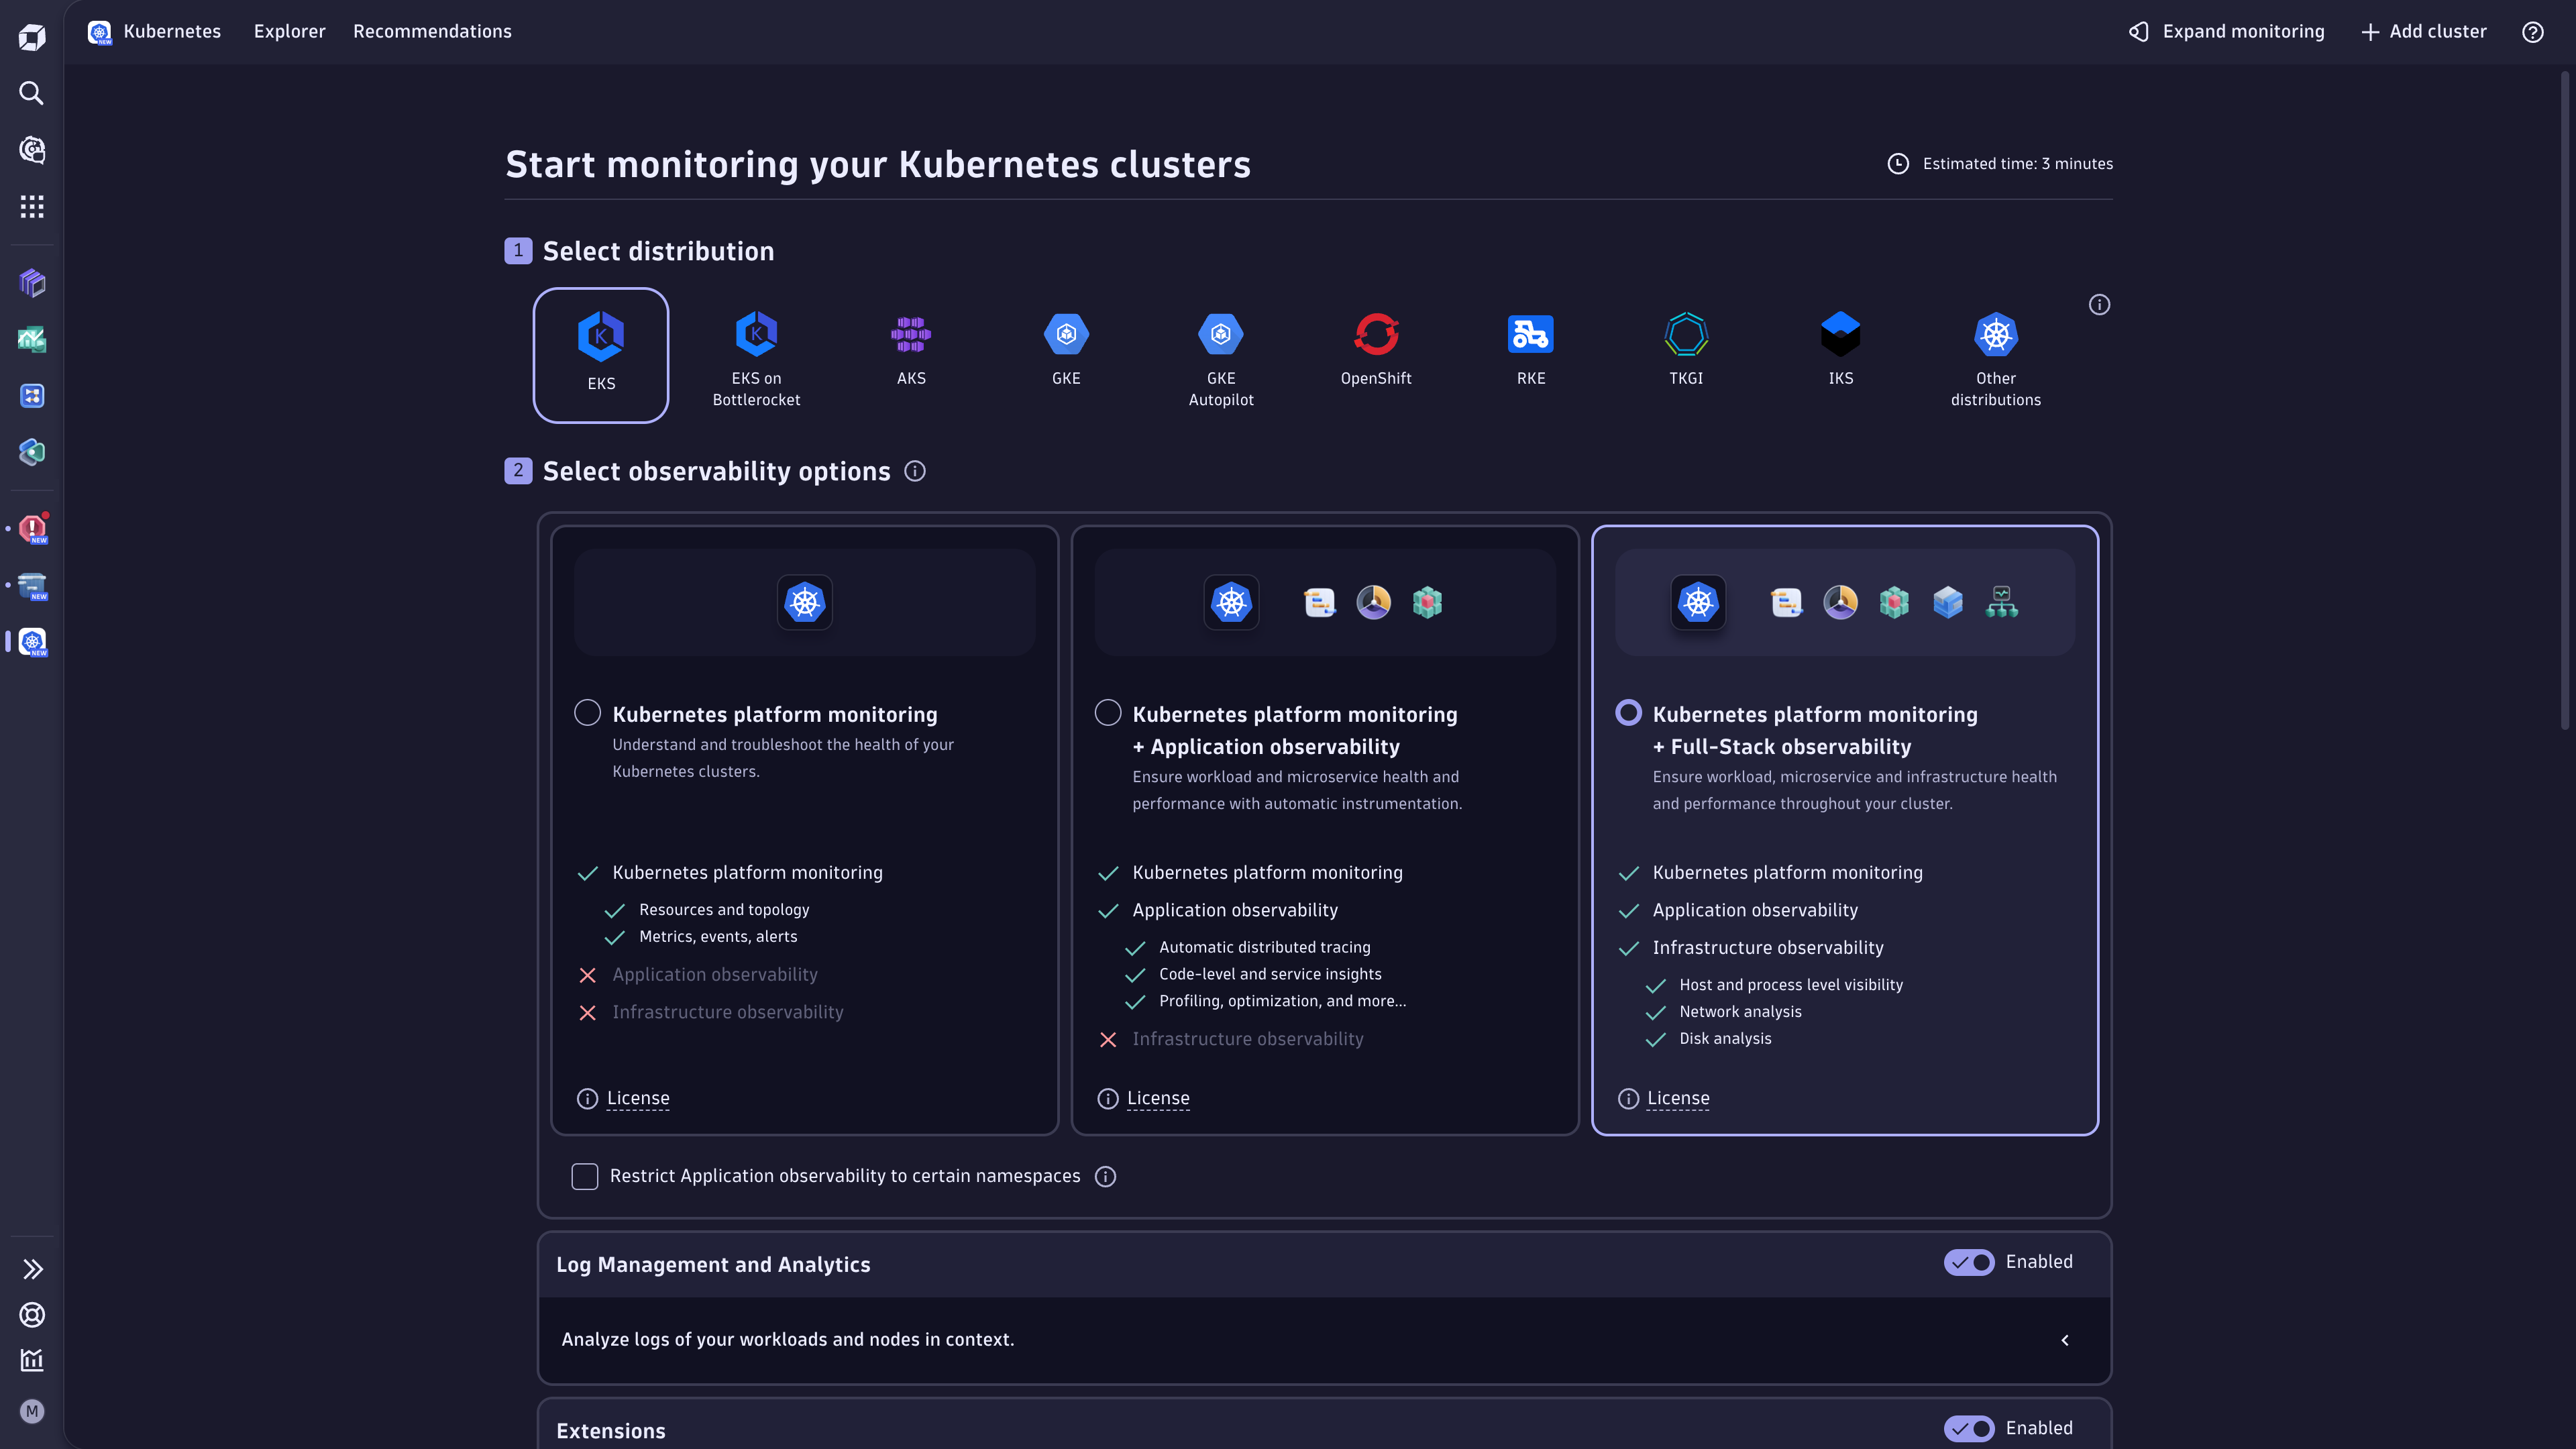
Setup and reference
Use the following guide to set up and configure Kubernetes monitoring in Dynatrace.
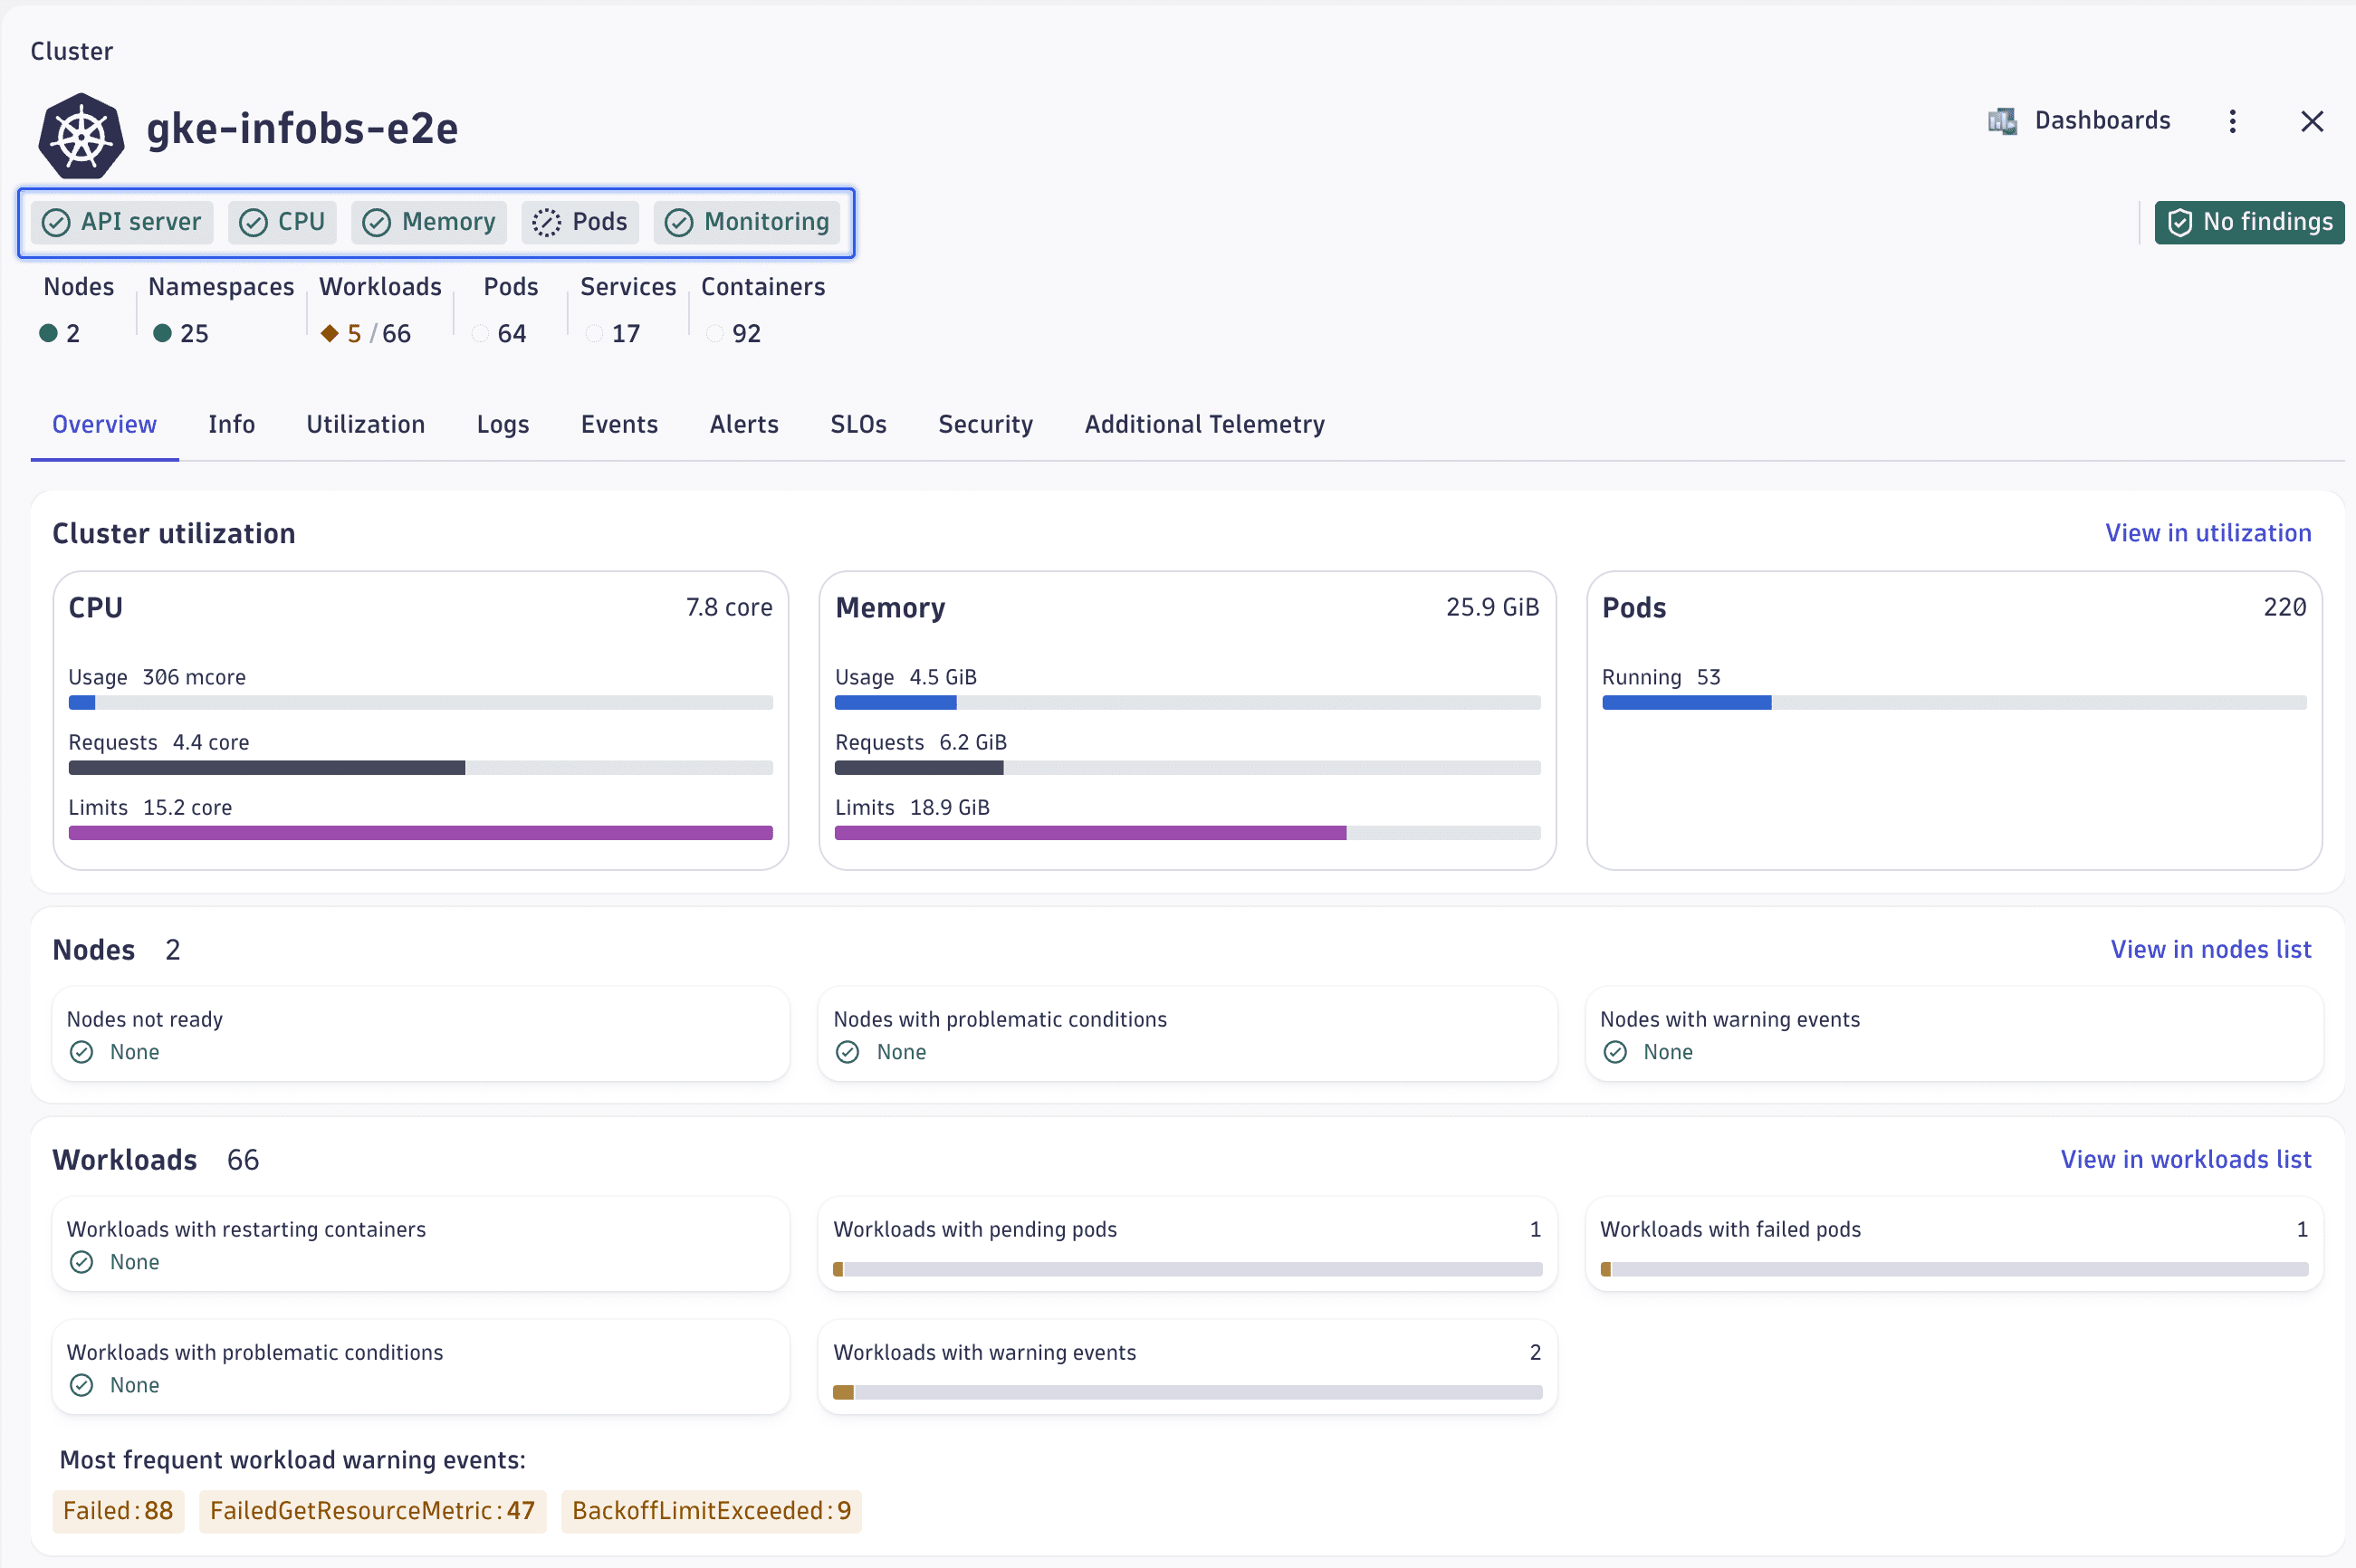
Explorer
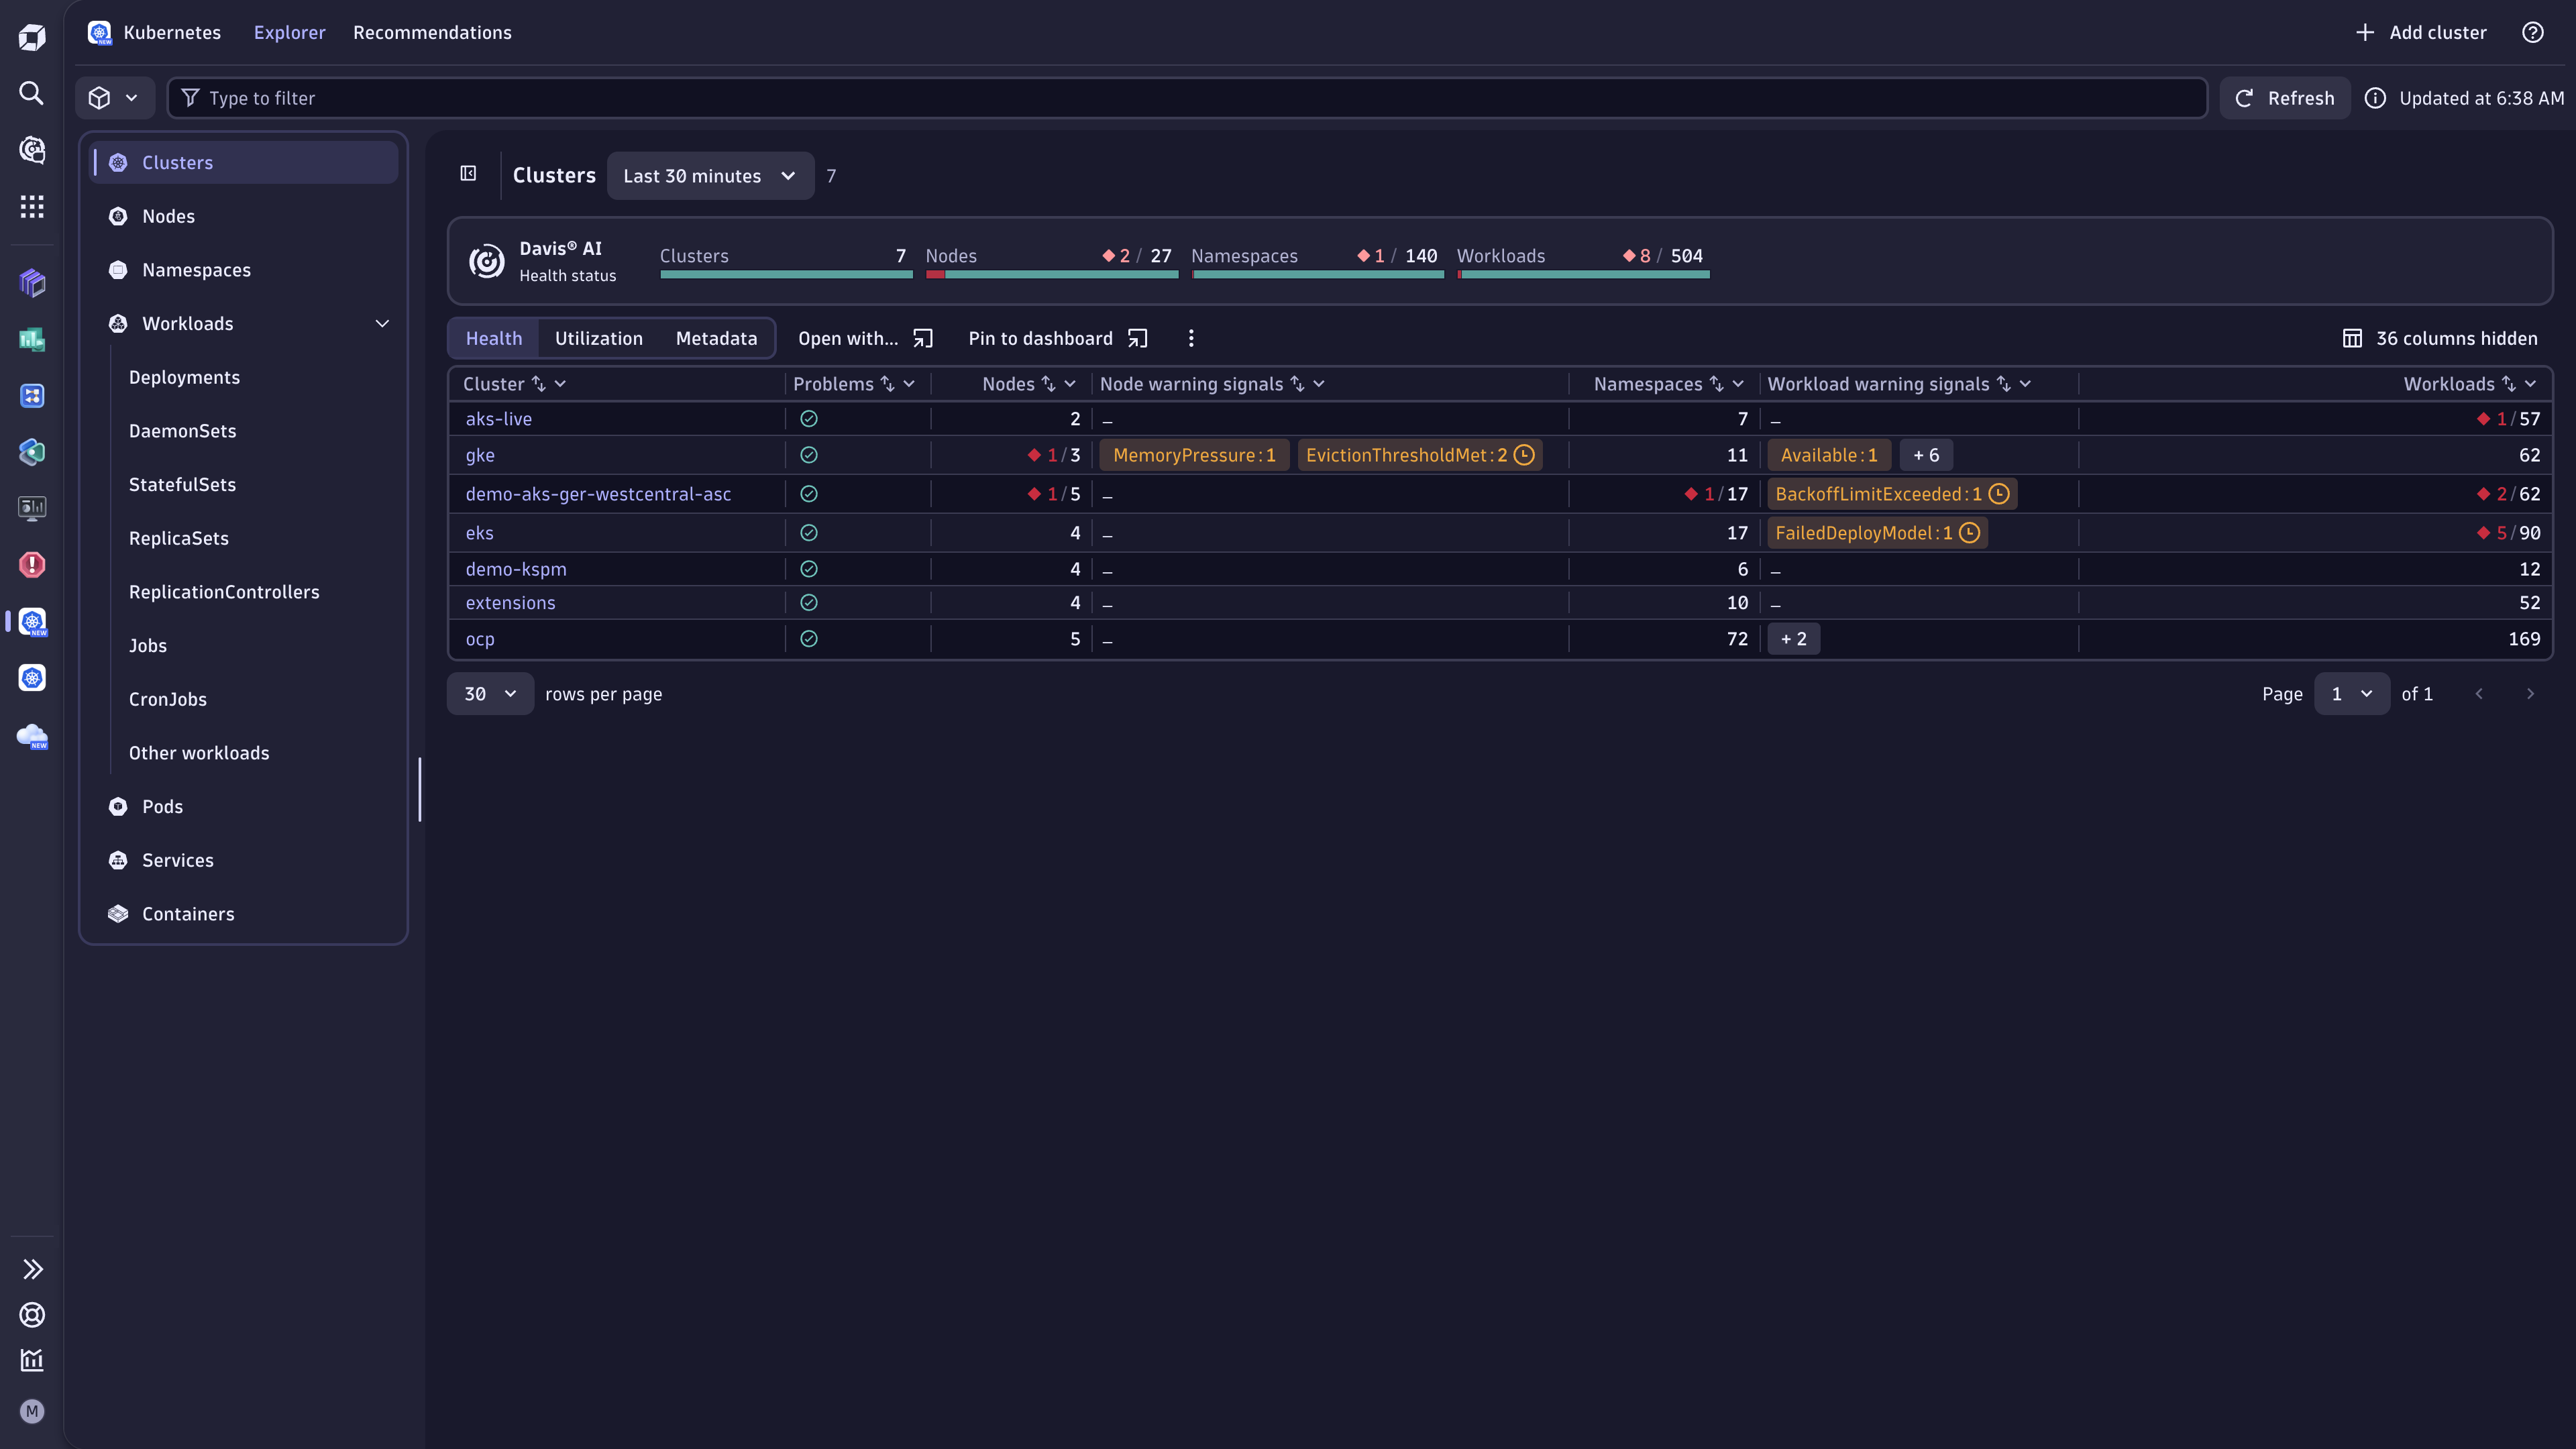
Kubernetes provides an Explorer tab where you can monitor and analyze your Kubernetes environment. The sidebar groups all Kubernetes objects by type—clusters, nodes, namespaces, workloads, pods, services, and containers. Selecting an object opens a detail view with tabs for analyzing health and utilization, as well as for exploring logs, events, ownership, and vulnerabilities.
For details, see Explorer view in Dynatrace apps.
Dynatrace Intelligence health status
The health status in Kubernetes is based on Kubernetes-focused custom alerts. A Kubernetes object (such as a cluster) is considered unhealthy if any of its associated custom alert configurations are in an unhealthy state. Selecting a specific health indicator reveals the underlying reasons.
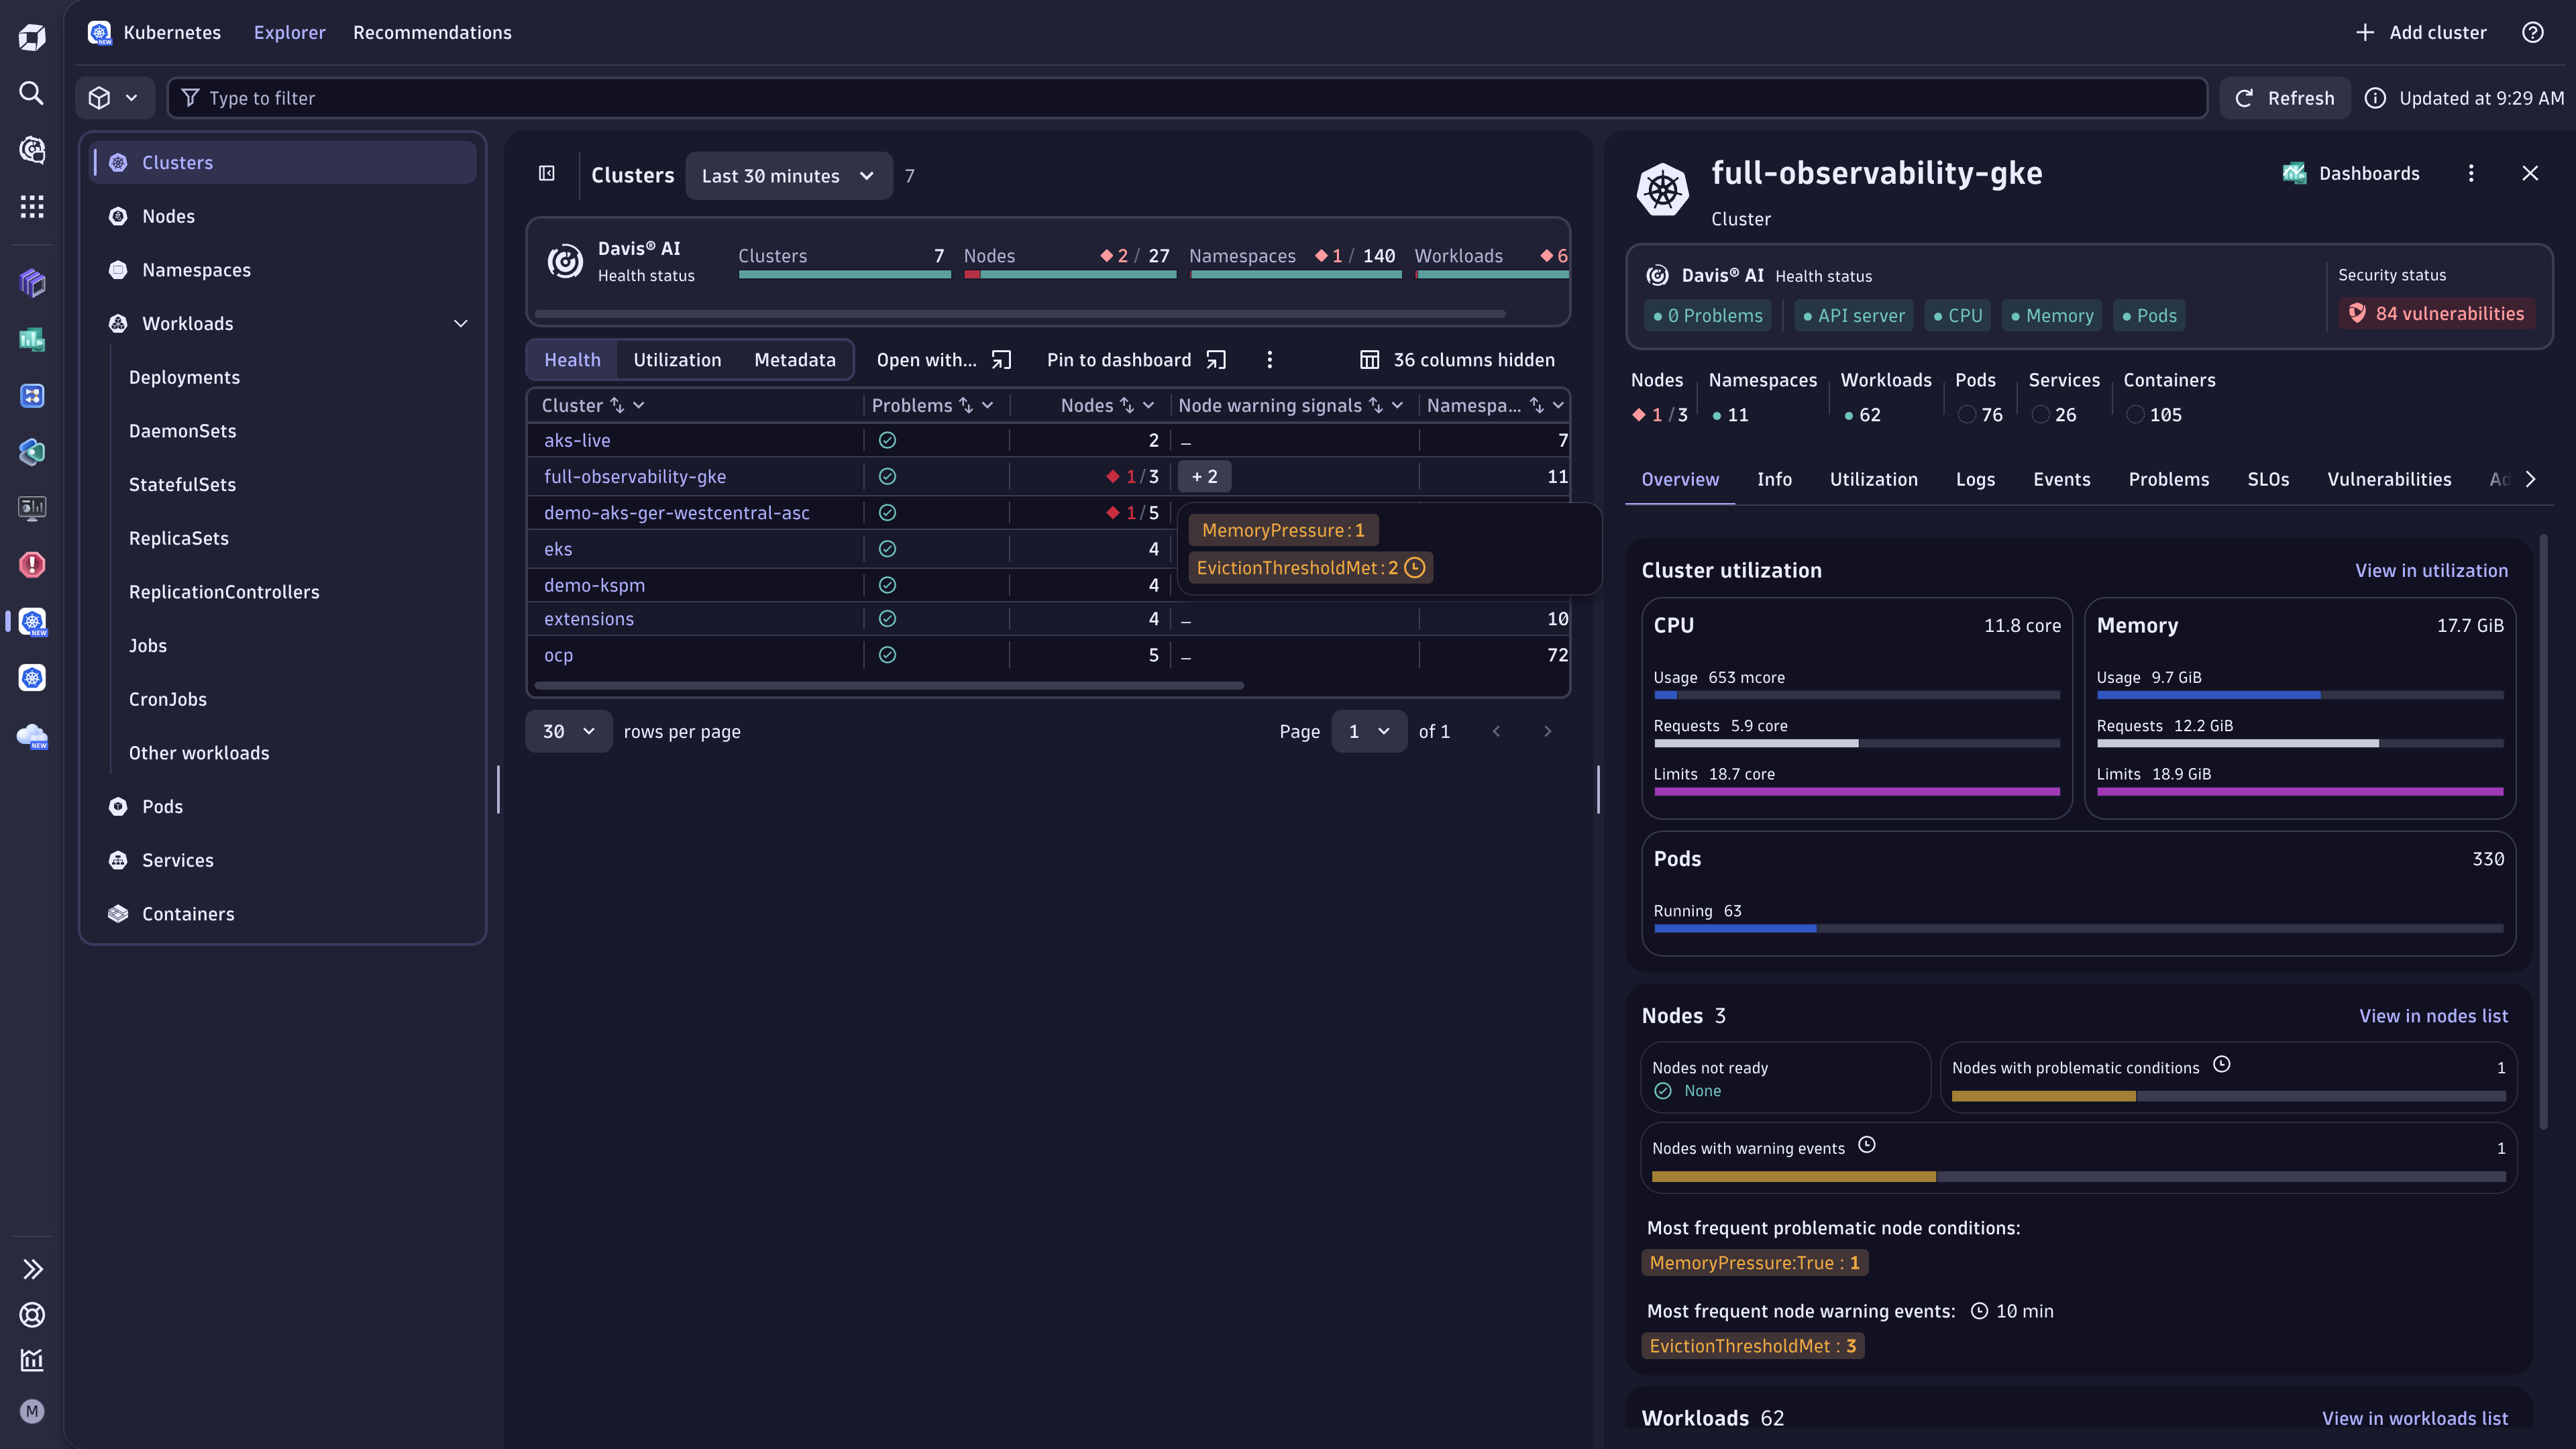
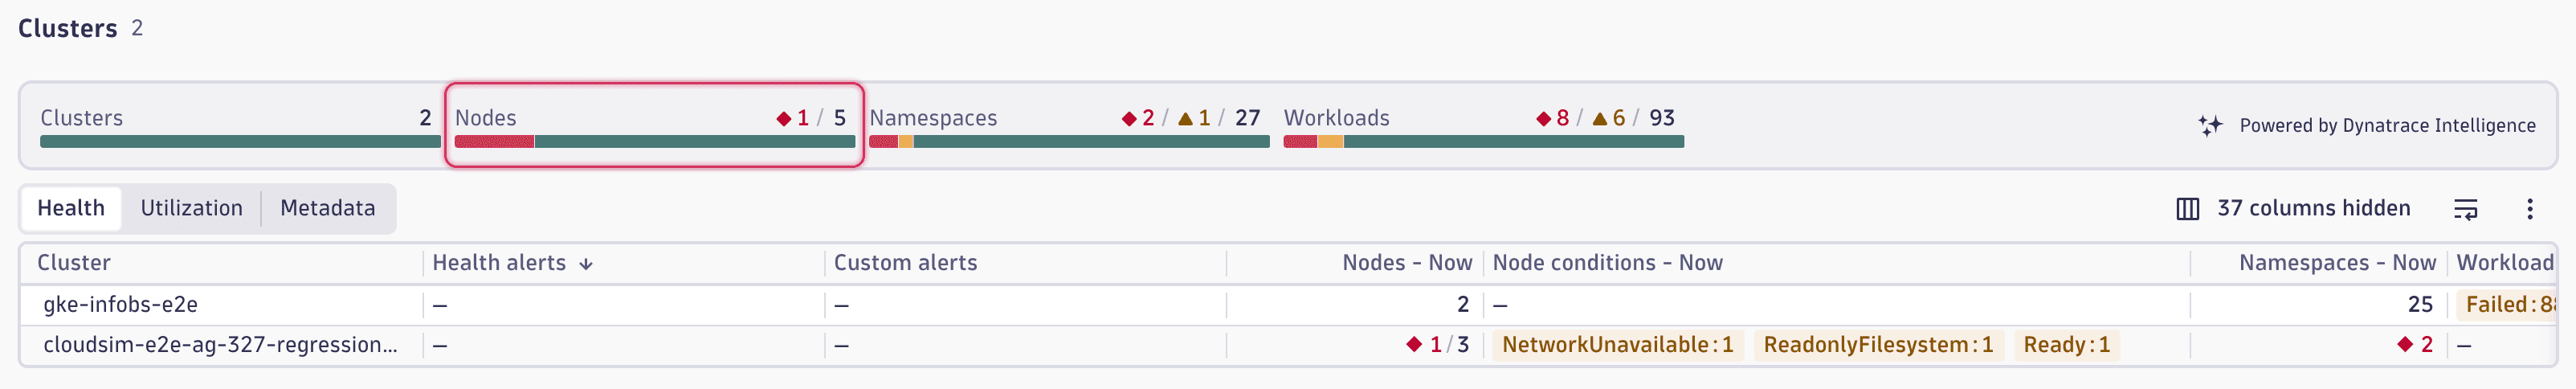
Example
In this example, you can see that 1 node out of 5 is currently considered unhealthy.
-
Select the red number displayed within the health status area to drill down to the list of currently unhealthy nodes.
 Drill-down view of unhealthy nodes in the Kubernetes app
 -
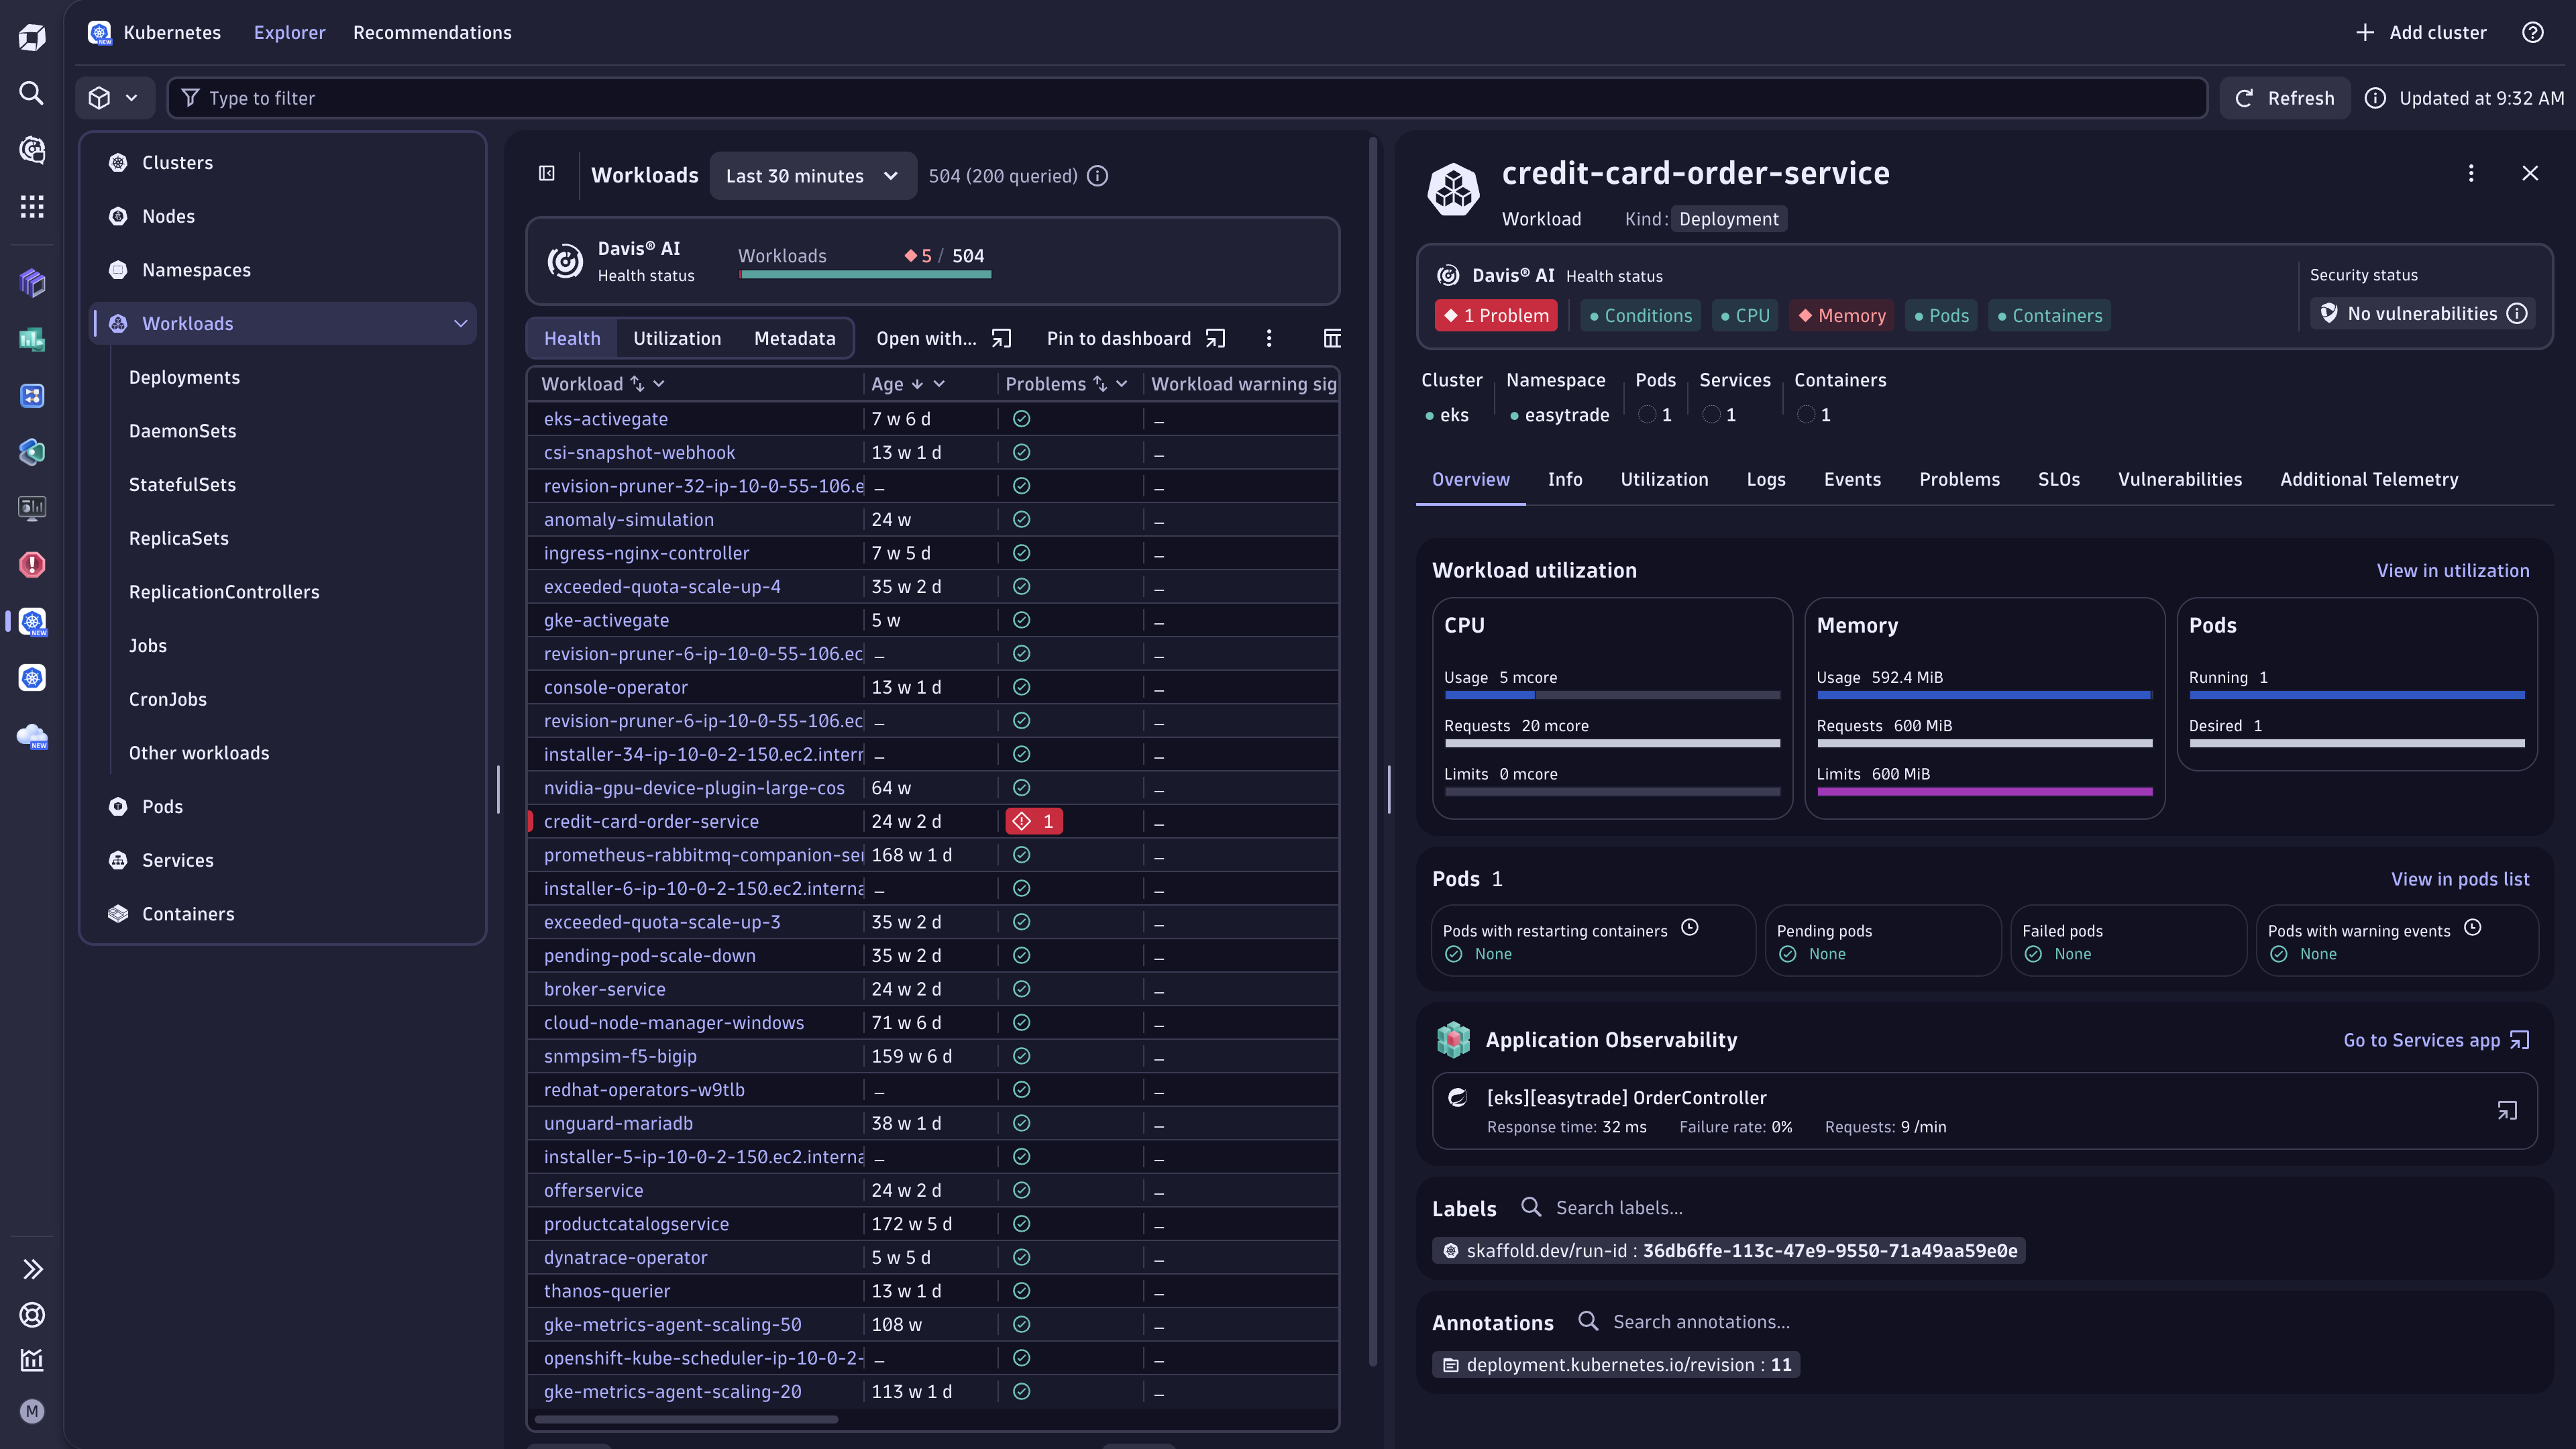
Select any node to open the details view of the problematic node, including key metrics and events that led to their current state.
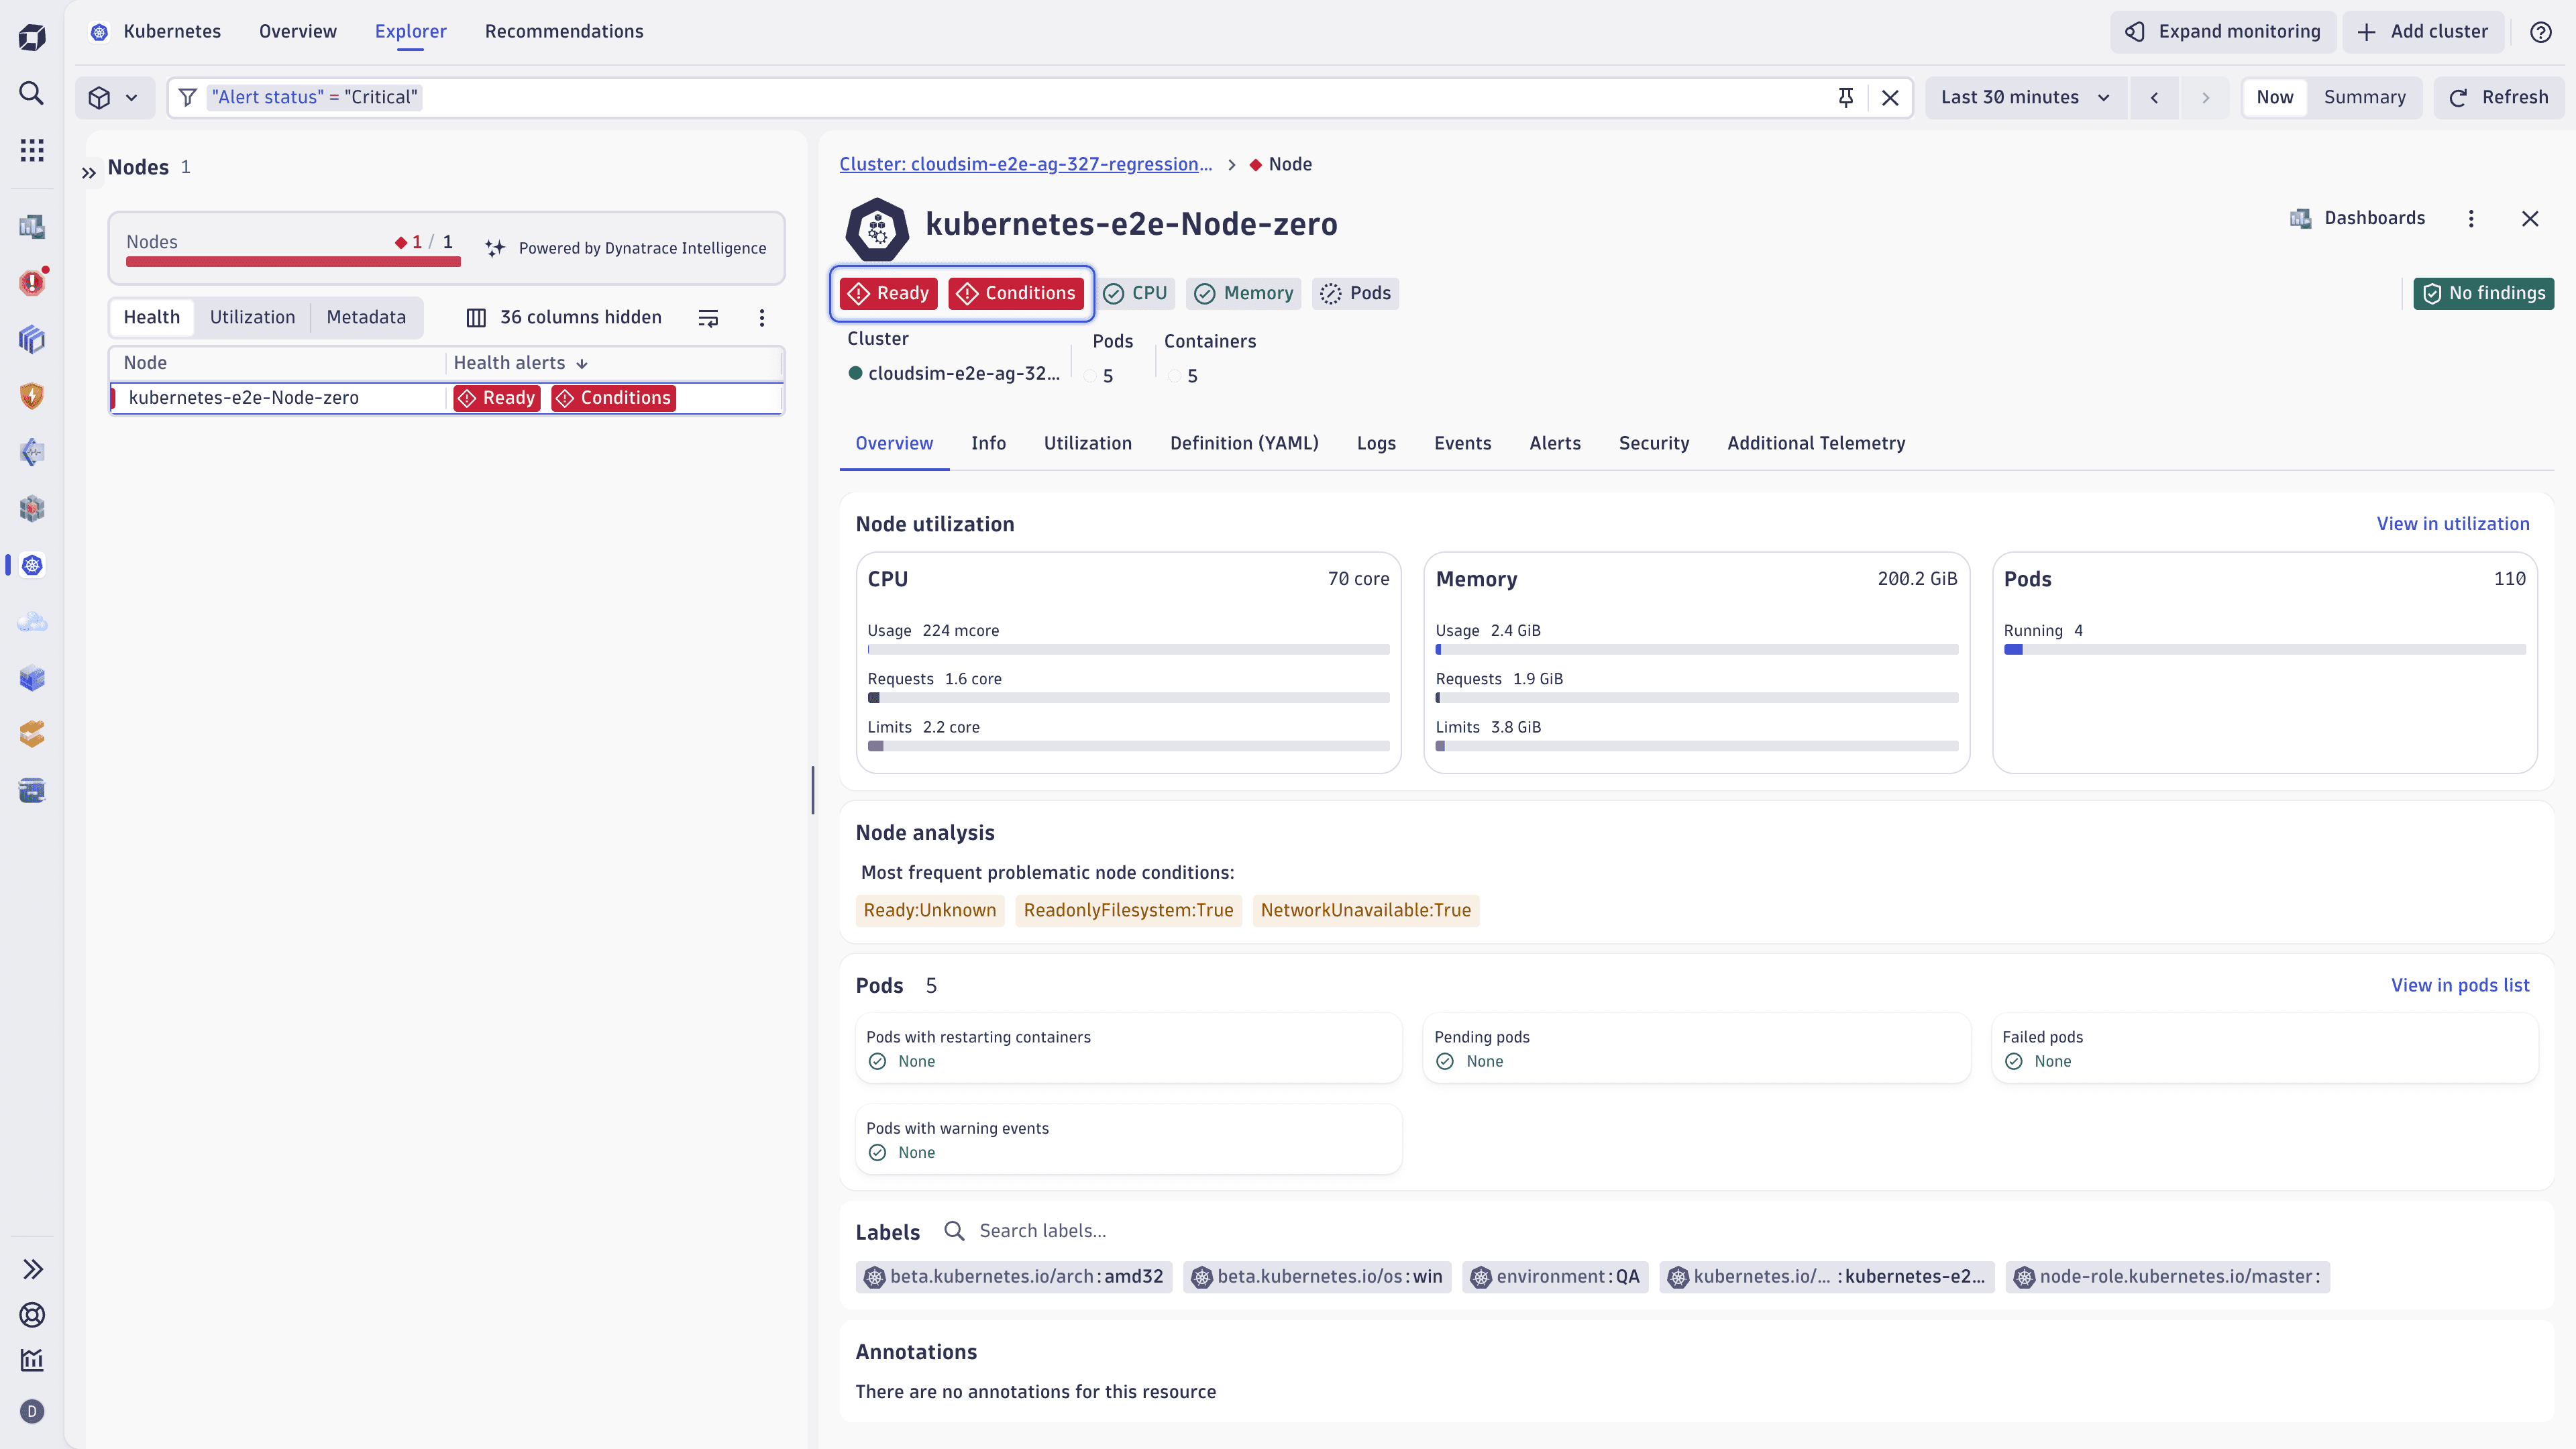 Node details in the Kubernetes app
The Recommendations tab presents best-practice Kubernetes health alerts for clusters, nodes, namespaces, persistent volume claims, and workloads. It highlights which alerts are active, partially active, or inactive across your environment.
Select Activate or Configure to open the settings where you can apply the recommended alert configuration.
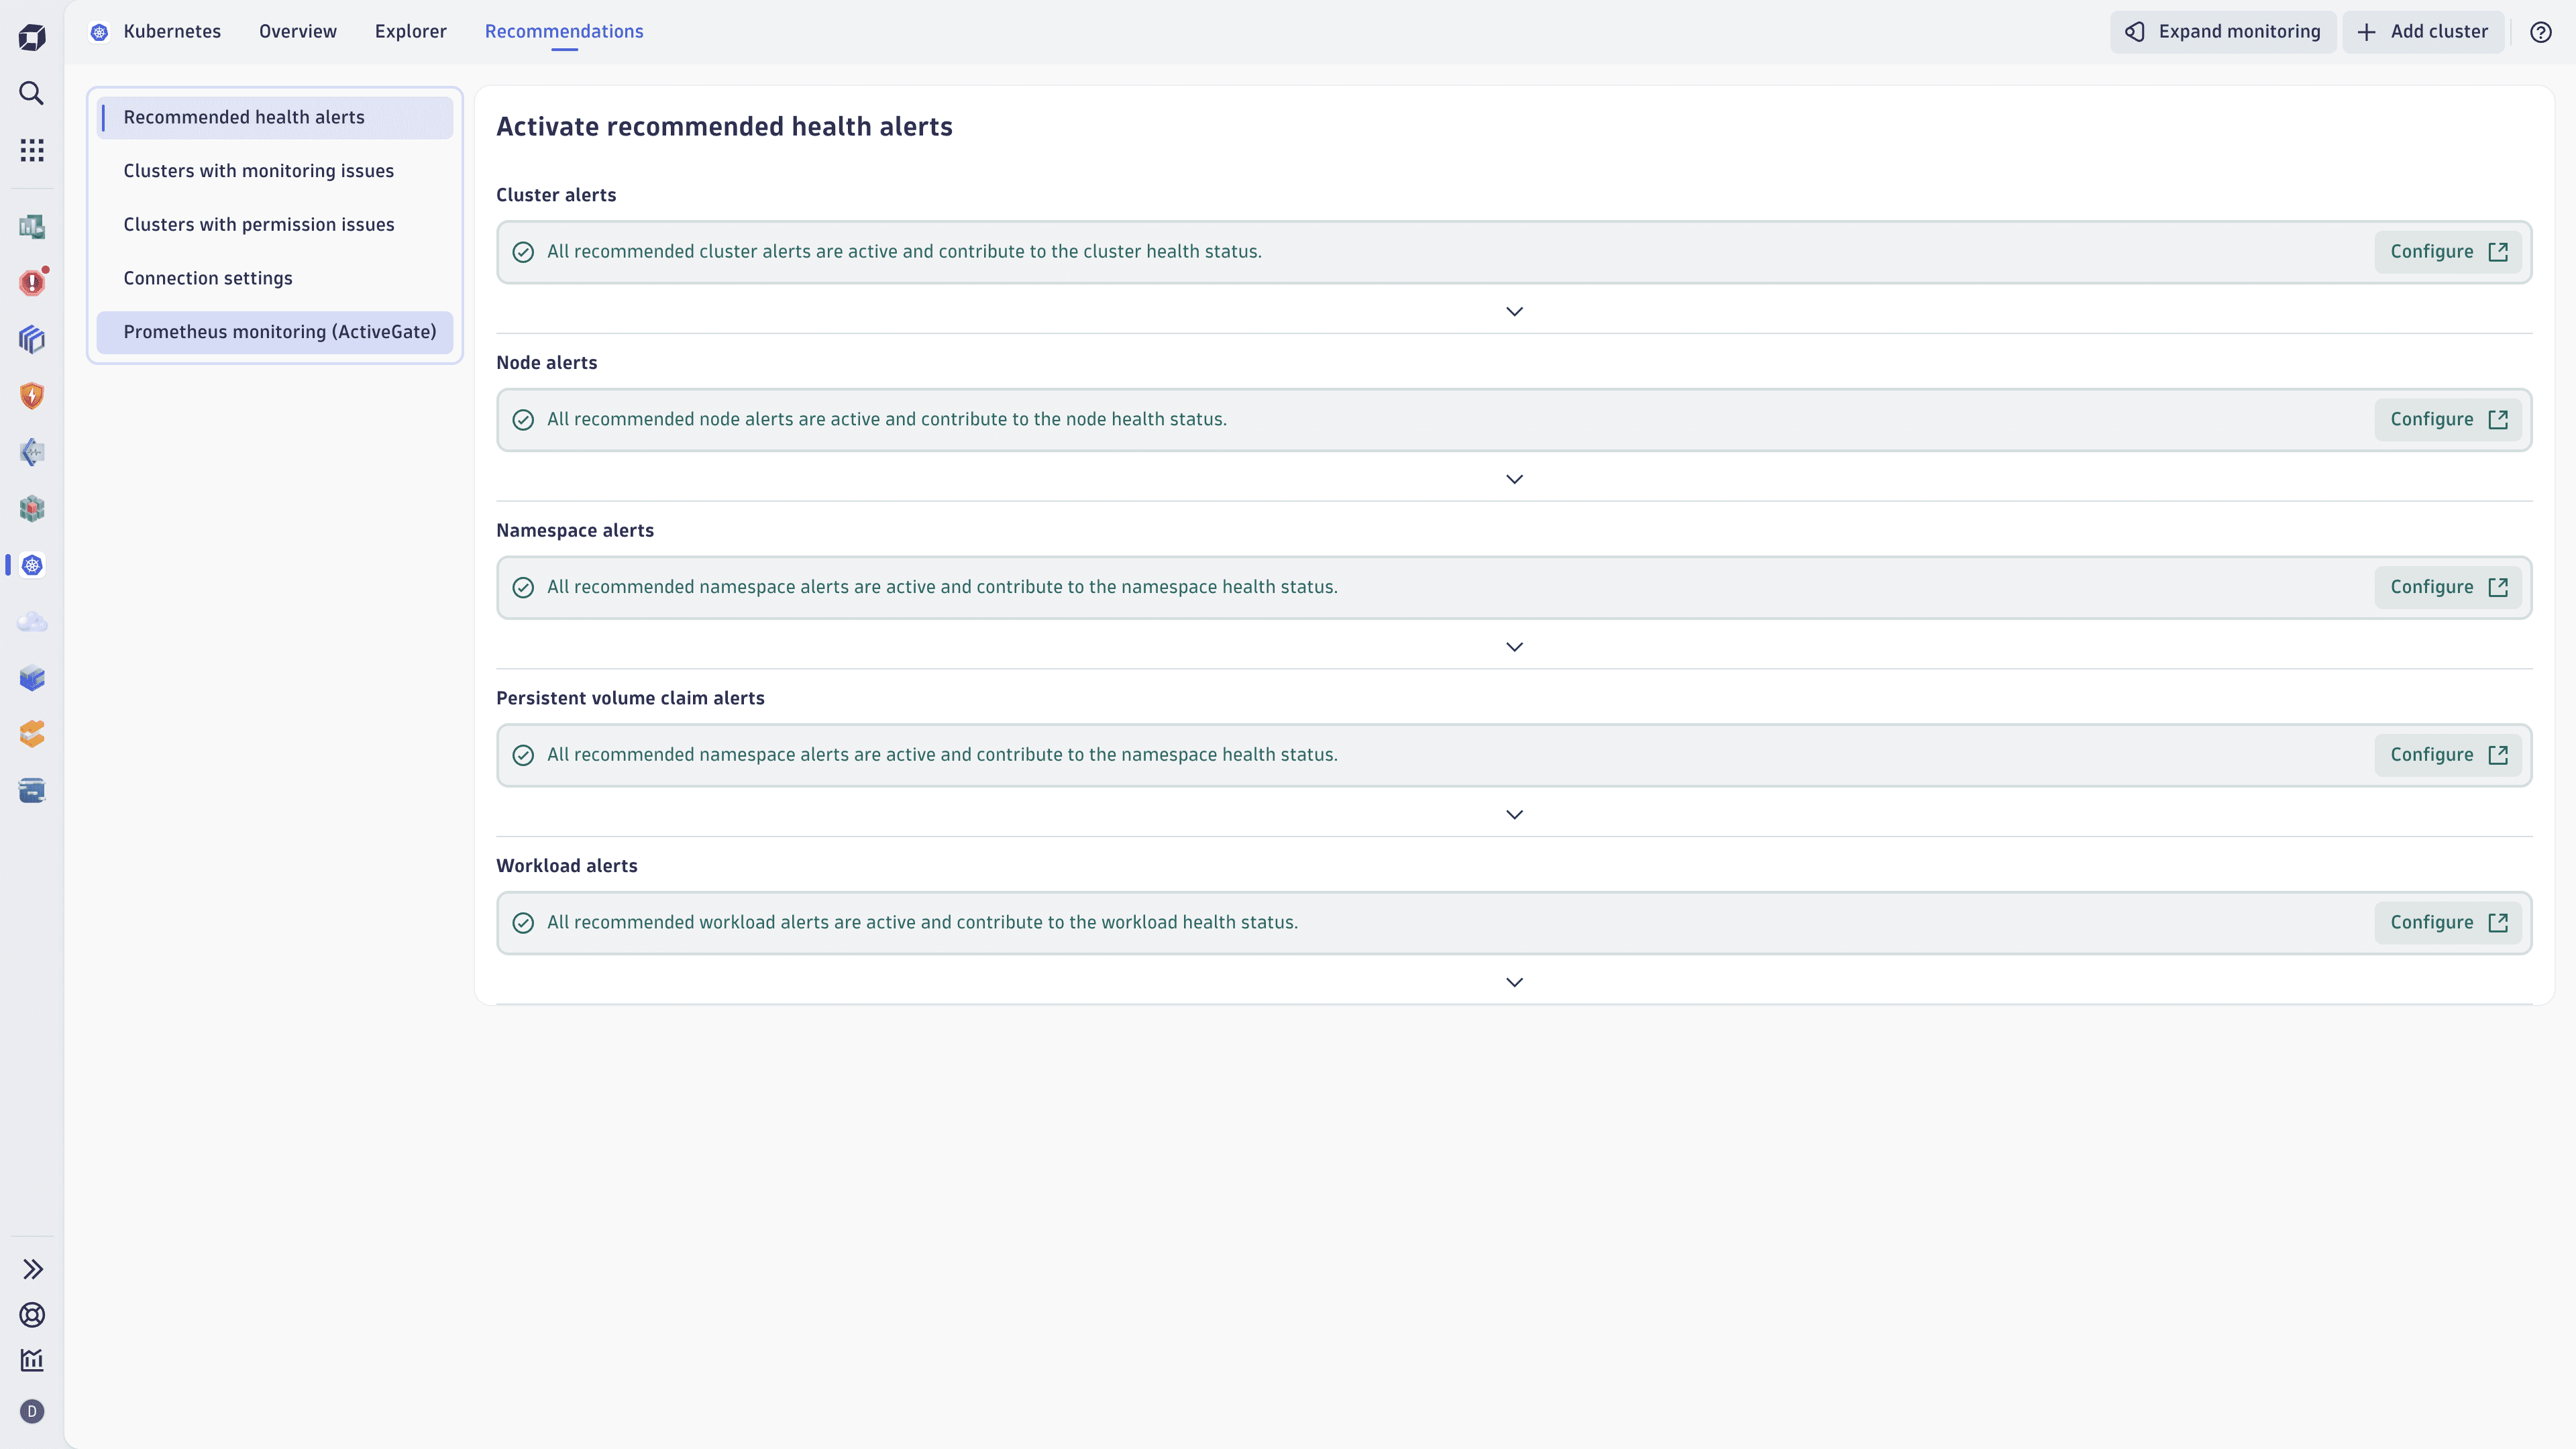 Recommendations in the Kubernetes app
Health alerts and warning signals
Health alerts and warning signals help you monitor your infrastructure by providing clear, actionable insights. These features reduce the noise from infrastructure issues and improve alerting capabilities, so you can focus on what matters most. This is achieved through better categorization of detected malfunctions.
- For critical events, a Health alert is raised, triggering a Dynatrace Problems investigation.
- For non-critical situations, a Warning signal informs you of a potential challenge.
For details, see Health alerts and warning signals.
To enable warning signals for Kubernetes ready-made alerts
- Go to
 Settings > Analyze and alert > Alerts.
 - Under Category update select Updated classification for select ready-made alerts.
- Enable Updated classification of selected ready-made alerts for Kubernetes.
Once enabled, the list of reclassified alerts can be found ine Alert on common Kubernetes/OpenShift issues.
Kubernetes Enhanced Object Visibility
Prerequisites
- Dynatrace SaaS environment powered by Grail and AppEngine
- DPS license with the Kubernetes Platform Monitoring capability on your Rate Card
- Sufficient permissions to use the Kubernetes within your Dynatrace environment
- ActiveGate version 1.327+
Starting January 19, 2026, Kubernetes offers insights into more Kubernetes objects and their YAML definitions:
- Visibility into additional Kubernetes objects: Ingress, NetworkPolicies, CRDs, PVCs, PVs, ConfigMaps, and more.
- Access to YAML definitions to debug and validate configurations in real time.
- Ability to query YAMLs across all clusters and namespaces using Dynatrace Query Language (DQL) to instantly surface misconfigurations, missing references, or policy violations across your Kubernetes environment.
Transition from Explorer Classic
From June 2026, Explorer Classic is transitioning to a 'maintenance only' support mode.
- Clusters running on ActiveGate version 1.327+ that meet all prerequisites will be accessible the new Explorer.
- Clusters that don't meet these requirements will remain visible in Explorer (Classic), with no access to the latest features. To move your clusters to the new Explorer before the automatic migration, upgrade your ActiveGate to version 1.327+ and verify all prerequisites are met.
No Kubernetes monitoring data is lost during this transition. Clusters become visible in the new Explorer as soon as the ActiveGate upgrade completes.
Use cases
Reference
Go to the following reference pages for more information about permissions, available alerts, and default settings for new environments.
Learn more
Dive deeper into Kubernetes with the following resources:
- Playground environment: Test the app in a sandbox environment.
- 0 to Full Observability in Kubernetes in under 3 minutes: A quick video tutorial on how to install Dynatrace Operator.
- Blog post: Unlock the Power of DevSecOps with Newly Released Kubernetes Experience for Platform Engineering

Explore in Dynatrace Hub
Automated change impact analysis for your deployment and release processes.
Kubernetes